

The metabolic regimes of 356 rivers in the United States
- PMID: 30532078
- PMCID: PMC6289110
- DOI: 10.1038/sdata.2018.292
The metabolic regimes of 356 rivers in the United States
Abstract
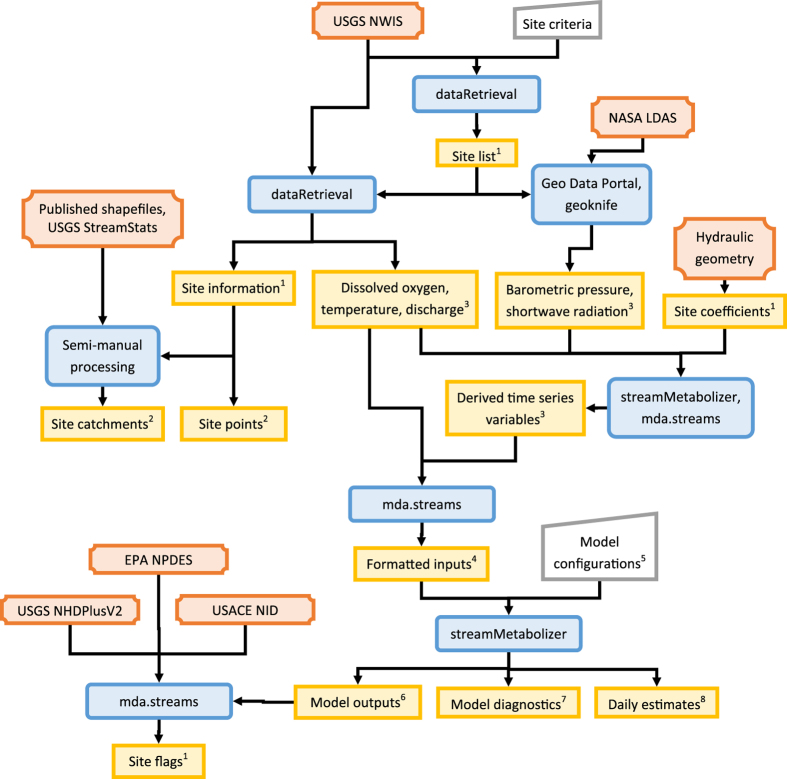
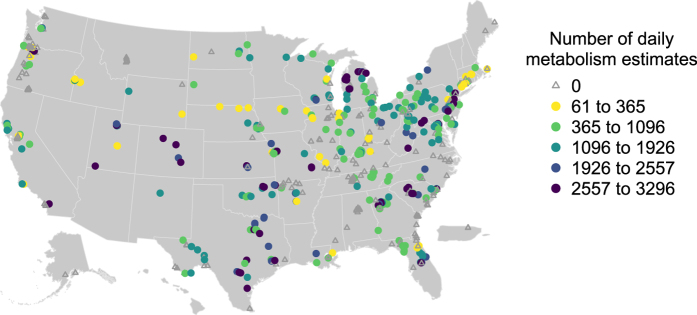
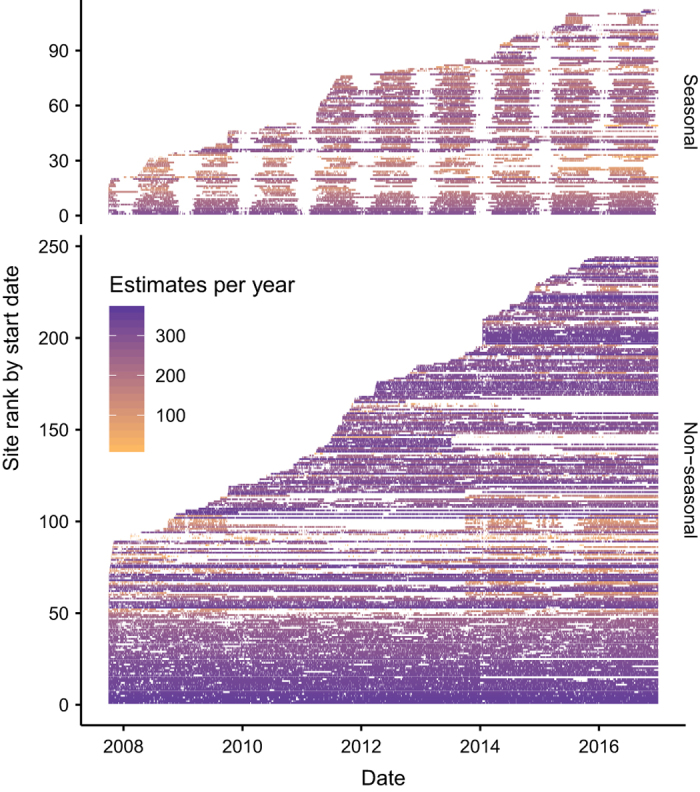
A national-scale quantification of metabolic energy flow in streams and rivers can improve understanding of the temporal dynamics of in-stream activity, links between energy cycling and ecosystem services, and the effects of human activities on aquatic metabolism. The two dominant terms in aquatic metabolism, gross primary production (GPP) and aerobic respiration (ER), have recently become practical to estimate for many sites due to improved modeling approaches and the availability of requisite model inputs in public datasets. We assembled inputs from the U.S. Geological Survey and National Aeronautics and Space Administration for October 2007 to January 2017. We then ran models to estimate daily GPP, ER, and the gas exchange rate coefficient for 356 streams and rivers across the continental United States. We also gathered potential explanatory variables and spatial information for cross-referencing this dataset with other datasets of watershed characteristics. This dataset offers a first national assessment of many-day time series of metabolic rates for up to 9 years per site, with a total of 490,907 site-days of estimates.
Conflict of interest statement
The authors declare no competing interests.
Figures
Dataset use reported in
- doi: 10.1002/2017JG004140
References
Data Citations
-
- Appling A. P., et al. . 2018. U.S. Geological Survey. https://doi.org/10.5066/F70864KX - DOI
References
-
- Fisher S. G. & Likens G. E. Stream ecosystem: Organic energy budget. BioScience 22, 33–35 (1972).
-
- Jones J. B., Schade J. D., Fisher S. G. & Grimm N. B. Organic matter dynamics in Sycamore Creek, a desert stream in Arizona, USA. Journal of the North American Benthological Society 16, 78–82 (1997).
-
- Roberts B., Mulholland P. & Hill W. Multiple scales of temporal variability in ecosystem metabolism rates: Results from 2 years of continuous monitoring in a forested headwater stream. Ecosystems 10, 588–606 (2007).
-
- Izagirre O., Agirre U., Bermejo M., Pozo J. & Elosegi A. Environmental controls of whole-stream metabolism identified from continuous monitoring of Basque streams. Journal of the North American Benthological Society 27, 252–268 (2008).
-
- Roley S. S., Tank J. L., Griffiths N. A., Hall R. O. Jr. & Davis R. T. The influence of floodplain restoration on whole-stream metabolism in an agricultural stream: Insights from a 5-year continuous data set. Freshwater Science 33, 1043–1059 (2014).
Publication types
LinkOut - more resources
Full Text Sources
Miscellaneous
