. 2018 Nov 15:10:5747-5758.
doi: 10.2147/CMAR.S183696. eCollection 2018.

CDK7 inhibition is a novel therapeutic strategy against GBM both in vitro and in vivo

Affiliations

CDK7 inhibition is a novel therapeutic strategy against GBM both in vitro and in vivo

Wei Meng et al. Cancer Manag Res. .

Abstract

Background: Glioblastoma multiforme (GBM) remains to be one of the top lethal cancer types for adult to date. Current GBM therapies suffer greatly from the highly heterogeneous and adaptable nature of GBM cells, indicating an urgent need of alternative therapeutic options. In this study, we focused on identifying novel epigenetic targeted strategy against GBM.

Methods: A collection of epigenetic modulating small molecules were subjected to anti-GBM screening and the inhibitory effect of identified agent was validated both in vitro and in vivo. Genetic targeting approaches were also used to verify the on-target inhibitory effect of identified agent. Furthermore, the inhibitory mechanism of identified agent was investigated by integrative analyses of drug-treated GBM cells and GBM tumor databases.

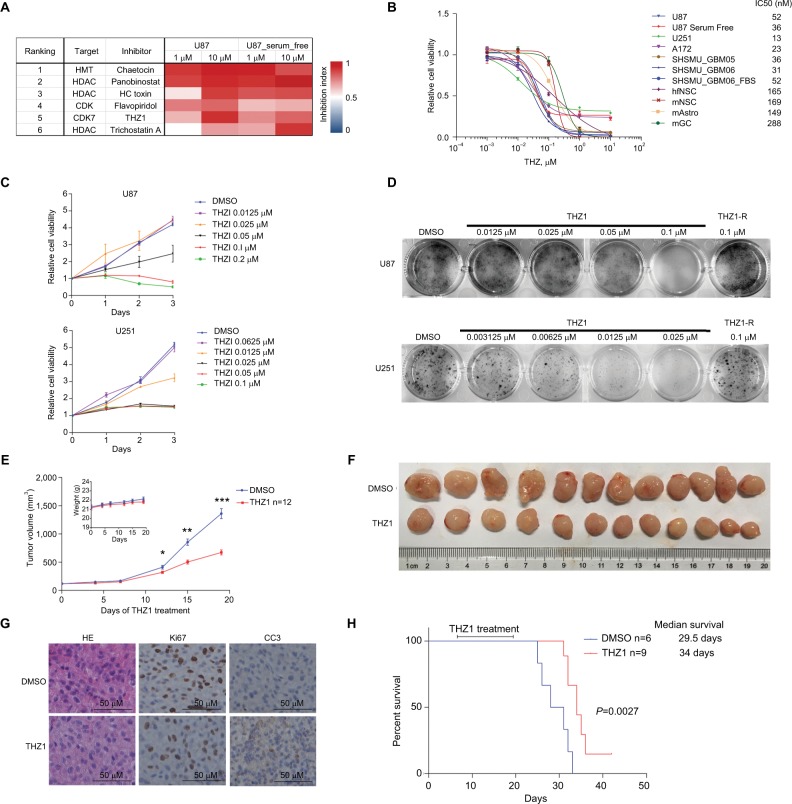
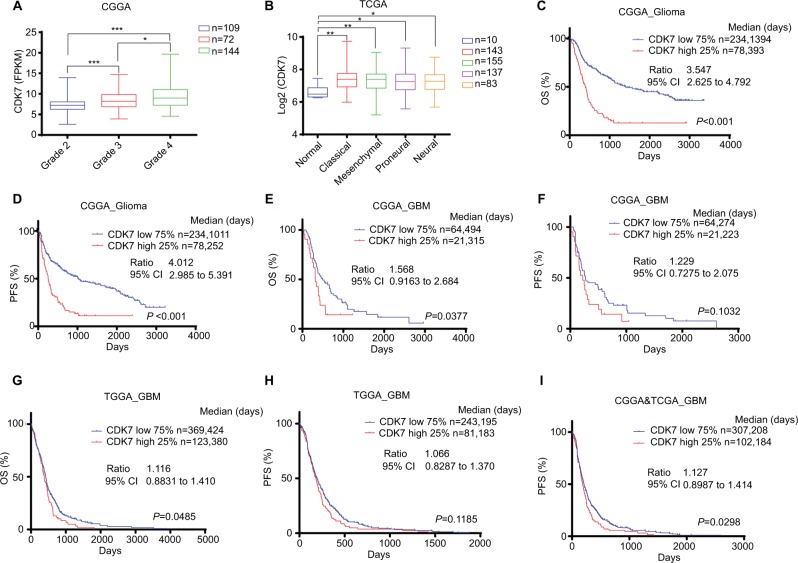
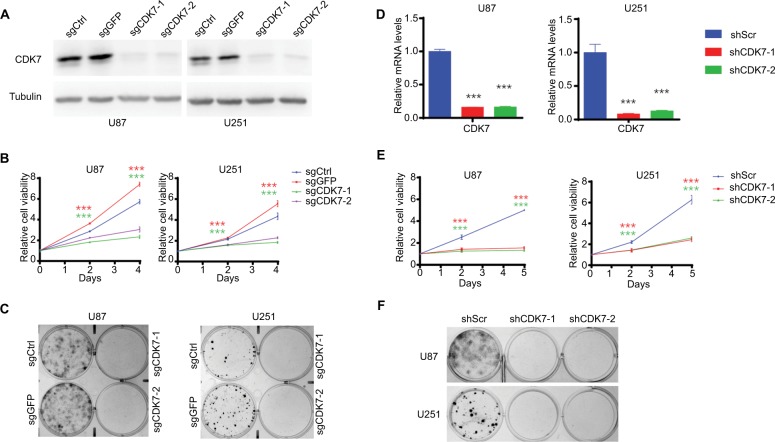
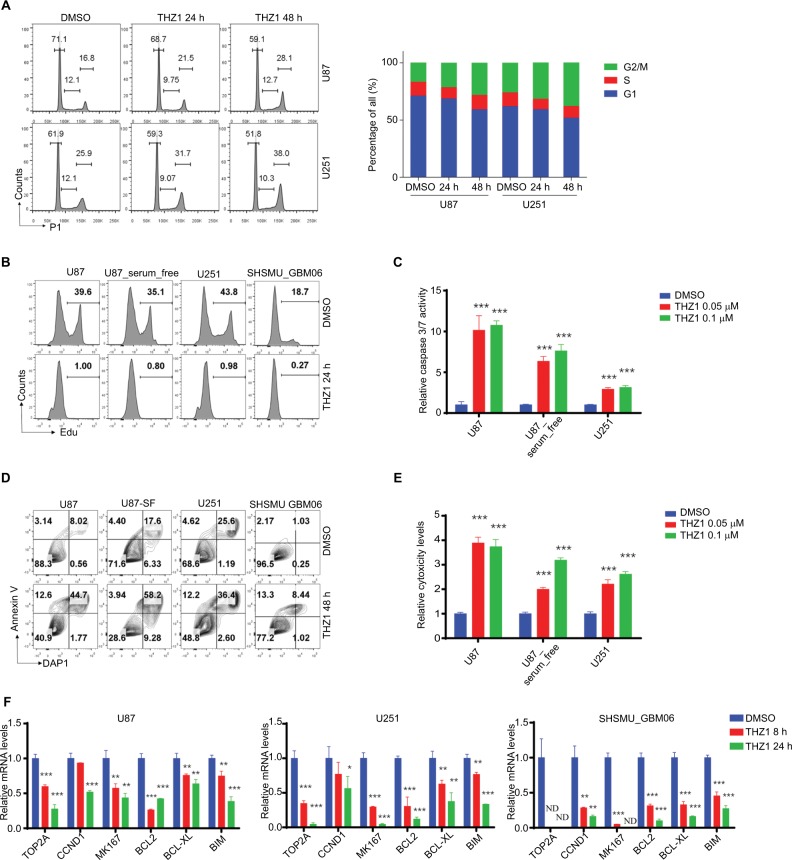
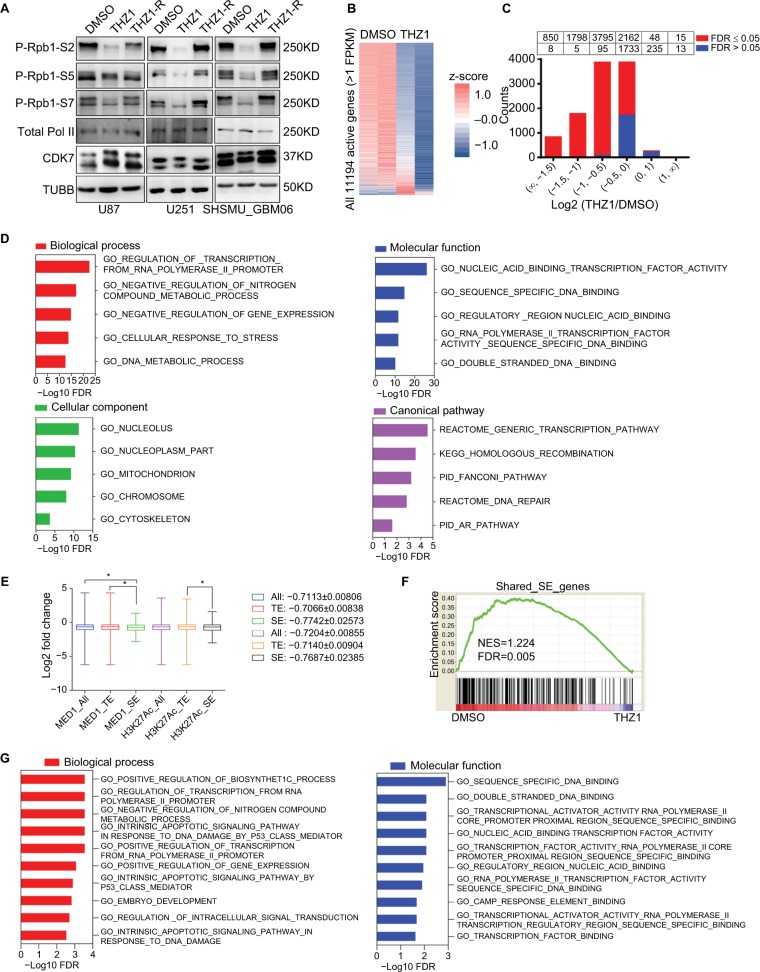
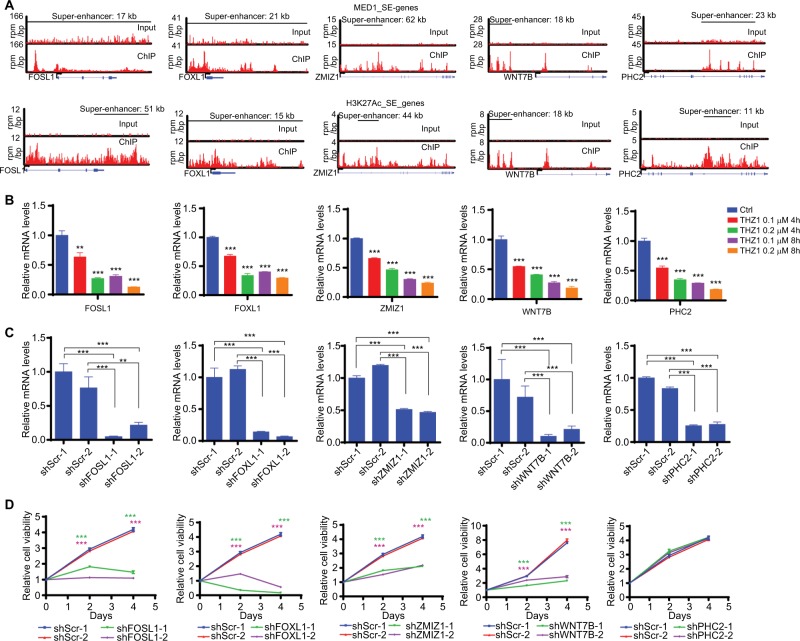
Results: The covalent CDK7 inhibitor THZ1 was one of the top hits in our screening and its anti-GBM activity was confirmed both in vitro and in vivo. CDK7 inhibition through CRISPR-Cas9 or RNA interference also markedly disrupted GBM cell growth. Furthermore, analyses of multiple GBM tumor databases consistently revealed that CDK7 expression was significantly elevated in GBM compared with normal brain tissues and lower grade gliomas. Higher CDK7 expression was correlated with worse prognosis for both glioma and GBM. Mechanistically, THZ1 treatment led to considerable disruption of global gene transcription in GBM cells, preferentially targeting those associated with super-enhancers (SEs). We also showed that THZ1 sensitive and SE-related genes had important roles for GBM growth.

Conclusion: Our study shows that targeting SE-associated transcription addiction by CDK7 inhibition could be an effective therapeutic strategy against GBM.

Keywords: CDK7; GBM; THZ1; epigenetic targeted therapy; transcriptional addiction.


Conflict of interest statement

Disclosure The authors report no conflicts of interest in this work.

Figures

Figure 1
Figure 1
THZ1 inhibits growth of GBM in vitro and in vivo. Notes: (A) Top ranked six agents with IC50<1 µM on our drug screen are presented. (B) Dose–response curves of long-established GBM cell lines (indicated in blue color), patient-derived GBM cell lines (indicated in red color) and control cell lines (indicated in green color). Data are shown as mean ± SD (C) U87 or U251 cells were treated with DMSO or THZ1 at indicated concentrations. Cell viabilities (mean ± SD) were assessed at day 0, 1, 2, and 3 after treatment. (D) Colony formation assay was performed on U87 or U251 cells as indicated. Crystal violet staining images are shown. (E) Tumor growth and body weight curves of subcutaneous tumor model. Data were presented as mean ± SEM (*P<0.05, ** P<0.01, *** P<0.001). Two-tailed Student’s t-test. (F) Images of subcutaneous tumors from vehicle and THZ1 treatment groups (n=12 each). (G H&E and immunohistochemistry staining of Ki67 and CC3 of tissue sections from vehicle or THZ1 treated subcutaneous tumor. Original magnification, ×400. (H) Kaplan– Meier survival curves and median survival length of orthotopic tumor models are shown (log-rank test). Abbreviations: CC3, cleaved caspase-3; GBM, glioblastoma multiforme.
Figure 2
Figure 2
CDK7 is a prognostic marker of glioma and GBM. Notes: (A,B) Box plots of CDK7 expression levels in glioma or GBM samples from CGGA (A) or TCGA (B) databases. P-values were determined by Two-tailed Student’s t-test. *P<0.05, **P<0.01***P<0.001. (C–I) Kaplan–Meier plots showing OS or PFS rate in CGGA_Glioma, CGGA_GBM, TCGA_GBM or CGGA and TCGA combined cohorts comparing CDK7-high (red) vs CDK7-low (blue) patients. Median survival days, ratio, and 95% CI were shown. Abbreviations: CGGA, Chinese Glioma Genome Atlas; GBM, glioblastoma multiforme; OS, overall survival; PFS, progression-free survival; TCGA, The Cancer Genome Atlas.
Figure 3
Figure 3
Targeting CDK7 by CRISPR-Cas9 or RNA interference inhibits growth of GBM cells. Notes: (A) Knockout efficiencies of sgCDK7s are shown by Western blot. (B) Cell growth of GBM cells infected with CRISPR-Cas9 expressing lentivirus as indicated. Green and red asterisks indicate P-values of sgCDK7-1 and sgCDK7-2 group compared with control (sgCtrl plus sgGFP), respectively. (C) Colony formation assay was performed on GBM cells infected with CRISPR-Cas9 expressing lentivirus as indicated and crystal violet staining images are shown. (D) Knockdown efficiencies of shCDK7s were determined by RT-qPCR (n=3). (E) Cell growth curve of GBM cells infected with shRNA expressing lentivirus as indicated. Red and green asterisks indicate P-values of shCDK7-1 and shCDK7-2 group compared with shScr, respectively. (F) Colony formation assay was performed on GBM cells infected with shRNA expressing lentivirus as indicated and crystal violet staining images are shown. P-values were determined by Two-tailed Student’s t-test. ***P<0.001. Abbreviations: GBM, glioblastoma multiforme; RT, real-time.
Figure 4
Figure 4
THZ1 causes cell cycle arrest, shuts off proliferation, and induces apoptosis in GBM cells. Notes: (A) FACS Cell cycle analyses of GBM cells exposed to DMSO or 0.1 µM THZ1 for 24 or 48 hours. The percentages of each cell cycle phase are presented in bar chart on the right. (B) Cell proliferation analyses of GBM cells treated with DMSO or 0.1 µM THZ1 for 24 hours with EdU incorporation FACS assay. Percentages of EdU+ cells are presented. (C) Caspase 3/7 activity of GBM cells treated with DMSO or THZ1 at indicated concentrations for 48 hours with Caspase-Glo assay. (D) Apoptosis analyses of GBM cells treated with DMSO or 0.1 µM THZ1 for 48 hours by Annexin-V staining FACS assay. Percentages of each quadrant are presented. (E) Cytotoxicity of GBM cells treated with DMSO or THZ1 at indicated concentrations for 48 hours with Cytotox-Glo assay. (F) RT-qPCR analyses of mRNA levels of proliferation and anti-apoptosis-related genes in GBM cells treated with DMSO or 0.1 µM THZ1 for 8 or 24 hours. P-values were determined by Two-tailed Student’s t-test. *P<0.05, **P<0.01***P<0.001. Abbreviations: FACS, fluorescence-activated cell sorting; GBM, glioblastoma multiforme: ND, not detected; RT, real-time.
Figure 5
Figure 5
THZ1 inhibits global gene transcription and preferentially targets super-enhancer-associated genes in GBM cells. Notes: (A) Immunoblotting analyses of RNAPII CTD phosphorylation in GBM cells treated with DMSO, THZ1 (0.1 µM) or THZ1-R (0.1 µM). (B) Heatmap of relative gene expression levels of all active transcripts in U87 cells treated with THZ1 (0.1 µM for 8 hours) vs DMSO. (C) Histogram of active transcript counts grouped by fold change of gene expression in response to THZ1 treatment. Red and blue bars indicated FDR ≤0.05 or FDR >0.05, respectively. (D) Top five enriched GO categories of THZ1-sensitive transcripts (log2FC≤−1.5, FDR ≤0.05). (E) Box plots of log2 fold changes for all active transcripts (All) or those associated with TE or SE in U87 cells treated with 0.1 µM THZ1 for 8 hours. *P<0.05, Two-tailed Student’s t-test. (F) Gene set enrichment analysis plot showing significant enrichment of SE-associated genes in DMSO-treated cells relative to THZ1-treated cells. (G) Top 10 enriched GO biological process and molecular function categories of THZ1-sensitive SE-associated transcripts (log2FC≤−1, FDR ≤0.05). Abbreviations: CTD, C-terminal domain; FDR, false discovery rate; GBM, glioblastoma multiforme; GO, gene ontology; NES: normalized enrichment score; SE, super enhancer; TE, typical enhancer.
Figure 6
Figure 6
Functional validation of THZ1-sensitive SE-associated genes in GBM cells. Notes: (A) Gene tracks of MED1 (top) or H3K27Ac (bottom) ChIP-seq occupancy at indicated SE-associated gene loci. The x-axis shows genomic position and the y-axis shows the signal of binding in units of reads per million bin (rpm/bp). (B) RT-qPCR analyses of mRNA levels of 5 selected THZ1-sensitive SE-associated genes in response to THZ1 treatment as indicated. (C) RT-qPCR analyses of knockdown efficiency of shRNAs targeting five selected THZ1-sensitive SE-associated genes. (D) Cell growth curve of U87 cells infected with shRNA expressing lentivirus as indicated. Green and purple asterisks indicate P-values of two shRNA groups compared with control (shScr-1 plus shScr-2), respectively. **P<0.01, ***P<0.001, Two-tailed Student’s t-test. Abbreviations: CHIP-seq, chromatin immunoprecipitation sequencing; GBM, glioblastoma multiforme; RT, real-time; SE, super enhancer.

References

    1. Ostrom QT, Gittleman H, Liao P, et al. CBTRUS Statistical Report: Primary brain and other central nervous system tumors diagnosed in the United States in 2010-2014. Neuro Oncol. 2017;19(suppl_5):v1–v88. - PMC - PubMed
    1. Polivka J, Jr, Polivka J, Holubec L, et al. Advances in experimental targeted therapy and immunotherapy for patients with glioblastoma multiforme. Anticancer Res. 2017;37(1):21–33. - PubMed
    1. Sengupta S, George RE. Super-enhancer-driven transcriptional dependencies in cancer. Trends Cancer. 2017;3(4):269–281. - PMC - PubMed
    1. Turcan S, Rohle D, Goenka A, et al. IDH1 mutation is sufficient to establish the glioma hypermethylator phenotype. Nature. 2012;483(7390):479–483. - PMC - PubMed
    1. Dang L, White DW, Gross S, et al. Cancer-associated IDH1 mutations produce 2-hydroxyglutarate. Nature. 2010;465(7300):966. - PMC - PubMed