. 2018 Nov 30;29(1):1549922.
doi: 10.1080/16512235.2018.1549922. eCollection 2018.

Selection of fast and slow growing bacteria from fecal microbiota using continuous culture with changing dilution rate

Affiliations

Selection of fast and slow growing bacteria from fecal microbiota using continuous culture with changing dilution rate

K Adamberg et al. Microb Ecol Health Dis. .

Abstract

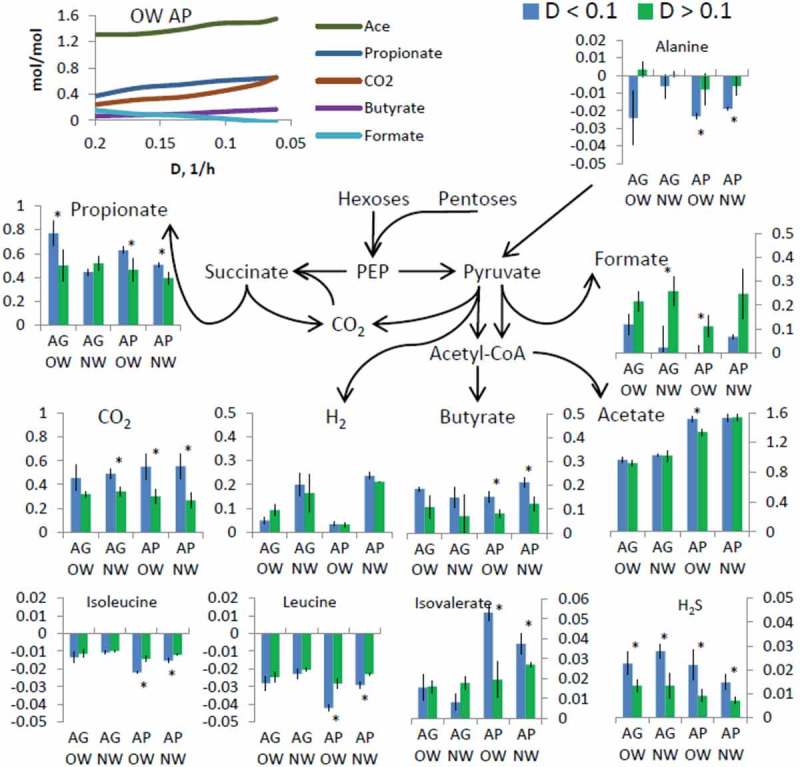
Background: Nutrient and energy metabolism in human colon depends on bacterial growth rate that is determined by the colonic transit rate. Objective: A novel approach, De-stat culture was used to distinguish the fast and slow growing sub-populations from fecal microbiota. Design: The enrichment and metabolism of bacteria from pooled fecal cultures of children was studied at dilution rates D = 0.2-0.0 1/h in mucin-supplemented media containing either arabinogalactan or apple pectin. Results: The study revealed clear differentiation of the fecal microbiota at higher (above 0.1 1/h) and lower (below 0.1 1/h) dilution rates, along with metabolic changes. Similarity of the fast and slow growing bacteria was observed in two different fecal pools and on both substrates, suggesting the dilution rate as the main triggering parameter for selection of bacteria. At high dilution rates, the species Collinsella aerofaciens, Dorea longicatena, Escherichia coli, Lachnoclostridium torques, and different Bacteroides (B. caccae, B. fragilis, B. ovatus, B. thetaiotaomicron, B. vulgatus) were dominant in both media variants. At low dilution rates, Akkermansia muciniphila, Eisenbergiella tayi, Negativicoccus succinivorans, and a group of Ruminococcaceae became dominant in both media and in both fecal pools. This change in bacterial population accompanied by the increased production of propionic and butyric acids as well as higher consumption of alanine and branched chain amino acids at low dilution rates. Conclusions: The study suggests that specific growth rate has important effect on the dynamics of colon microbiota. Manipulation of the proportions of fast and slow growing gut bacteria through modulation of the transit rate could be a target in human nutrition studies. The De-stat study would enable to predict changes in microbiota composition associated with the decrease or increase of the colonic transit rate.

Keywords: Dietary fiber; apple pectin; arabinogalactan; colon; gut transit rate; mucin.


Figures

Figure 1.
Figure 1.
Experimental scheme of the De-stat cultivations. The pooled fecal inoculum was added into fermenter at time 0 h followed by batch phase (ca 10 h) until beginning of exponential growth. Then continuous mode was started and after the stabilization of the fecal culture at D = 0.2 1/h (6–7 residential times), the dilution rate was gradually decreased down to 0.06 1/h (deceleration rate 0.05 1/h per day) followed by re-stabilization for approximately 2 residential times. The same procedure was applied for two substrate combinations (arabinogalactan + mucin, apple pectin + mucin) and for two inocula: the pooled fecal samples of the overweight and normal weight children. Dset indicates the dynamics of the pre-set dilution rate.
Figure 2.
Figure 2.
Composition of fecal microbiota in pooled inocula of the overweight (OW) and normal weight (NW) children, and during the De-stat cultivation on arabinogalactan and apple pectin in mucin-supplemented medium on three taxonomic levels. Values at the x-axes designate the dilution rates of the sampling points. Only taxa having average abundance more than 1% are shown in the graphs.
Figure 3.
Figure 3.
Production of organic acids and gases and consumption of amino acids per carbohydrates consumed (molar yields, all sub-figures have x-axis unit mol/mol) in De-stat cultures with pooled fecal inocula of children. On the top left figure, the metabolic products during the decrease of dilution rate from 0.2 to 0.06 1/h, are shown in experiment of OW fecal pool and AP mucin medium as an example. In the other plots average values of productions or consumptions at high (>0.1 1/h) or low (<0.1 1/h) dilution rates are shown for all experiments. Metabolic scheme illustrates overall picture without cross-feeding possibilities between different bacteria. OW – pooled fecal samples of the overweight children, NW – pooled fecal samples of the normal weight children, AG – arabinogalactan, AP – apple pectin, ace – acetic acid, but – butyric acid, for – formic acid, ibut – isobutyric acid, lact – lactic acid, prop – propionic acid, succ – succinic acid, val – valeric acid. Mucin was present in all growth media. The blue bars depict the interval of the dilution rate from 0.06 to 0.1 1/h, and the green bars – dilution rate D from 0 0.1 to 0.2 1/h. Asterisks indicate p-value on single parametric t-test of molar yields between high and low dilution rates. Production and consumption rates of all metabolites (mmol/g/L) are given in Supplementary Table S2.
Figure 4.
Figure 4.
The dynamics of fecal microbiota in De-stat cultures. In (A), an example of the distribution of relative abundances of the selected species under dilution rates D = 0.2–0.06 1/h, with the data of the fecal pool of the overweight children growing in medium containing apple pectin (AP) and mucin. (B) Responses of the specific growth rates of the species, presented in (A), to the changing dilution rate. The species classified as only fast-growing bacteria, did not follow the pre-set decrease of the dilution rate (below the D line) and were washed out from the fermenter.
Figure 5.
Figure 5.
Based on the differences in specific growth rates shown in Figure 4, the species are divided in two groups: (1) the species growing only at high dilution rates and washed out at low dilution rate (indicated in pink) and (2) the species able to follow the pre-set dilution rate (indicated in dark blue). The color intensity indicates how many times in average the specific growth rate of a species differs from the pre-set dilution rate. OW and NW indicate the fecal pools from the overweight or normal weight children; AG and AP – arabinogalactan and apple pectin, respectively. Color code of the species list designates the phyla: blue – Actinobacteria, green – Bacteroidetes, orange – Firmicutes, violet – Proteobacteria, brown – Verrucomicrobia. The species are sorted based on phylum and then based on relative difference of specific growth rate and pre-set dilution rate (only the fast-growing species first). Only statistically different changes are shown. Specific growth rates are calculated from the amount of a species detected under corresponding dilution rate using formula (1)–(3).

References

    1. Arora T, Bäckhed F.. The gut microbiota and metabolic disease: current understanding and future perspectives. J Intern Med. 2016;1–11 DOI:10.1111/joim.12508. - DOI - PubMed
    1. Venema K, Carmo A.. Probiotics and prebiotics: current status and future trends In: Venema K, Carmo AP, editors. Probiotics and prebiotics: current research and future trends. Caister Academic Press; 2015. p. 3–12. DOI:10.21775/9781910190098.01. - DOI
    1. Stephen AM, Wiggins HS, Cummings JH. Effect of changing transit time on colonic microbial metabolism in man. Gut. 1987;28:601–609. - PMC - PubMed
    1. Roager HM, Hansen LBS, Bahl MI, et al. metabolism and mucosal turnover in the gut. Nat Microbiol. 2016;1–9. DOI:10.1038/nmicrobiol.2016.93 - DOI - PubMed
    1. Lewis JS, Heaton WK. Increasing butyrate concentration in the distal colon by accelerating intestinal transit. Gut. 1997;41:245–251. - PMC - PubMed

LinkOut - more resources