. 2018 Nov 23:9:1654.
doi: 10.3389/fpls.2018.01654. eCollection 2018.

Optimizing Sowing and Flooding Depth for Anaerobic Germination-Tolerant Genotypes to Enhance Crop Establishment, Early Growth, and Weed Management in Dry-Seeded Rice (Oryza sativa L.)

Affiliations

Optimizing Sowing and Flooding Depth for Anaerobic Germination-Tolerant Genotypes to Enhance Crop Establishment, Early Growth, and Weed Management in Dry-Seeded Rice (Oryza sativa L.)

Buddhika Sampath Chamara et al. Front Plant Sci. .

Abstract

Poor crop establishment, high weed infestation, and consequent yield loss are major concerns for dry-seeded rice (DSR). Flooding after seeding helps in managing weeds but reduces seed germination and crop stand. Anaerobic germination (AG)-tolerant rice genotypes could overcome these problems in DSR. Screenhouse experiments were established to evaluate the effect of seed sowing depth (SD) (0.5 cm, 1 cm, and 2 cm) and flooding depth (FD) (saturated, 2 cm, and 5 cm) on crop establishment, early growth, and weed competitiveness in DSR using AG-tolerant genotypes (Khao Hlan On, Ma-Zhan Red, IR64+AG1, and IR64). Echinochloa crus-galli, Ludwigia hyssopifolia, and Cyperus difformis were used in the weedy treatment. Rice plants reached maximum emergence 9-13 days later under flooding compared with saturated conditions. Crop emergence decreased by 12-22% at 0.5 and 1 cm SD and by 48-60% at 2 cm SD, when combined with 2 or 5 cm FD compared with saturated conditions. The 2 cm SD reduced seedling emergence by 23-42% in Khao Hlan On and Ma-Zhan Red, by 62-70% in IR64+AG1, and by 90-92% in IR64 under flooding. Initial growth in rice plant height was slow under flooding but increased progressively after the seedlings emerged from water and the final height was not affected by FD. Leaf area, total shoot biomass, tiller density, and leaf number per pot of rice were higher at 1 cm SD (P< 0.05), but decreased drastically at 2 cm SD under flooding. The emergence of E. crus-galli and L. hyssopifolia decreased by 53-65% and 89-95%, respectively, but increased by 49-68% in C. difformis under 2 and 5 cm FD, respectively, compared with saturated conditions. The shoot biomass of the weeds followed the same trend. Khao Hlan On showed the highest weed-competitive ability under all FD while the biomass of IR64+AG1 and IR64 decreased by 10-14% due to weed competition under 2 cm FD. The 1 cm SD showed better growth for all genotypes under different FD. The 2 cm FD is sufficient to have a significant control of problematic weed species. The tolerance of AG of rice genotypes should be further enhanced to increase their weed-competitive ability.

Keywords: AG tolerance; Cyperus difformis; Echinochloa crus-galli; Ludwigia hyssopifolia; direct seeding; weed competition.


Figures

FIGURE 1
FIGURE 1
Ambient and mean water temperature (°C) during the study period of (A) experiment 1 and (B) experiment 2 measured at 07:00 and 13:00 h.
FIGURE 2
FIGURE 2
Percentage seedling emergence (A) under different flooding depths irrespective of sowing depth and genotype, (B) at different sowing depths irrespective of flooding depth and genotype, (C) of four genotypes under different sowing and flooding depths at 35 DAS, and (D) under different sowing and flooding depths at 35 DAS irrespective of genotype. The lines in (A,B) represent three-parameter sigmoid model y = a/{1 + e(−(x-x0)/b)} fitted to percentage rice emergence; and the lines in (D) represent a three-parameter exponential decay model [y = y0 + ae(−bx)] fitted to percentage rice emergence. Vertical bars represent standard error of the mean. V1, Khao Hlan On; V2, Ma-Zhan Red; V3, IR64+AG1; V4, IR64; SAT, saturated; FD2cm, 2 cm flooding depth; FD5cm, 5 cm flooding depth; SD0.5, 0.5 cm sowing depth; SD1, 1 cm sowing depth; SD2, 2 cm sowing depth.
FIGURE 3
FIGURE 3
(A) Plant height of rice (average of four genotypes) from 7 to 42 DAS under different flooding depths irrespective of sowing depth and (B) plant height of different genotypes under different flooding depths irrespective of sowing depth at 42 DAS. Lines in (A) represent three-parameter sigmoid model y = a/{1 + e(−(x-x0)/b)} fitted to plant height. The vertical bars represent standard error of the mean. SAT, saturated; FD2cm, 2 cm flooding depth; FD5cm, 5 cm flooding depth.
FIGURE 4
FIGURE 4
Leaf area of (A) rice genotypes at different sowing and flooding depths and (B) of different genotypes at different flooding depths. Data are taken at 42 DAS. The lines in (A) represent a two-parameter exponential decay model [y = ae(−bx)] fitted to leaf area measurements of rice. The vertical bars represent standard error of the mean. SD0.5, 0.5 cm sowing depth; SD1, 1 cm sowing depth; SD2, 2 cm sowing depth.
FIGURE 5
FIGURE 5
Tiller density per pot at different sowing depths and under different flooding depths. Data are averages across genotypes collected at 42 DAS. The lines represent a two-parameter exponential decay model [y = ae(−bx)] fitted to tiller density. The vertical bars represent standard error of the mean. SD0.5, 0.5 cm sowing depth; SD1, 1 cm sowing depth; SD2, 2 cm sowing depth.
FIGURE 6
FIGURE 6
Total shoot biomass (TSBM) per pot at (A) 21 DAS and (B) 42 DAS under different flooding and sowing depths irrespective of genotype. The lines in (A,B) represent a two-parameter exponential decay model [y = ae(−bx)] fitted to rice TSBM. The vertical bars represent standard error of the mean. SD0.5, 0.5 cm sowing depth; SD1, 1 cm sowing depth; SD2, 2 cm sowing depth.
FIGURE 7
FIGURE 7
Leaf number per plant when grown (A) at different flooding depths and (B) under different sowing depths averaged across genotypes. The lines represent three-parameter sigmoid model y = a/{1 + e(−(x-x0)/b)} fitted to rice plant height. The vertical bars represent standard error of the mean. SAT, saturated; FD2cm, 2 cm flooding depth; FD5cm, 5 cm flooding depth; SD0.5, 0.5 cm sowing depth; SD1, 1 cm sowing depth; SD2, 2 cm sowing depth.
FIGURE 8
FIGURE 8
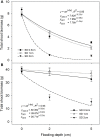
Weed emergence percentage under different flooding depths at 21 DAS. The lines represent a three-parameter exponential decay model [y = y0 + ae(−bx)] fitted to weed emergence %. The vertical bars represent standard error of the mean.
FIGURE 9
FIGURE 9
Aboveground weed biomass of E. crus-galli, L. hyssopifolia, and C. difformis at 42 DAS. The vertical bars represent standard error of the mean. SAT, saturated; FD2cm, 2 cm flooding depth; FD5cm, 5 cm flooding depth.
FIGURE 10
FIGURE 10
Genotypic variation in shoot biomass as affected by flooding and weed competition at 42 DAS. The vertical bars represent standard error of the mean. SAT, saturated; FD2cm, 2 cm flooding depth; FD5cm, 5 cm flooding depth; WD, weedy; WF, weed-free.
FIGURE 11
FIGURE 11
Genotypic variations in leaf area as affected by flooding and weed competition at 42 DAS. The vertical bars represent standard error of the mean. SAT, saturated; FD2cm, 2 cm flooding depth; FD5cm, 5 cm flooding depth; WD, weedy; WF, weed-free.

References

    1. Ampong-Nyarko K., De-Datta S. K. (1991). A Handbook for Weed Control in Rice. Manila: International Rice Research Institute.
    1. Angaji S. A., Septiningsih E. M., Mackill D. J., Ismail A. M. (2010). QTLs associated with tolerance of flooding during germination in rice (Oryza sativa L.). Euphytica 172 159–168. 10.3389/fpls.2013.00269 - DOI - PMC - PubMed
    1. Anwar M. P., Juraimi A. S., Puteh A., Man A., Rahman M. M. (2012). Efficacy, phytotoxicity and economics of different herbicides in aerobic rice. Acta Agric. Scand. Sect. B Soil Plant Sci. 62 604–615. 10.1080/09064710.2012.681060 - DOI
    1. Armstrong W., Drew M. C. (2002). “Root growth and metabolism under oxygen deficiency,” in Plant Roots, ed. Wasel Y. (New York, NY: The hidden half; ).
    1. Awika J. M. (2011). “Major cereal grains production and use around the world,” in Advances in Cereal Science: Implications to Food Processing and Health Promotion, eds Awika J., Piironen V., Bean S. (Washington, DC: ACS Symposium Series; ), 1–13. 10.1021/bk-2011-1089.ch001 - DOI

LinkOut - more resources