

Nearest Consensus Clustering Classification to Identify Subclasses and Predict Disease
- PMID: 30533598
- PMCID: PMC6245235
- DOI: 10.1007/s41666-018-0029-6
Nearest Consensus Clustering Classification to Identify Subclasses and Predict Disease
Abstract
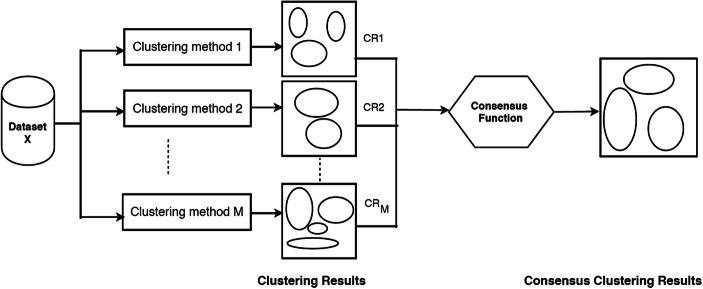
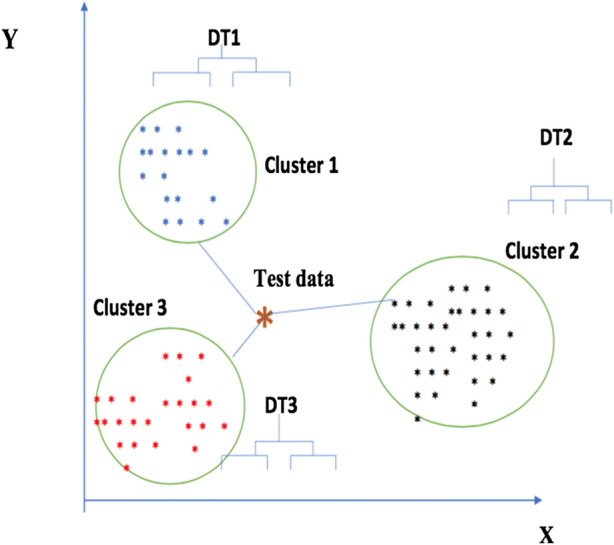
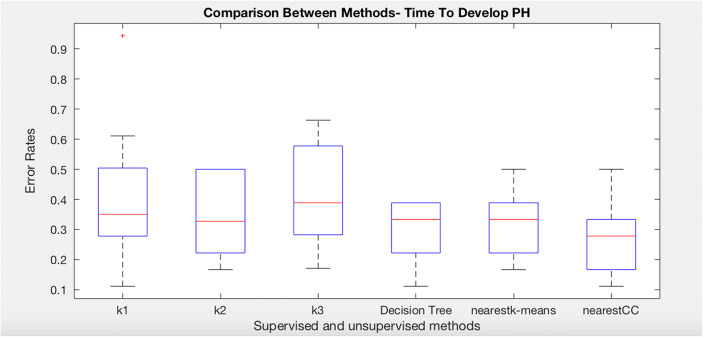
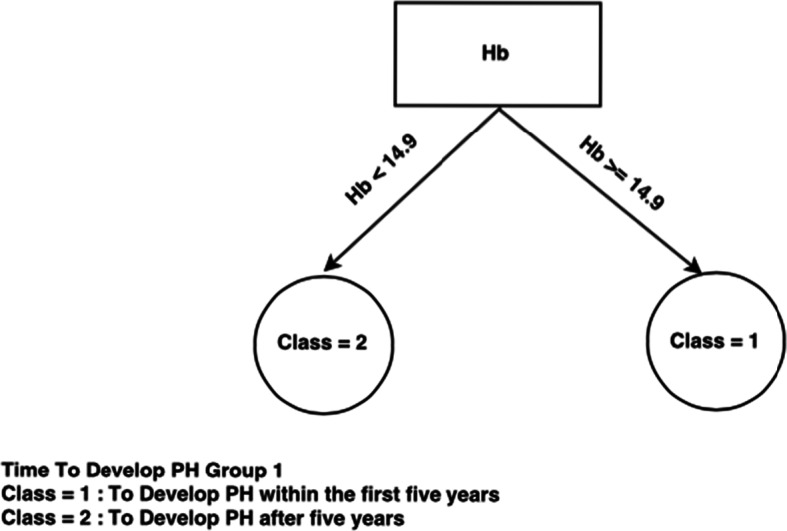
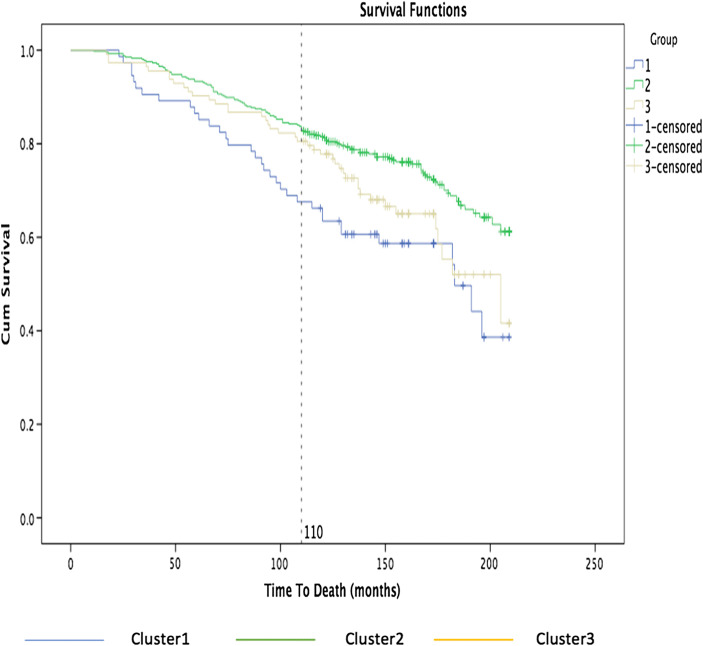
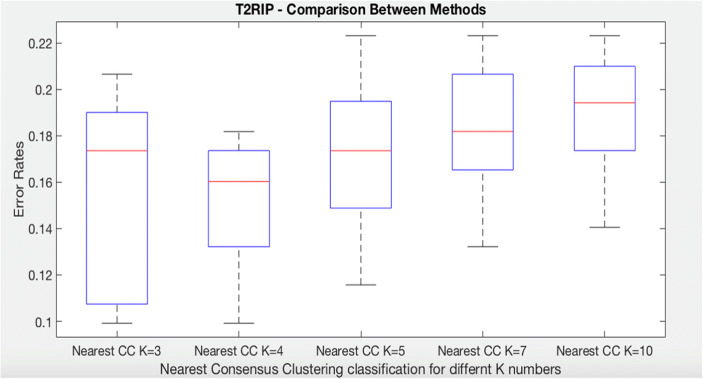
Disease subtyping, which helps to develop personalized treatments, remains a challenge in data analysis because of the many different ways to group patients based upon their data. However, if we can identify subclasses of disease, then it will help to develop better models that are more specific to individuals and should therefore improve prediction and understanding of the underlying characteristics of the disease in question. This paper proposes a new algorithm that integrates consensus clustering methods with classification in order to overcome issues with sample bias. The new algorithm combines K-means with consensus clustering in order build cohort-specific decision trees that improve classification as well as aid the understanding of the underlying differences of the discovered groups. The methods are tested on a real-world freely available breast cancer dataset and data from a London hospital on systemic sclerosis, a rare potentially fatal condition. Results show that "nearest consensus clustering classification" improves the accuracy and the prediction significantly when this algorithm has been compared with competitive similar methods.
Keywords: Classification; Consensus clustering; Disease subgroup discovery.
Figures

References
-
- Kellam P, Liu X, Martin N, Orengo C, Swift S, Tucker A (2004) Comparing, contrasting and combining in viral gene expression data
-
- Kalyani P. Approaches to partition medical data using clustering algorithms. Int J Comput Appl. 2012;49(N23):7–10.
-
- Zhu P, Zhu W, Hu Q, Zhang C, Zuo W. Subspace clustering guided unsupervised feature selection. Pattern Recogn. 2017;66:364–374. doi: 10.1016/j.patcog.2017.01.016. - DOI
-
- Tucker A, Garway D. The pseudotemporal bootstrap for predicting glaucoma from cross-sectional visual field data. IEEE. 2010;14:N1. - PubMed
LinkOut - more resources
Full Text Sources