. 2018 Nov 26:9:528.
doi: 10.3389/fgene.2018.00528. eCollection 2018.

Dissecting the Genomic Architecture of Resistance to Eimeria maxima Parasitism in the Chicken

Affiliations

Dissecting the Genomic Architecture of Resistance to Eimeria maxima Parasitism in the Chicken

Kay Boulton et al. Front Genet. .

Abstract

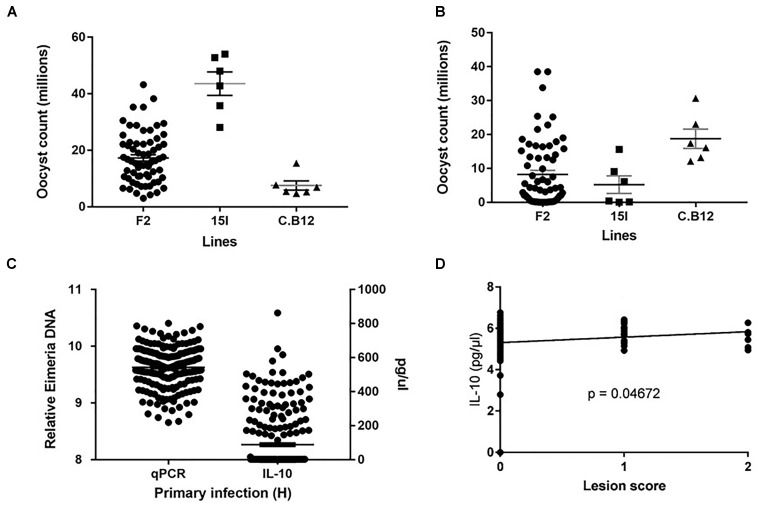
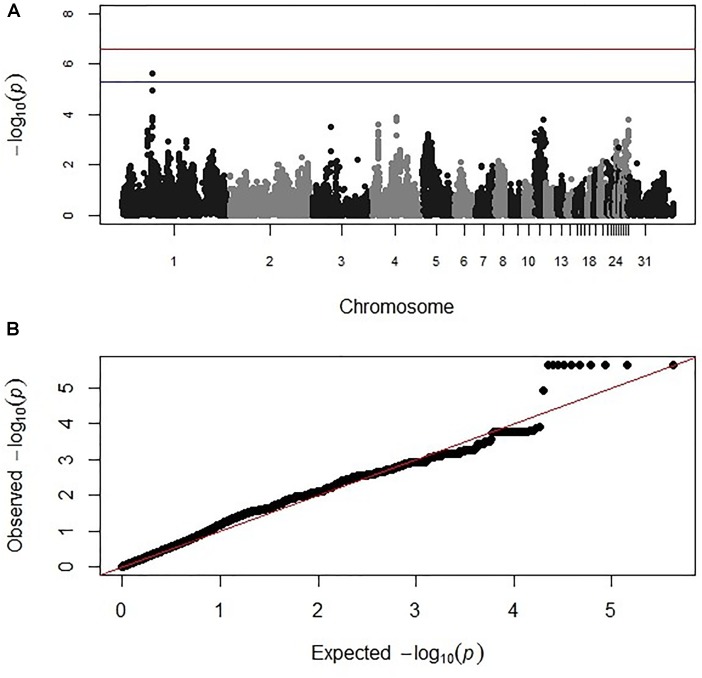
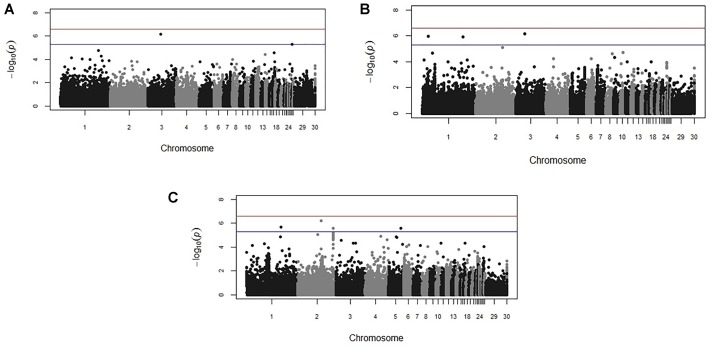
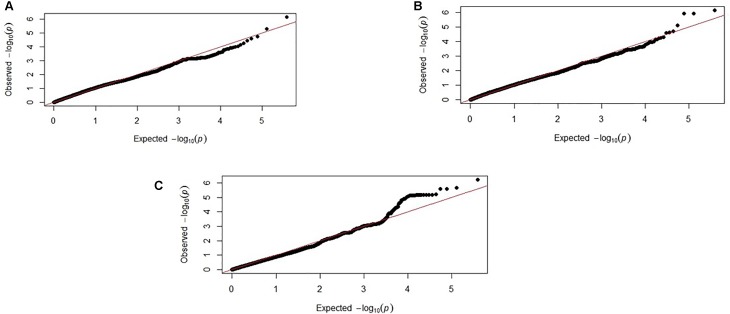
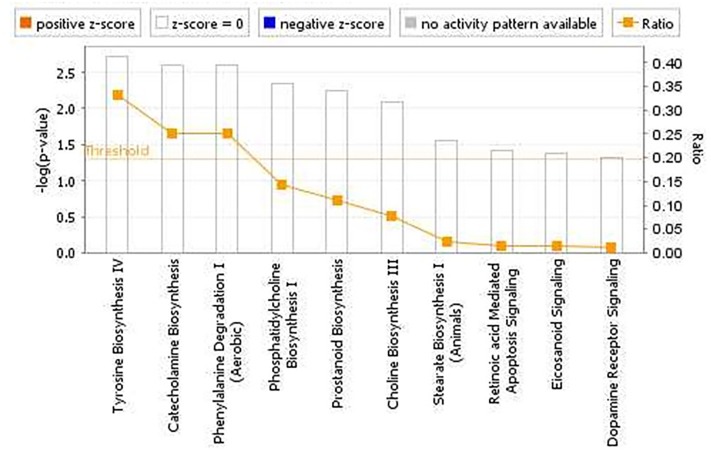
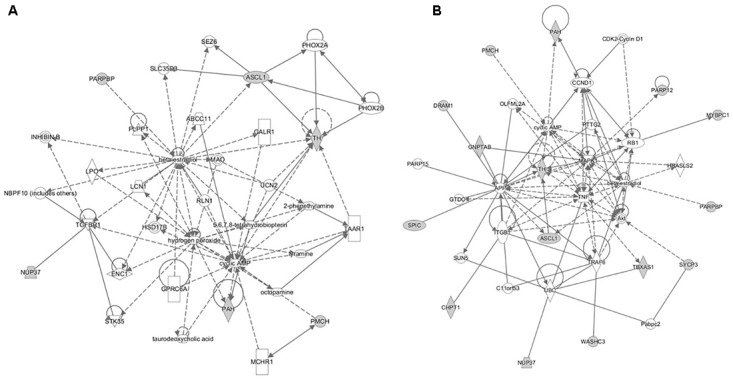
Coccidiosis in poultry, caused by protozoan parasites of the genus Eimeria, is an intestinal disease with substantial economic impact. With the use of anticoccidial drugs under public and political pressure, and the comparatively higher cost of live-attenuated vaccines, an attractive complementary strategy for control is to breed chickens with increased resistance to Eimeria parasitism. Prior infection with Eimeria maxima leads to complete immunity against challenge with homologous strains, but only partial resistance to challenge with antigenically diverse heterologous strains. We investigate the genetic architecture of avian resistance to E. maxima primary infection and heterologous strain secondary challenge using White Leghorn populations of derived inbred lines, C.B12 and 15I, known to differ in susceptibility to the parasite. An intercross population was infected with E. maxima Houghton (H) strain, followed 3 weeks later by E. maxima Weybridge (W) strain challenge, while a backcross population received a single E. maxima W infection. The phenotypes measured were parasite replication (counting fecal oocyst output or qPCR for parasite numbers in intestinal tissue), intestinal lesion score (gross pathology, scale 0-4), and for the backcross only, serum interleukin-10 (IL-10) levels. Birds were genotyped using a high density genome-wide DNA array (600K, Affymetrix). Genome-wide association study located associations on chromosomes 1, 2, 3, and 5 following primary infection in the backcross population, and a suggestive association on chromosome 1 following heterologous E. maxima W challenge in the intercross population. This mapped several megabases away from the quantitative trait locus (QTL) linked to the backcross primary W strain infection, suggesting different underlying mechanisms for the primary- and heterologous secondary- responses. Underlying pathways for those genes located in the respective QTL for resistance to primary infection and protection against heterologous challenge were related mainly to immune response, with IL-10 signaling in the backcross primary infection being the most significant. Additionally, the identified markers associated with IL-10 levels exhibited significant additive genetic variance. We suggest this is a phenotype of interest to the outcome of challenge, being scalable in live birds and negating the requirement for single-bird cages, fecal oocyst counts, or slaughter for sampling (qPCR).

Keywords: Eimeria maxima; QTL; backcross; intercross; interleukin-10; oocyst output; resistance.


Figures

FIGURE 1
FIGURE 1
Distribution of the intercross Eimeria maxima replication in (A) primary infection with Houghton and (B) secondary challenge with Weybridge heterologous strain for F2 and parental lines 14I and C.B12. (C) Backcross relative DNA and IL-10 distributions. (D) Backcross Lesion Score (LS) and (log10) IL-10 correlations, with significance value (P). For (A–C), black horizontal bars represent the distribution means and gray error bars the SE of the mean.
FIGURE 2
FIGURE 2
(A) Manhattan and (B) corresponding Q–Q plot for GWAS for oocyst output measured from the intercross chickens following heterologous secondary challenge. The –log10 P-value (on the y axis) indicating genome-wide significance is represented by the red line, while the blue line represents suggestive significance. The positions of the markers analyzed for the 28 main chicken autosomes (1–28) plus the sex chromosomes Z and W (29 and 30 respectively) and microchromosomes (31), are represented on the x axis. In (B), the expected chi-squared (χ2) values are plotted on the x axis, whereas the observed χ2 values are presented on the y axis, with the red line indicating the anticipated slope.
FIGURE 3
FIGURE 3
Manhattan plots from the backcross chicken response to E. maxima infection GWAS for the three measured traits: (A) parasite replication (PR), (B) LS, and (C) IL-10. The –log10 P-value (vertical axis) indicating genome-wide significance is represented by the red line, while the blue line represents genome-wide suggestive significance. The positions of the markers analyzed for the 28 main chicken autosomes (1–28) plus the sex chromosomes Z and W (29 and 30 respectively) and microchromosomes (31), are represented on the horizontal axes.
FIGURE 4
FIGURE 4
Corresponding Q–Q plots from the backcross chicken response to E. maxima infection GWAS of backcross chickens for the three measured traits: (A) PR, (B) LS, and (C) IL-10. The expected chi-squared (χ2) values are plotted on the x-axis. The observed χ2 values are presented on the y-axis, with the red line indicating the anticipated slope.
FIGURE 5
FIGURE 5
Canonical pathways determined from ingenuity pathway analysis (IPA) of the candidate markers identified in the backcross chicken GWAS for E. maxima resistance to primary challenge.
FIGURE 6
FIGURE 6
Molecular interaction networks constructed from the canonical pathways identified in the backcross infection response relate to (A) inflammatory response and disease and (B) cell death and survival, cellular compromise and cell cycle.
FIGURE 7
FIGURE 7
Canonical pathways determined from IPA of the candidate markers identified in the intercross chickens GWAS for E. maxima resistance to heterologous secondary challenge.
FIGURE 8
FIGURE 8
The gene networks subsequently constructed from the intercross heterologous secondary challenge relate to (A) cell signaling, nucleic acid metabolism and small molecule biochemistry and (B) cellular development, tissue development, and function.

References

    1. Aulchenko Y. S., Ripke S., Isaacs A., Van Duijn C. M. (2007). GenABEL: an R library for genome-wide association analysis. Bioinformatics 23 1294–1296. 10.1093/bioinformatics/btm108 - DOI - PubMed
    1. Bacciu N., Bed’hom B., Filangi O., Rome H., Gourichon D., Reperant J. M., et al. (2014). QTL detection for coccidiosis (Eimeria tenella) resistance in a fayoumi x leghorn F2 cross, using a medium-density SNP panel. Genet. Sel. Evol. 46:14. 10.1186/1297-9686-46-14 - DOI - PMC - PubMed
    1. Blake D. P., Billington K. J., Copestake S. L., Oakes R. D., Quail M. A., Wan K. L., et al. (2011). Genetic mapping identifies novel highly protective antigens for an apicomplexan parasite. PLoS Pathog. 7:e1001279. 10.1371/journal.ppat.1001279 - DOI - PMC - PubMed
    1. Blake D. P., Hesketh P., Archer A., Carroll F., Shirley M. W., Smith A. L. (2005). The influence of immunizing dose size and schedule on immunity to subsequent challenge with antigenically distinct strains of Eimeria maxima. Avian Pathol. 34 489–494. 10.1080/03079450500368292 - DOI - PubMed
    1. Blake D. P., Hesketh P., Archer A., Carroll F., Smith A. L., Shirley M. W. (2004). Parasite genetics and the immune host: recombination between antigenic types of Eimeria maxima as an entrée to the identification of protective antigens. Mol. Biochem. Parasitol. 138 143–152. 10.1016/j.molbiopara.2004.08.006 - DOI - PubMed

LinkOut - more resources