. 2018 Dec 5:7:100.
doi: 10.1038/s41377-018-0103-0. eCollection 2018.

Neuronal photoactivation through second-harmonic near-infrared absorption by gold nanoparticles

Affiliations

Neuronal photoactivation through second-harmonic near-infrared absorption by gold nanoparticles

Wieteke D A M de Boer et al. Light Sci Appl. .

Abstract

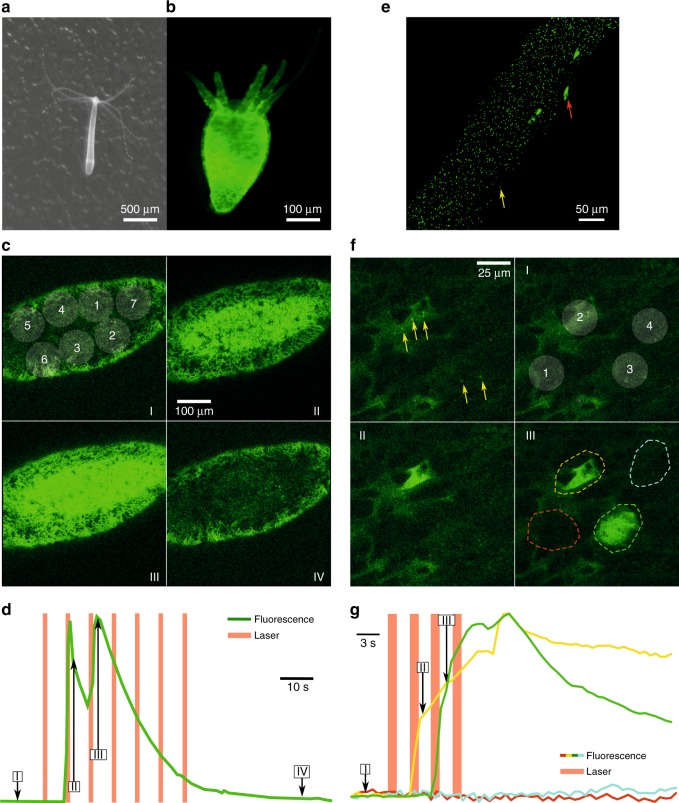
Optical activation of neurons requires genetic manipulation or the use of chemical photoactivators with undesirable side effects. As a solution to these disadvantages, here, we demonstrate optically evoked neuronal activity in mouse cortical neurons in acute slices and in vivo by nonlinear excitation of gold nanoparticles. In addition, we use this approach to stimulate individual epitheliomuscular cells and evoke body contractions in Hydra vulgaris. To achieve this, we use a low-power pulsed near-infrared excitation at the double-wavelength of the plasmon resonance of gold nanoparticles, which enables optical sectioning and allows for high spatial precision and large penetration depth. The effect is explained by second-harmonic Mie scattering, demonstrating light absorption by a second-order nonlinear process, which enables photothermal stimulation of the cells. Our approach also minimizes photodamage, demonstrating a major advancement towards precise and harmless photoactivation for neuroscience and human therapeutics.


Conflict of interest statement

The authors declare that they have no conflict of interest.

Figures

Fig. 1
Fig. 1. Experimental strategy and Au NP absorption spectrum.
a Bright-field microscope image of a patch-clamped layer 5 neuron, with the patch-clamp pipette (right) and the NP application pipette (left). Inset: schematic illustration of NPs tethered to the membrane through streptavidin-biotin binding. The biotin adheres to the membrane through conA (which binds to specific terminal sugar residues found in sugars, glycoproteins and glycolipids) or NHS (which binds to lysine-based membrane proteins). b Absorption spectrum of the NPs (~0.1 nM) in a spectral window of 300−800 nm, with an absorption feature centered at approximately 525 nm. The absorption peak is related to the surface plasmon resonance, which is a resonant oscillation of free electrons at the interface between a negative and positive permittivity material upon interaction with light
Fig. 2
Fig. 2. Nonlinear photoactivation of neurons with Au NPs in brain slices.
a Current clamp recording of a whole-cell patch-clamped layer 5 neuron from acute mouse cortical slices after application of conA and Au NPs. The recording shows a consistent response to 5 mW laser excitation of either a single or a few APs per stimulation. The red-shaded area depicts the time of the laser stimulation, and also applies to all following panels. b Recording in a slice incubated with the NHS-biotin linker. The first stimulation with 7 mW excitation power evokes an intense burst of APs. Lowering the power to 5 and 4 mW reduces the firing rate. c Schematic illustration of the excitation at the different focal planes. d Recordings performed with optical stimulations of 8 mW at different positions along the Z-axis with respect to the cell soma position (Z1 = 6 µm, Z2 = 3 µm, and Z3 = 0 µm). e Z-axis distance-dependent AP firing rate (n = 12, NHS-incubated cells). The error bars depict the standard error of the mean. f Control experiment without NPs. The responsiveness of the neuron was first confirmed by current injection (400 pA for 5 ms), after which the stimulation protocol was performed at three different Z-positions with respect to the cell soma (Z1, Z2, and Z3 same as in cd). No APs were evoked. g Using high excitation power (at 1040 nm) to evoke responses with direct NIR excitation (no Au NPs present). After the first intense AP burst (at Z2 with 110 mW), the power is adjusted. Repeating the excitation with 110 mW results in cell death. The responsiveness of the neuron is checked by injecting a current pulse (400 pA for 5 ms)
Fig. 3
Fig. 3. In vivo nonlinear photoactivation of cortical neurons with Au NPs.
a Schematic illustration of the conA (left) and Au NP (right) application procedure. b Image of an injection of con A-biotin complex (with Alexa 488, green); cell somata can be identified as shadow-like features. c Image of a loose-seal patch-clamp recording using a pipette filled with Alexa 594 (magenta) containing ACSF and a pipette with streptavidin-coated NP solution (with Alexa 488, green), applied in close vicinity of the neuron prior to the stimulation experiment. The shaded circle represents the spiral stimulation pattern. d Extracellular recording of a layer 2/3 neuron showing a repeated response of multiple APs (see color bar for AP firing rate) to optical stimulations. The lower panel shows a zoom-in for more details. The red-shaded area depicts the time of the laser stimulation, and also applies to the following panels. e Different example of a recording of a mouse layer 2/3 neuron. Here, the intrinsic firing rate of the cell drastically increases as a result of the optical excitation. f Control experiment in which the spiral stimulation of a neuron was performed in the absence of NPs, demonstrating that the pulsed NIR excitation alone does not evoke APs. Only one AP was coincidentally observed during laser stimulation due to intrinsic AP firing
Fig. 4
Fig. 4. Simultaneous Ca2+ imaging and Au NP photoactivation in Hydra
a Bright-field image of a Hydra specimen. b Fluorescent image of an Au NP-incubated Hydra expressing GCaMP6s in epitheliomuscular cells. c Example of systemic nonlinear excitation of a Hydra. Images of different frames in the synchronous fluorescence recording are shown (refer to d for the time scale). The white-shaded area depicts the stimulation patterns (20 mW on sample). The second and third stimulations evoked muscle activity. d The fluorescence signal (integrated over the entire image window) shows an intensity increase coinciding with the second and third stimulations. e Confocal microscope image of a Hydra incubated with Au NPs with a fluorescent tag (yellow arrow); larger green spots are epithelial cells (red arrow). f Single frames taken from a time-dependent fluorescence recording of epithelial cells of a transgenic GCaMP6s Hydra incubated with Au NPs with a fluorescent tag (DY488, green). The left upper panel shows the presence of NPs (yellow arrows) close to or on the cell membranes; cells can be distinguished as dark shadows haloed by green emission. The right upper panel (I) illustrates the excitation pattern used, with each circle representing a spiral excitation. The lower left panel (II) shows an image taken at the end of the second excitation. The last panel (III) corresponds to a frame directly after the third excitation. The colored dashed outlines indicate the area integrated to obtain the time-dependent fluorescence intensity, as shown in panel (g). Excitation power on the sample was 20 mW. g Fluorescence intensities of the areas corresponding to the second and third excitations (yellow and green, resp.) show an increase starting at the onset of the stimulation
Fig. 5
Fig. 5. Excitation power and temperature dependence.
a The absorbed energy per pulse as a function of the average power of the incident laser. The contribution of the linear absorption (black curve) and the SH nonlinear absorption (red curve) combined add up to the total absorption (green curve). b The temperature increase in the Au NP as a function of the average excitation power of the incident laser. The dotted line represents the minimum activation threshold as found in the experiments. c The temperature increase as a function of the distance from the NP surface (dotted line) for an average incident laser power of 4 mW (black line) and 7 mW (red line). The model assumes a homogeneous temperature distribution within the NP (shaded area). d Time-dependent temperature increase in a time window of 100 ns for an excitation power of 7 mW at the surface of the NP. Consecutive pulses (every 12.5 ns—laser repetition rate f = 80 MHz) at the same spot amount to an increase of ~0.5 °C

Similar articles

Cited by

References

    1. Gobin AM, et al. Near-infrared resonant nanoshells for combined optical imaging and photothermal cancer therapy. Nano Lett. 2007;7:1929–1934. doi: 10.1021/nl070610y. - DOI - PubMed
    1. Righini M, Zelenina AS, Girard C, Quidant R. Parallel and selective trapping in a patterned plasmonic landscape. Nat. Phys. 2007;3:477–480. doi: 10.1038/nphys624. - DOI
    1. Liu GL, Kim J, Lu Y, Lee LP. Optofluidic control using photothermal nanoparticles. Nat. Mater. 2005;5:27–32. doi: 10.1038/nmat1528. - DOI - PubMed
    1. Liu K, Xue X, Furlani EP. Theoretical comparison of optical properties of near-infrared colloidal plasmonic nanoparticles. Sci. Rep. 2016;6:34189. doi: 10.1038/srep34189. - DOI - PMC - PubMed
    1. Wang Z. Plasmon—resonant gold nanoparticles for cancer optical imaging. Sci. China Phys. Mech. Astron. 2013;56:506–513. doi: 10.1007/s11433-013-5006-8. - DOI