. 2018 Nov:12:225-235.
doi: 10.1016/j.jeoa.2017.04.001. Epub 2017 Apr 10.

The Impact of Social Pensions on Intergenerational Relationships: Comparative Evidence from China

Affiliations

The Impact of Social Pensions on Intergenerational Relationships: Comparative Evidence from China

Xi Chen et al. J Econ Ageing. 2018 Nov.

Abstract

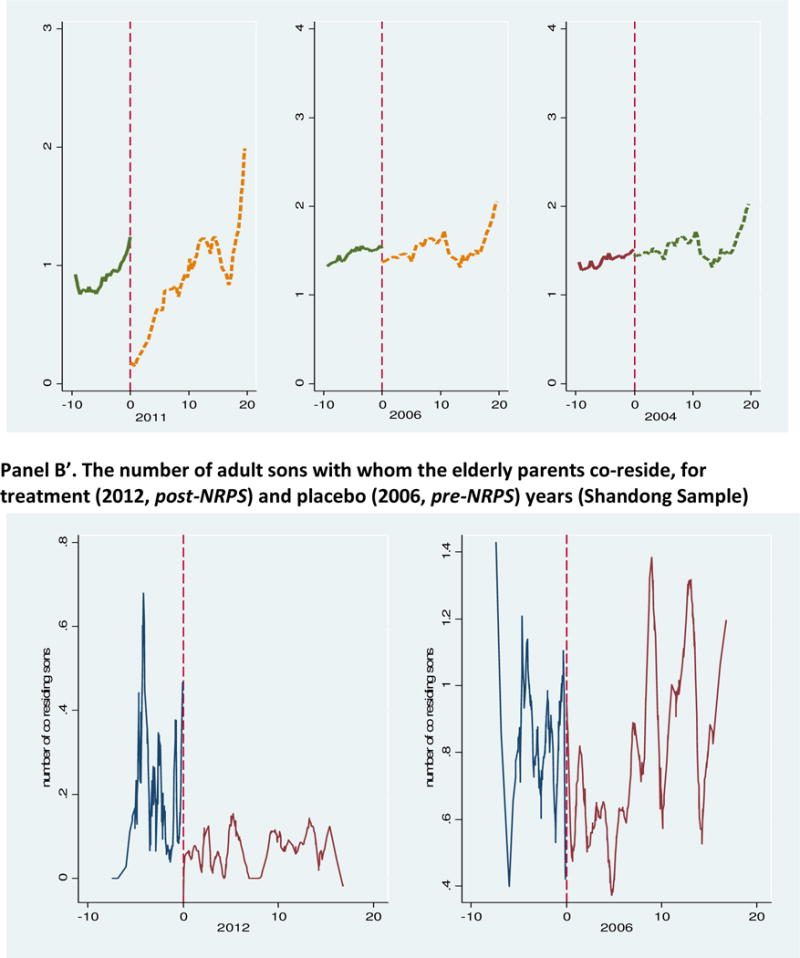
China launched a new rural pension scheme (hereafter NRPS) for rural residents in 2009, now covering almost all counties with over 400 million people enrolled. This implementation of the largest social pension program in the world offers a unique setting for studying the economics of intergenerational relationships during development, given the rapidity of China's population aging, traditions of filial piety and co-residence, decreasing number of children, and dearth of formal social security, at a relatively low income level. We draw on rich household surveys from two provinces at distinct development stages - impoverished Guizhou and relatively well-off Shandong - to better understand heterogeneity in the impact of pension benefits. Employing a fuzzy regression discontinuity design, we find that around the pension eligibility age cut-off, the NRPS significantly reduces intergenerational co-residence, especially between elderly parents and their adults sons; promotes pensioners' healthcare service consumption; and weakens (but does not supplant) non-pecuniary and pecuniary transfers across three generations. These effects are much larger in less developed Guizhou province.

Keywords: H55; I18; J14; R28; Social pensions; co-residence; intergenerational relationships; old-age care; regional comparisons; service consumption; transfers.


Figures

Figure A1
Figure A1. Statistics on the Rural Pension System in China (2002–2014)
Source: China Labor Statistical Yearbooks (2004–2015), Statistical Bulletin on the Social Development of Human Resources and Social Security (2002–2015). Notes: The NRPS initiated at the end of 2009. The non-zero figures before 2009 represent the old unsubsidized social pension that covered a tiny proportion of rural residents, mainly in developed regions in China.
Figure A2
Figure A2. Testing Continuity of the Density of Normalized Age (Guizhou Sample)
Note: This figure for the Guizhou sample results from the implementation of McCrary (2008)’s test for continuity of the density of the normalized age at the cutoff age 60. The same figure for the Shandong sample were presented as Figure A1 in ESZ. The tests do not reject the null of continuity, and t-statistic equals .934 (for the Guizhou sample) and −1.42 (for the Shandong sample). The density of the normalized age is estimated by all elderly in years 2011 (Guizhou) and 2012 (Shandong), when the pension policy was implemented.
Figure A3
Figure A3. Testing Continuity of the Predetermined Respondents’ Characteristics at the Cutoff Age (Guizhou Sample)
Source: The second wave (2006) Guizhou survey. Notes: This figure for the Guizhou sample shows main baseline demographic and socioeconomic characteristics of parents and normalized age of them. All these characteristics are dummy variables, indicating whether a parent is from the main ethnic group, holds a village leader position or communist party membership, finishes nine-year mandatory education, gets married, has religious beliefs, respectively. To save space, figures for other covariates, i.e., different types of family assets, controlled in the analysis are available upon request. General notes from Figure 2 apply. The figure for the Shandong sample were presented as Figure A2 in ESZ.
Figure 1
Figure 1. Pension receipt according to normalized age (Guizhou Sample)
Source: The fourth wave (2011) Guizhou survey. Notes: This figure shows the relationship between pension take-up rate and respondents’ normalized age. Age is normalized based on the day, month, and year information from date of birth. General graphing notes: 0=eligibility threshold at age 60. The lines are nonlinear fit using rectangular weights on either side using the micro data. The dots represent averages of bins centered at .5 year bins (approximately 180 days). Graphs with different window and bin widths are available upon request.
Figure 2
Figure 2. Living arrangements between adult sons and elderly parent
Panel A. The proportion of adult sons co-residing with an elderly parent, for treatment (2011, post-NRPS) and placebo (2004 and 2006, pre-NRPS) years (Guizhou Sample) Panel A′. The proportion of adult sons co-residing with an elderly parent, for treatment (2012, post-NRPS) and placebo (2006, pre-NRPS) years (Shandong Sample) Panel B. The number of adult sons with whom elderly parents co-reside, for treatment (2011, post-NRPS) and placebo (2004 and 2006, pre-NRPS) years (Guizhou Sample) Panel B′. The number of adult sons with whom the elderly parents co-reside, for treatment (2012, post-NRPS) and placebo (2006, pre-NRPS) years (Shandong Sample) Source: Three waves Guizhou survey (2004, 2006, 2011) and two waves Shandong survey (2006) (2012). Notes: These figures show relationships between rates of adult sons and number of adult sons co-residing with elderly parents and normalized age of the parents respectively for Guizhou and Shandong. We compare the likelihood and the number of adult sons with whom parents co-reside around age 60 in 2011 & 2012 to that in 2004 & 2006 around age 60 in 2011 (Guizhou) and in 2012 (Shandong).

References

    1. Ardington C, Case A, Hosegood V. Labor Supply Responses to Large Social Transfers: Longitudinal Evidence from South Africa. American Economic Journal: Applied Economics. 2009;1(1):22–48. - PMC - PubMed
    1. Cai F, et al., editors. The elderly and old-age support in rural China: challenges and prospects. Washington, DC: World Bank; 2012.
    1. Card David, Carlos Dobkin, Nicole Maestas. Does Medicare Save Lives? The Quarterly Journal of Economics. 2009;124(2):597–636. - PMC - PubMed
    1. Case A. Does Money Protect Health Status? Evidence from South African Pensions, Chapter 7 in NBER book. In: Wise David A., editor. Perspectives on the Economics of Aging. 2004. pp. 287–312.
    1. Case A, Deaton A. Large cash transfers to the elderly in South Africa. Economic Journal. 1998;108(450):1330–61.

LinkOut - more resources