. 2018 Dec 5:1:214.
doi: 10.1038/s42003-018-0219-z. eCollection 2018.

RELACS nuclei barcoding enables high-throughput ChIP-seq

Affiliations

RELACS nuclei barcoding enables high-throughput ChIP-seq

Laura Arrigoni et al. Commun Biol. .

Abstract

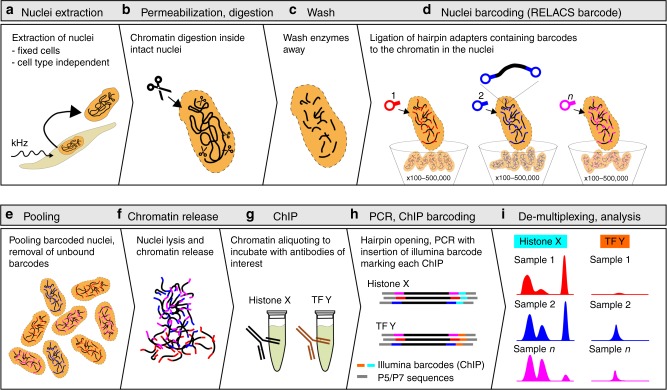
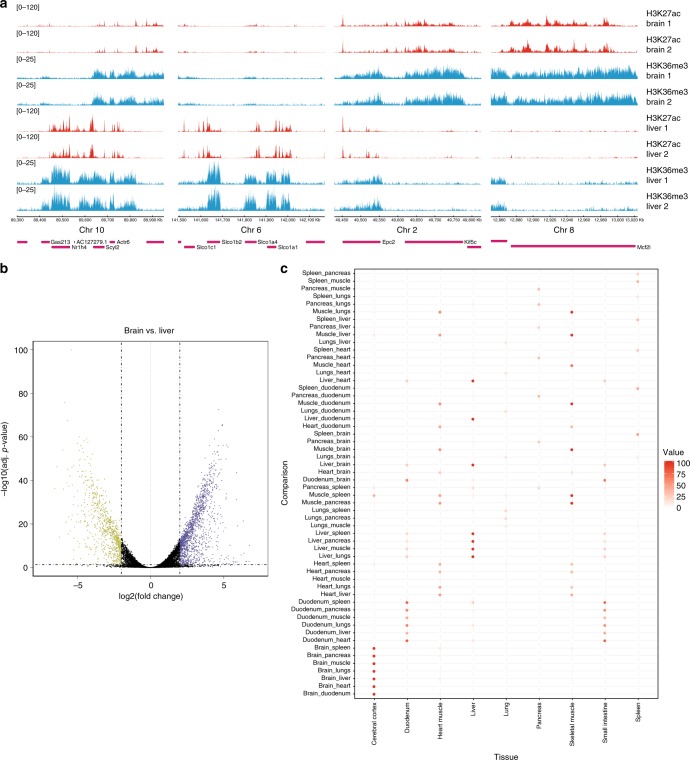
Chromatin immunoprecipitation followed by deep sequencing (ChIP-seq) is an invaluable tool for mapping chromatin-associated proteins. Current barcoding strategies aim to improve assay throughput and scalability but intense sample handling and lack of standardization over cell types, cell numbers and epitopes hinder wide-spread use in the field. Here, we present a barcoding method to enable high-throughput ChIP-seq using common molecular biology techniques. The method, called RELACS (restriction enzyme-based labeling of chromatin in situ) relies on standardized nuclei extraction from any source and employs chromatin cutting and barcoding within intact nuclei. Barcoded nuclei are pooled and processed within the same ChIP reaction, for maximal comparability and workload reduction. The innovative barcoding concept is particularly user-friendly and suitable for implementation to standardized large-scale clinical studies and scarce samples. Aiming to maximize universality and scalability, RELACS can generate ChIP-seq libraries for transcription factors and histone modifications from hundreds of samples within three days.


Conflict of interest statement

The authors declare no competing interests.

Figures

Fig. 1
Fig. 1
RELACS workflow. Overview of the RELACS method. The protocol facilitates barcoding multiple cell populations, which can be pooled and investigated for multiple epitopes within the same run. The method starts by isolating nuclei from a pool of formaldehyde-fixed cells, using sonication to reduce cell type dependency (a). The nuclear membrane is permeabilized to allow entrance of enzymes, followed by DNA barcodes. Restriction endonucleases with a high frequency of recognition sites are used to fragment chromatin—in this work CviKI-1 was used (b). Nuclei are washed to remove active restriction enzymes (c). Hairpin adapters harboring barcodes are ligated to both the ends of the fragmented chromatin inside the nuclei. The barcoding has been tested using 100–500,000 nuclei without the need to change protocol conditions (d). Cell populations marked with specific barcodes are pooled (e), concentrated and lysed using SDS at low concentration and short sonication to release chromatin into solution (f). Chromatin is split and incubated with the antibodies of interest (g). After ChIP washes and DNA purification (not illustrated), only DNA that harbors nuclei barcodes at both ends is PCR amplified to complete library construction. PCR amplification appends an Illumina barcode onto mark each fragment (h). Sequenced libraries are demultiplexed by Illumina barcode, to retrieve ChIP information, and then nuclear barcode, to identify the initial cell population (i). The RELACS protocol is very fast and ChIP-seq libraries can be generated for hundreds of samples within three days
Fig. 2
Fig. 2
RELACS validation. Using the HepG2 cell line as a model system, we compare results from RELACS with those from traditional ChIP-seq methods. a Data tracks for 6 histone marks (H3K4me1, H3K27ac, H3K4me3, H3K36me3, H3K27me3, H3K9me3), transcription factor (CTCF), a co-factor (p300) and Input are shown. Marks prepared with RELACS, designated with an R, and a traditional method are designated with letter T. External reference tracks from the ENCODE project are denoted by letter E. For RELACS each track show the merged data from 20 × 5000 cells; for traditional protocol each ChIP track corresponds to 100,000 cells, while ENCODE used cell numbers ranging from 1 to 20 million cells. One percent of the chromatin was used to prepare Input samples. b Aggregated signal of RELACS and traditional ChIP are shown over peaks from ENCODE (see online methods). For sharp marks, we centered the profile around the annotated peak center and added 3 kb to either side. For broad marks, we scaled the regions to 50 kb and added a flanking region of 50 kb. c Pearson correlation of log2-ratios (ChIP/Input) for RELACS (R) and Traditional (T) samples. The correlation was computed for 10 kb bins. d Heatmap shows the the signal distributions around 16,092 CTCF peaks from RELACS data and various other references (RELACS: merged signal from 20 × 5000 cells, Traditional: 1 × 100,000 cells); ENCODE data (ENCFF000BED, ENCFF000BEI, ENCFF000RUI, ENCFF000RUJ: > 10 million cells). Additional heatmaps of other marks are shown in Supplementary Fig. 7
Fig. 3
Fig. 3
RELACS sensitivity using low cell numbers. Comparison of RELACS results using 10,000, 1000 and 100 HepG2 cells as starting material. For each cell number, 7 technical replicates were barcoded and pooled for ChIP-seq and computationally demultiplexed before analysis. This figure shows two selected replicates from two individual barcodes for each cell number. The top heatmap (a) shows the 1×-normalized read coverage for the H3K4me3 histone mark at its respective ENCODE peaks. The coverage is shown centered at the peak with 4 kb flanks on each side. Similarly, for CTCF (b) the normalized coverage at the peak center shown together with 2 kb flanking regions. For H3K27me3 (c) normalized coverage at each ENCODE peak is scaled to 50 kb (S: start position; E: end position) and flanking 50 kb are shown
Fig. 4
Fig. 4
Analysis of multiple tissues and biological replicates in a single ChIP. a Schematic representation of the high-throughput RELACS ChIP-seq experiment. Eight mouse organs (brain, heart, lungs, liver, duodenum, pancreas, spleen, skeletal muscle) were extracted from two wild-type mice. Organs were independently homogenized, fixed, and nuclei were extracted. After chromatin digestion inside intact nuclei, different hairpin nuclear barcodes were used to mark nuclei extracted from each organ. After barcoding nuclei were pooled and lysed to release chromatin. Chromatin was split to investigate three histone modifications (H3K27ac, H3K36me3, H3K27me3) plus input for normalization control. Spleen icon is licensed under the Creative Commons Attribution 4.0 International license (Author: DataBase Center for Life Science (DBCLS), Source: http://togotv.dbcls.jp/ja/togopic.2014.20.htmL). Mouse icon is licensed under Creative Commons Attribution-Share Alike 4.0 International license (Author: Gwilz, Source: self-published work). b Tracks of three different histone marks (H3H27ac, H3K36me3, H3K27me3) with 8 different mouse tissues derived from two biological replicates are shown. To generate each track 25,000 cells have been used. c Principal component analysis illustrates a clear and consistent separation of tissues for all three histone marks where more than 60% of variation is explained (VarExp in the figure) by the first two components. Cases where only one replicate is visible indicate perfect overlap within the limits of resolution
Fig. 5
Fig. 5
Differential analysis of histone marks in mouse tissues. a For 4 selected loci we show examples of differential histone marks between replicated samples from mouse brain and liver samples. Red tracks denote H3K27ac signal and green tracks are for the elongation mark H3K36me3. b The volcano plot illustrates the outcome of DESeq analysis of H3K36me3 read counts over annotated genes and identifies 3877 (2323) genes with increased (decreased) binding in brain vs. liver. An enrichment analysis of those gene sets reveals a highly significant enrichment in the respective tissue (p-value < 10–100). c Generalizing this enrichment analysis to gene sets from all pairwise comparisons (y-axis) we find the strongest enrichments always in the expected tissue. For visualization purposes, we have color-coded the enrichment score, −log10(p-value), and set a threshold of 100. Higher scores (lower p-values) are mapped to 100

References

    1. Dahl JA, Gilfillan GD. How low can you go? Pushing the limits of low-input ChIP-seq. Brief. Funct. Genom. 2018;17:89–95. doi: 10.1093/bfgp/elx037. - DOI - PubMed
    1. Lara-Astiaso D., Weiner A., Lorenzo-Vivas E., Zaretsky I., Jaitin D. A., David E., Keren-Shaul H., Mildner A., Winter D., Jung S., Friedman N., Amit I. Chromatin state dynamics during blood formation. Science. 2014;345(6199):943–949. doi: 10.1126/science.1256271. - DOI - PMC - PubMed
    1. van Galen P, et al. A Multiplexed system for quantitative comparisons of chromatin landscapes. Mol. Cell. 2016;61:170–180. doi: 10.1016/j.molcel.2015.11.003. - DOI - PMC - PubMed
    1. Schmidl C, Rendeiro AF, Sheffield NC, Bock C. ChIPmentation: fast, robust, low-input ChIP-seq for histones and transcription factors. Nat. Methods. 2015;12:963–965. doi: 10.1038/nmeth.3542. - DOI - PMC - PubMed
    1. Arrigoni L, et al. Standardizing chromatin research: a simple and universal method for ChIP-seq. Nucleic Acids Res. 2016;44:e67. doi: 10.1093/nar/gkv1495. - DOI - PMC - PubMed