A Universal Probe Set for Targeted Sequencing of 353 Nuclear Genes from Any Flowering Plant Designed Using k-Medoids Clustering
- PMID: 30535394
- PMCID: PMC6568016
- DOI: 10.1093/sysbio/syy086
A Universal Probe Set for Targeted Sequencing of 353 Nuclear Genes from Any Flowering Plant Designed Using k-Medoids Clustering
Abstract
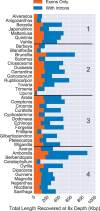
Sequencing of target-enriched libraries is an efficient and cost-effective method for obtaining DNA sequence data from hundreds of nuclear loci for phylogeny reconstruction. Much of the cost of developing targeted sequencing approaches is associated with the generation of preliminary data needed for the identification of orthologous loci for probe design. In plants, identifying orthologous loci has proven difficult due to a large number of whole-genome duplication events, especially in the angiosperms (flowering plants). We used multiple sequence alignments from over 600 angiosperms for 353 putatively single-copy protein-coding genes identified by the One Thousand Plant Transcriptomes Initiative to design a set of targeted sequencing probes for phylogenetic studies of any angiosperm group. To maximize the phylogenetic potential of the probes, while minimizing the cost of production, we introduce a k-medoids clustering approach to identify the minimum number of sequences necessary to represent each coding sequence in the final probe set. Using this method, 5-15 representative sequences were selected per orthologous locus, representing the sequence diversity of angiosperms more efficiently than if probes were designed using available sequenced genomes alone. To test our approximately 80,000 probes, we hybridized libraries from 42 species spanning all higher-order groups of angiosperms, with a focus on taxa not present in the sequence alignments used to design the probes. Out of a possible 353 coding sequences, we recovered an average of 283 per species and at least 100 in all species. Differences among taxa in sequence recovery could not be explained by relatedness to the representative taxa selected for probe design, suggesting that there is no phylogenetic bias in the probe set. Our probe set, which targeted 260 kbp of coding sequence, achieved a median recovery of 137 kbp per taxon in coding regions, a maximum recovery of 250 kbp, and an additional median of 212 kbp per taxon in flanking non-coding regions across all species. These results suggest that the Angiosperms353 probe set described here is effective for any group of flowering plants and would be useful for phylogenetic studies from the species level to higher-order groups, including the entire angiosperm clade itself.
Keywords: Angiosperms; Hyb-Seq; k-means clustering; k-medoids clustering; machine learning; nuclear genes; phylogenomics; sequence capture; target enrichment.
© The Author(s) 2018. Published by Oxford University Press on behalf of the Society of Systematic Biologists.
Figures


References
-
- Alvarez I., Wendel J.F.. 2003. Ribosomal ITS sequences and plant phylogenetic inference. Mol. Phylogenet. Evol. 29:417–434. - PubMed
-
- Amborella Genome Project, Ma H., Palmer J.D., Sankoff D., Soltis P.S., Wing R.A., Ammiraju J.S.S., Chamala S., Ralph P., Rounsley S., Soltis D.E., Talag J., Tomsho L., Wanke S., Chanderbali A.S., Chang T.H., Lan T., Arikit S., Axtell M.J., Ayyampalayam S., Barbazuk W.B., Burnette J.M., dePamphilis C.W., Estill J.C., Farrell N.P., Harkess A., Jiao Y., Meyers B.C., Walts B., Wessler S.R., Zhang X., Albert V.A., Carretero-Paulet L., Lyons E., Tang H., Zheng C., Leebens-Mack J., Liu K., Mei W., Wafula E., Altman N.S., Chen F., Chen J.Q., Chiang V., De Paoli E., Determann R., Fogliani B., Guo C., Harholt J., Job C., Job D., Kim S., Kong H., Li G., Li L., Liu J., Park J., Qi X., Rajjou L., Burtet-Sarramegna V., Sederoff R., Shahid S., Sun Y.H., Ulvskov P., Villegente M., Xue J.Y., Yeh T.F., Yu X., Zhai J., Acosta J.J., Bruenn R.A., de Kochko A., Der J.P., Herrera-Estrella L.R., Ibarra-Laclette E., Kirst M., Pissis S.P., Poncet V., Schuster S.C.. 2013. The Amborella genome and the evolution of flowering plants. Science. 342:1241089. - PubMed
-
- Bankevich A., Nurk S., Antipov D., Gurevich A.A., Dvorkin M., Kulikov A.S., Lesin V.M., Nikolenko S.I., Pham S., Prjibelski A.D., Pyshkin A.V., Sirotkin A.V., Vyahhi N., Tesler G., Alekseyev M.A., Pevzner P.A.. 2012. SPAdes: a new genome assembly algorithm and its applications to single-cell sequencing. J. Comput. Biol. 19:455–477. - PMC - PubMed

