. 2019 Jun 15;144(12):3146-3159.
doi: 10.1002/ijc.32058. Epub 2019 Jan 9.

Preclinical evaluation of the first intravenous small molecule MDM2 antagonist alone and in combination with temozolomide in neuroblastoma

Affiliations

Preclinical evaluation of the first intravenous small molecule MDM2 antagonist alone and in combination with temozolomide in neuroblastoma

Lindi Chen et al. Int J Cancer. .

Abstract

High-risk neuroblastoma, a predominantly TP53 wild-type (wt) tumour, is incurable in >50% patients supporting the use of MDM2 antagonists as novel therapeutics. Idasanutlin (RG7388) shows in vitro synergy with chemotherapies used to treat neuroblastoma. This is the first study to evaluate the in vivo efficacy of the intravenous idasanutlin prodrug, RO6839921 (RG7775), both alone and in combination with temozolomide in TP53 wt orthotopic neuroblastoma models. Detection of active idasanutlin using liquid chromatography-mass spectrometry and p53 pathway activation by ELISA assays and Western analysis showed peak plasma levels 1 h post-treatment with maximal p53 pathway activation 3-6 h post-treatment. RO6839921 and temozolomide, alone or in combination in mice implanted with TP53 wt SHSY5Y-Luc and NB1691-Luc cells showed that combined RO6839921 and temozolomide led to greater tumour growth inhibition and increase in survival compared to vehicle control. Overall, RO6839921 had a favourable pharmacokinetic profile consistent with intermittent dosing and was well tolerated alone and in combination. These preclinical studies support the further development of idasanutlin in combination with temozolomide in neuroblastoma in early phase clinical trials.

Keywords: MDM2 antagonists; RO6839921 (RG7775); idasanutlin (RG7388); neuroblastoma; temozolomide.


Conflict of interest statement

We disclose that L. Chen and D.A. Tweddle are part of an international collaborative research consortium with Hoffmann‐La Roche Ltd. Newcastle University, Cancer Research Technology and Astex Pharmaceuticals Inc. are part of an alliance agreement since 2012 and D.R. Newell, D. A Tweddle and J. Lunec have received research support and funding from Astex Pharmaceuticals, Inc. All other authors declare no conflicts of interest.

Figures

Figure 1
Figure 1
The effect of idasanutlin alone and in combination with temozolomide in parental and luciferase transduced neuroblastoma cell lines. (a) 72 h GI50 concentrations of parental and luciferase‐tagged cell lines to idasanutlin and temozolomide. Values represent the mean of n = 3 ± SEM. * as previously reported in Ref. 10. Western analysis for activation of the p53 pathway in (b) SHSY5Y and SHSY5Y‐Luc cells, and (c) NB1691 and NB1691‐Luc cells treated for 24 h with 1× and 10× their respective idasanutlin GI50 concentrations. D, DMSO treated control cells. Primary antibodies: p53 1:1000 (DO7, Leica Biosystems Ltd), MYCN 1:500 (sc‐53,993, Santa Cruz Biotechnology Inc., Dallas, TX, USA), MDM2 1:200 (OP46, Merck), p21WAF1 1:200 (OP64, Merck), and GAPDH 1:500 (sc‐25,778, Santa Cruz Biotechnology Inc). Growth inhibition curves of (d) SHSY5Y‐Luc and (e) NB1691‐Luc exposed to idasanutlin and temozolomide alone and in combination at the indicated constant 1:1 ratios relative to their respective GI50 concentrations for 72 h. Data are shown as the average of at least 3 independent experiments and error bars represent SEM. CI values are shown for each constant ratio combination and also at ED50, ED75, and ED90. CI range: < 0.1 very strong synergism; 0.1–0.3 strong synergism; 0.3–0.7 synergism; 0.7–0.85 moderate synergism; 0.85–0.9 slight synergism; 0.9–1.1 nearly additive; 1.1–1.2 slight antagonism; 1.2–1.45 moderate antagonism; 1.45–3.3 antagonism; 3.3–10 strong antagonism; > 10 very strong antagonism. RG, idasanutlin; TMZ, temozolomide; RG + TMZ, idasanutlin and temozolomide.
Figure 2
Figure 2
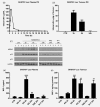
PK and PD analysis of RO6839921 in SHSY5Y‐Luc orthotopic tumour bearing mice. PK analysis of active idasanutlin levels using LC–MS in (a) plasma and (b) tumours harvested at the indicated time points from SHSY5Y‐Luc tumour bearing mice treated with a single dose of RO6839921 (equivalent to 100 mg/kg of active idasanutlin). PD profiling for (c) induction of the p53 pathway using Western analysis of p53, p21, and MDM2 levels in tumours, and MIC‐1 levels in (d) plasma and (e) tumours harvested at the indicated time points from SHSY5Y‐Luc tumour bearing mice after a single dose of RO6839921 (equivalent to 100 mg/kg of active idasanutlin), temozolomide (34 mg/kg) or RO6839921 and temozolomide. n = 3 mice per time point/group. CTR, control; RG, RO6839921; TMZ, temozolomide; R + T, RO6839921 and temozolomide. Primary antibodies: p53 1:1000 (#9282, Cell Signalling), MDM2 1:500 (sc‐813, Santa Cruz Biotechnology Inc), p21 1:1000 (#2947, Cell Signalling) and GAPDH 1:500 (sc‐25,778). Statistically significant differences were determined by one‐way analysis of variance (ANOVA) with Bonferroni post‐hoc tests and paired testing vs. control. p ≤ 0.05 (*); 0.01 (**); 0.001 (***); 0.0001 (****).
Figure 3
Figure 3
MIC‐1 levels and IHC analysis of Ki67, p53, p21, and cleaved caspase 3 (CC3) in orthotopic tumours in response to one cycle of RO6839921 and temozolomide alone and in combination. Plasma MIC‐1 levels in untreated and treated (a) SHSY5Y‐Luc and (b) NB1691‐Luc orthotopic tumour bearing mice taken 24 h after the last day of treatment. MIC‐1 levels were normalised to tumour weight, to account for variations in tumour size in response to treatment. Statistically significant differences vs. control were determined by unpaired t‐tests. (c) Representative images captured using the Aperio FL Digital Pathology Slide Scanner of Ki67 (Dako, Agilent, Stockport, UK), p53 (Bp53‐11, Ventana Medical Systems, Inc), p21 (OP64; Merck Millipore, Watford, UK), and CC3 (MAB835; R&D Systems, Abingdon, UK) stained 5 μm thick formalin‐fixed, paraffin embedded NB1691‐Luc tumour sections. Scale bar = 200 μm. Graphical representation of quantification of % positive Ki67, p53, p21, and CC3 staining in (d) NB1691‐Luc and (e) SHSY5Y‐Luc orthotopic tumours using Imagescope software and algorithms (Leica Biosystems, Newcastle upon Tyne, UK) and/or scored for positive immunostaining by a consultant pathologist (KW). n = 3 mice per group. All data are shown as the mean and error bars represent SEM. CTR, control; RG, RO6839921; TMZ, temozolomide; R + T, RO6839921 and temozolomide. Statistically significant differences were determined by one‐way ANOVA with Bonferroni post‐hoc tests and paired testing vs. control. p ≤ 0.05 (*); 0.01 (**); 0.001 (***); 0.0001 (****). [Color figure can be viewed at wileyonlinelibrary.com]
Figure 4
Figure 4
Efficacy of one cycle of RO6839921 alone and in combination with temozolomide in SHSY5Y‐Luc and NB1691‐Luc orthotopic tumour bearing mice. Graphical representation of bioluminescence emission of untreated (CTR) and treated (a) SHSY5Y‐Luc and (b) NB1691‐Luc orthotopic tumour bearing mice on Day 8 (BLI 1) and Day 15 (BLI 2) of treatment with RO6839921 alone (RG), temozolomide alone (TMZ) or RO6839921 and temozolomide in combination (R + T). n = 8 mice per group. Statistically significant differences vs. control were determined by unpaired t‐tests. Weight of tumours from untreated and treated (c) SHSY5Y‐Luc and (d) NB1691‐Luc orthotopic tumour bearing mice taken 24 h after the last day of treatment. n = 3 mice per group. All data points are shown as the mean and error bars represent SEM. Statistically significant differences vs. control were determined by unpaired t‐tests. Kaplan‐Meier plots and log‐rank (Mantel‐Cox) analysis of survival of control and treated (e) SHSY5Y‐Luc and (f) NB1691‐Luc orthotopic tumour bearing mice. n = 5 mice per group. CTR, control; RG, RO6839921; TMZ, temozolomide; R + T, RO6839921 and temozolomide. p ≤ 0.05 (*); 0.01 (**); 0.001 (***).
Figure 5
Figure 5
RNA‐Seq analysis of NB1691 cells treated with idasanutlin and temozolomide alone and in combination. (a) Graph showing the number of statistically significant and greater than two‐fold differentially expressed genes in response to idasanutlin and temozolomide alone and in combination for 24 h and 72 h. (b) Top 3 DAVID GO biological processes up‐ and downregulated in response to idasanutlin and temozolomide in combination for 24 h. (c) Enriched Hallmark gene sets identified using GSEA for genes up‐ and downregulated in NB1691 cells in response to idasanutlin for 24 h vs. DMSO. NES, Normalised Enrichment Score. Red arrows indicate gene sets common to all treatment conditions at 24 h. (d) Venn diagrams showing the overlap of gene sets enriched in the different treatment conditions at 24 h (top) and 72 h (bottom). (e) Enriched Hallmark gene sets identified using GSEA for genes up‐ and downregulated in NB1691 cells in response to idasanutlin and temozolomide in combination for 24 h. Red arrows indicate gene sets common to all treatment conditions at 24 h. GSEA gene set enrichment plots showing (f) positive enrichment of the p53 Pathway and negative enrichment of MYC Targets v1 and (g) positive enrichment of TNFA Signalling via NFKB and negative enrichment of E2F Targets in NB1691 cells treated with idasanutlin and temozolomide in combination for 72 h. (h) Graph showing the Log2 fold change in expression relative to DMSO control of selected p53 regulated genes of interest in NB1691 cells in response to idasanutlin and temozolomide alone and in combination for 24 h. Statistical significance was determined using unpaired t‐tests p ≤ 0.05 (*); 0.01 (**); 0.001 (***); 0.0001 (****); ns, not significant; RG, idasanutlin; TMZ, temozolomide; RG + TMZ, idasanutlin and temozolomide. [Color figure can be viewed at wileyonlinelibrary.com]

References

    1. Matthay KK, Maris JM, Schleiermacher G, et al. Neuroblastoma. Nat Rev Dis Primers 2016;2:16078. - PubMed
    1. Chen L, Tweddle DA. p53, SKP2, and DKK3 as MYCN target genes and their potential therapeutic significance. Front Oncol 2012;2:173. - PMC - PubMed
    1. Ding Q, Zhang Z, Liu JJ, et al. Discovery of RG7388, a potent and selective p53‐MDM2 inhibitor in clinical development. J Med Chem 2013;56:5979–83. - PubMed
    1. Higgins B, Tovar C, Glen K, et al. Abstract A156: preclinical activity of MDM2 antagonist RO6839921, a pegylated prodrug for intravenous administration. Mol Cancer Ther 2015;14:A156‐A.
    1. Higgins B, Glenn K, Walz A, et al. Preclinical optimization of MDM2 antagonist scheduling for cancer treatment by using a model‐based approach. Clin Cancer Res 2014;20:3742–52. - PubMed

Publication types

MeSH terms