. 2019 Mar;597(6):1565-1584.
doi: 10.1113/JP277140. Epub 2019 Jan 2.

Perilipin-2 promotes obesity and progressive fatty liver disease in mice through mechanistically distinct hepatocyte and extra-hepatocyte actions

Affiliations

Perilipin-2 promotes obesity and progressive fatty liver disease in mice through mechanistically distinct hepatocyte and extra-hepatocyte actions

David J Orlicky et al. J Physiol. 2019 Mar.

Abstract

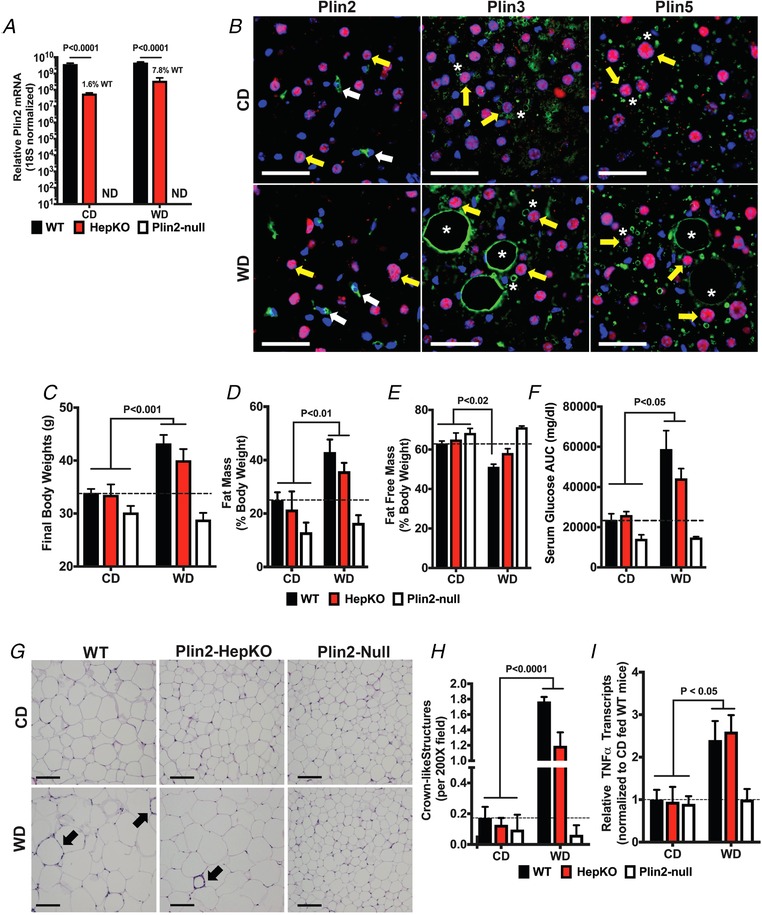
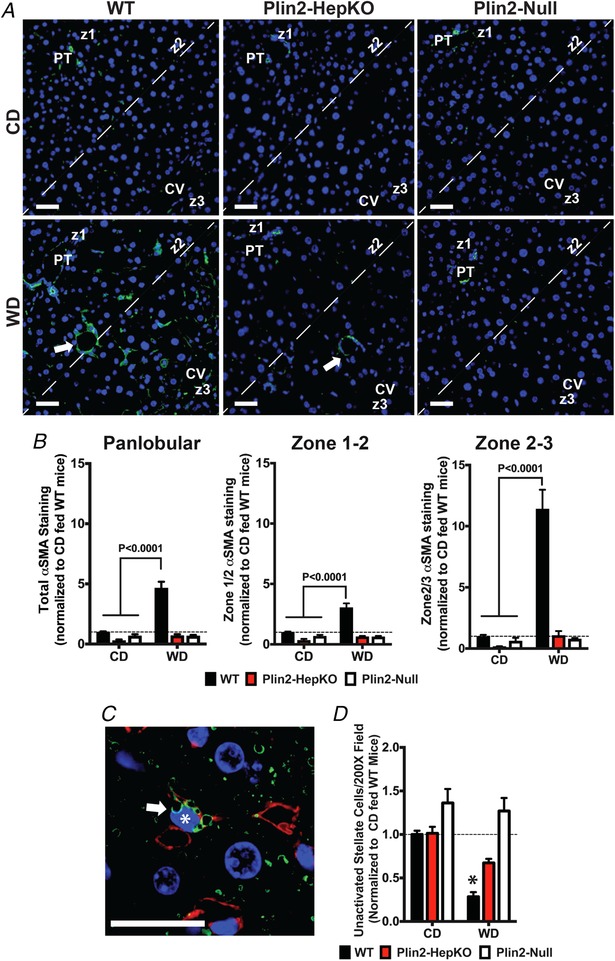
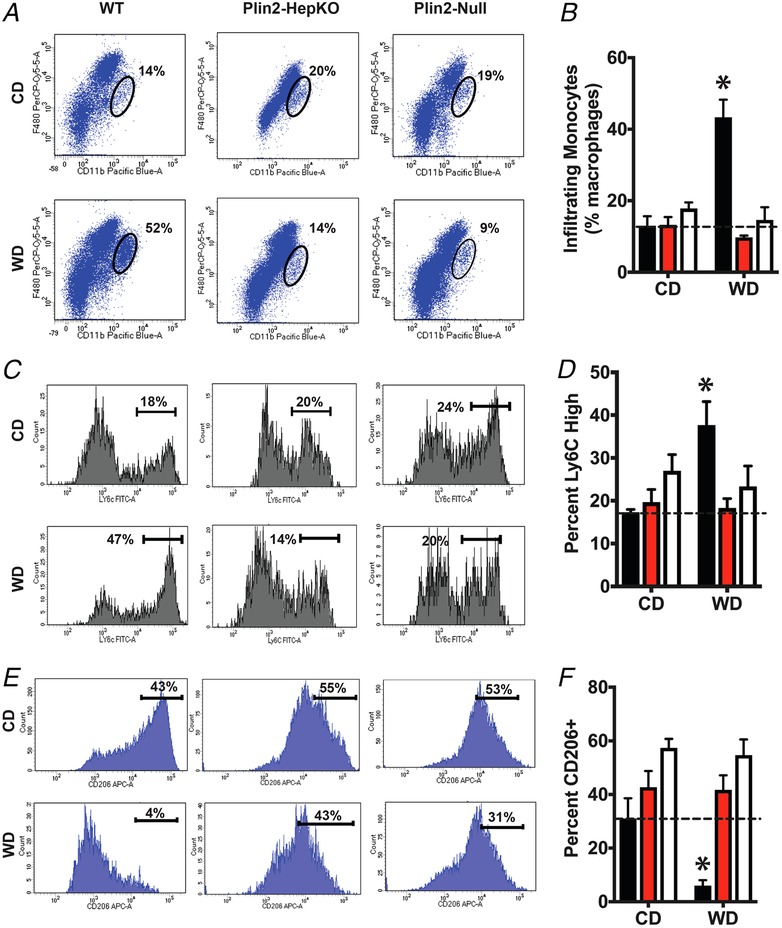
Key points: Wild-type mice and mice with hepatocyte-specific or whole-body deletions of perilipin-2 (Plin2) were used to define hepatocyte and extra-hepatocyte effects of altered cellular lipid storage on obesity and non-alcoholic fatty liver disease (NAFLD) pathophysiology in a Western-diet (WD) model of these disorders. Extra-hepatocyte actions of Plin2 are responsible for obesity, adipose inflammation and glucose clearance abnormalities in WD-fed mice. Hepatocyte and extra-hepatic actions of Plin2 mediate fatty liver formation in WD-fed mice through distinct mechanisms. Hepatocyte-specific actions of Plin2 are primary mediators of immune cell infiltration and fibrotic injury in livers of obese mice.

Abstract: Non-alcoholic fatty liver disease (NAFLD) is an obesity- and insulin resistance-related metabolic disorder with progressive pathology. Perilipin-2 (Plin2), a ubiquitously expressed cytoplasmic lipid droplet scaffolding protein, is hypothesized to contribute to NAFLD in humans and rodent models through effects on cellular lipid metabolism. In this study, we delineate hepatocyte-specific and extra-hepatocyte Plin2 mechanisms regulating the effects of obesity and insulin resistance on NAFLD pathophysiology in mice fed an obesogenic Western-style diet (WD). Total Plin2 deletion (Plin2-Null) fully protected WD-fed mice from obesity, insulin resistance, adipose inflammation, steatohepatitis (NASH) and liver fibrosis found in WT animals. Hepatocyte-specific Plin2 deletion (Plin2-HepKO) largely protected against NASH and fibrosis and partially protected against steatosis in WD-fed animals, but it did not protect against obesity, insulin resistance, or adipose inflammation. Significantly, total or hepatocyte-specific Plin2 deletion impaired WD-induced monocyte recruitment and pro-inflammatory macrophage polarization found in livers of WT mice. Analyses of the molecular and cellular processes mediating steatosis, inflammation and fibrosis identified differences in total and hepatocyte-specific actions of Plin2 on the mechanisms promoting NAFLD pathophysiology. Our results demonstrate that hepatocyte-specific actions of Plin2 are central to the initiation and pathological progression of NAFLD in obese and insulin-resistant mice through effects on immune cell recruitment and fibrogenesis. Conversely, extra-hepatocyte Plin2 actions promote NAFLD pathophysiology through effects on obesity, inflammation and insulin resistance. Our findings provide new insight into hepatocyte and extra-hepatocyte mechanisms underlying NAFLD development and progression.

Keywords: Fibrosis; Insulin Resistance; Nonalcoholic Steatohepatitis; Obesity; Perilipin-2.


Figures

Figure 1
Figure 1
Effects of WD feeding and Plin2 genotype on obesity, glucose clearance and adipose inflammation A, relative Plin2 mRNA levels in livers of WT, Plin2‐HepKO and Plin2‐Null mice fed CD or WD for 30 weeks. Values are 18S RNA normalized means ± SEM (N = 4 mice per group). Plin2 was below detection levels (ND) in livers of Plin2‐Null mice. Note use of log scale for the y‐axis. B, representative liver sections from Plin2‐HepKO mice fed CD or WD for 30 weeks and immunostained for Plin2, Plin3 or Plin5 (green) and hepatocyte nuclear factor‐4 as marker of hepatocyte nuclei (red). Nuclei were stained with DAPI (blue). Plin2 staining (left panels) was exclusively detected on small CLDs found in sinusoidally localized hepatic stellate cells (white arrows) in both CD‐ and WD‐fed mice. Plin3 (middle panels) and Plin5 (right panels) were detected on small and large macrovesicular CLDs (asterisks) in hepatocytes (yellow arrows) of CD‐ and WD‐fed mice. Scale bars, 50 μM. C–F, final body weights (C), fat mass (D) and fat free mass (E) values as percentages of body weight, and serum glucose area under the curve values (F) for WT, Plin2‐HepKO and Plin2‐Null mice fed CD or WD for 30 weeks. G, representative images of Hematoxylin and Eosin (H&E)‐stained epididymal adipose tissue (eWAT) sections from WT, Plin2‐HepKO or Plin2‐Null mice fed CD or WD for 30 weeks. Arrows indicate the crown‐like structures (CLS). Scale bars, 100 μm. Relative increases in CLS (H) and TNFα transcript (I) in eWAT of mice fed the WD for 30 weeks. For panels CF, and H and I, values are means ± SEM (N = 3–6 mice per group). Values of WD‐fed mice that were statistically different from CD‐fed animals are indicated by brackets. The corresponding P values refer to the minimal statistical significance between the indicated WD‐ and CD‐fed mice. The dashed horizontal lines indicate values for CD‐fed WT mice.
Figure 2
Figure 2
Effects of WD feeding and Plin2 genotype on fatty liver formation and NAFLD pathology A, liver weights as percentage of body weight are presented relative to values of CD‐fed WT mice for animals fed CD or WD for 30 weeks. Values are means ± SEM (N = 3–6 mice per group). Bracket indicates values of WD‐fed mice that were statistically different from those of CD‐fed animals. The corresponding P value refers to the minimal statistical significance between the indicated WD‐ and CD‐fed mice. The asterisk indicates significant difference from WD‐fed WT mice (P < 0.01). The dashed horizontal line indicates values for CD‐fed WT mice. B, representative images of H&E‐stained liver sections of WT, Plin2‐HepKO and Plin2‐Null mice fed the WD or CD for 30 weeks. Green and yellow arrows in images from WD fed mice indicate hepatocytes with microvesicular and macrovesicular steatosis, respectively. PT, portal triad; CV, central vein. Scale bar, 50 μm. CF, effects of 30 weeks of CD or WD feeding on relative hepatic levels of (C) neutral lipids (NL), (D) cholesteryl esters (CE), (E) diacylglycerol (DAG) and (F) ceramide (Cer) in WT, Plin2‐HepKO and Plin2‐Null mice. Values are means ± SEM (N = 3–6 mice per group). Brackets indicate values of WD‐fed mice that were statistically different from those of CD‐fed animals. The corresponding P values in these panels refer to the minimal statistical significance between the indicated WD‐ and CD‐fed mice. The asterisk in C indicates significant difference from WD‐fed WT mice (P < 0.0001). The dashed lines indicate values for CD‐fed WT mice. NS, not significant. G and H, relative levels of mRNA for Srebp1c, Scd1, Fas, and Acc1 (G), and PPARγ and Cd36 (H) in liver extracts of WT, Plin2‐HepKO and Plin2‐Null mice fed CD or WD for 30 weeks. Values are means ± SEM (N = 3–6 mice per group). The indicated P values in these panels refer to the statistical significance between the indicated WD and CD‐fed mice. NS, not significant. I–L, histological images of H&E‐ and PAS (periodic acid‐Schiff)‐stained liver sections from 30 week WD‐fed WT mice showing histopathological features indicative of NAFLD to NASH progression: I, inflammatory cells (arrows); J and K, foamy macrophages (arrows); L, ballooned cells (arrows). M, average NAFLD injury scores derived from data in Table 3 for WT, Plin2‐HepKO, and Plin2‐Null (the bar for Plin2‐Null animals appears to be missing because their scores were zero) fed the WD for 30 weeks. Horizontal line indicates statistically significant effects of genotype on NAFLD injury scores by one‐way ANOVA.
Figure 3
Figure 3
Effects of WD feeding and Plin2 genotype on fibrotic processes A, representative liver sections from 30‐week CD‐ and WD‐fed WT, Plin2‐HepKO, and Plin2‐Null mice stained for collagen‐1 (green). Nuclei, DAPI stained (blue). White arrows in WD‐fed mice identify collagen‐1 staining around lipogranulomas. Yellow arrow in WD‐fed WT liver section identifies collagen‐1 staining of inflammatory foci. Asterisk indicates representative sinusoidal pattern of collagen‐1 staining. PT, portal triad; CV, central vein. Lobular zones (z1 and z3) are indicated. Dashed line indicates zone 2 region used for analysis of zonal distribution of immunostaining. Scale bars, 50 μm. B, a representative immunostained liver section from a 30 week WD‐fed WT mouse showing deposition of collagen‐1 fibres (green, white arrows) beneath the sinusoidal endothelial cell layer (S), around a lipogranuloma (LG), and throughout an inflammatory cell focus (yellow arrow). Alexafluor 594‐wheat germ agglutinin staining (red) identifies glycosylated endothelial luminal surfaces. DAPI‐stained nuclei, blue. Tan arrows, endothelial cell nuclei. CV, central vein. Scale bar, 25μm. C, relative panlobular, zone 1–2 and zone 2–3 specific Col1 immunostaining levels in 3–7 randomly selected liver sections per mouse from groups of 4–6 WT, Plin2‐HepKO and Plin2‐Null mice fed CD or WD for 30 weeks. Values are means ± SEM. Brackets in panels indicate values of WD‐fed mice that were statistically different from those of CD‐fed animals. NS, not significant. Dashed line in panels indicates values of CD‐fed WT mice. D and E, relative mRNA levels for Collagen‐1a (D) and Timp1 (E) in livers of WT, Plin2‐HepKO and Plin2‐Null mice fed CD or WD for 30 weeks. Values are means ± SEM (N = 3–6 mice per group). Brackets in panels D and E indicate values of WD‐fed mice that were statistically different from those of CD‐fed animals. Dashed line in panels indicates values of CD‐fed WT mice. F, representative images of liver sections of CD‐ and WD‐fed WT, Plin2‐HepKO and Plin2‐Null mice immunostained for collagen‐3 (green). DAPI‐stained nuclei, blue. PT, portal triad; CV, central vein; Scale bars, 50 μm. G, quantitation of collagen‐3 immunostaining in 3–6 randomly selected liver sections per mouse from 4–6 mice per group. NS, not significant.
Figure 4
Figure 4
Effects of WD feeding and Plin2 genotype on hepatic stellate cell activation A, representative liver sections from 30 week CD‐ and WD‐fed WT, Plin2‐HepKO, and Plin2‐Null mice stained for α‐smooth muscle actin (SMA) (green). DAPI‐stained nuclei, blue. White arrows in WD‐fed mice indicate SMA actin staining around lipogranulomas. PT, portal triad; CV, central vein. Lobular zones (z1 and z3) are indicated. Dashed line indicates zone 2 region used for analysis of zonal distribution of immunostaining. Scale bars, 50 μm. B, relative panlobular, zone 1–2 and zone 2–3 specific SMA immunostaining quantitation in livers of WT, Plin2‐HepKO and Plin2‐Null mice fed CD or WD for 30 weeks. Values are means ± SEM. Brackets in panels indicate values of WD‐fed mice that were statistically different from those of CD‐fed animals. Dashed line in panels indicates values of CD‐fed WT mice. C, representative image of a quiescent hepatic stellate cell (arrow) in a liver section from a CD‐fed WT mouse, containing clusters of Plin2‐stained CLD (green) adjacent to a heterochromatic nucleus (asterisk, blue) with a ‘scalloped‐out’ shape. Cy3‐labelled WGA staining (red) identifies glycosylated sinusoids. Scale bar = 25μm. D, relative number of quiescent HSC quantified by counting sinusoidal CLD‐containing cells displaying ‘scalloped‐out’ nuclei in 10–15 randomly selected liver sections per mouse from 4–6 mice per group. Values are means ± SEM. The asterisk in D indicates significant difference from CD‐fed mice (P < 0.001). Dashed line indicates values of CD‐fed WT mice.
Figure 5
Figure 5
Effects of WD feeding and Plin2 genotype on immune cell activation A, representative H&E‐ (left panel), PAS‐ (middle panel) and Cd45‐immunostained (green, right panel) liver sections showing the presence of Cd45‐positive monocytes (yellow arrows) around a lipogranuloma. Scale bar = 25 μm. B, relative panlobular, zone 1–2 and zone 2–3 specific Cd45 immunostaining levels in 10–15 randomly selected liver sections per mouse from 4–6 mice per group. Values are means ± SEM. Brackets in panels indicate values of WD‐fed mice that were statistically different from those of CD‐fed animals. Dashed line in panels indicates values of CD‐fed WT mice. NS, not significant. C, 3D confocal images of Cd3‐immunostained liver sections from 30 week CD‐ or WD‐fed WT mice showing Cd3‐positive T cells localized within a sinusoid (S) of CD‐fed mice (arrow), and at the lipogranuloma (LG) margin (arrow) in WD‐fed mice. Cy3‐WGA staining (red) identifies glycosylated sinusoidal and lipogranuloma surfaces. DAPI‐stained nuclei (blue). Scale bar = 25 μm. D, relative Cd3 immunostaining normalized to DAPI stained nuclei in 10–15 randomly selected liver sections per mouse from 4–6 mice per group of WT, Plin2‐HepKO and Plin2‐Null mice fed CD or WD for 30 weeks. Values are means ± SEM. Bracket indicates values of WD‐fed mice that were statistically different from those of CD‐fed animals. Dashed line in panels indicates values of CD‐fed WT mice. E–L, relative hepatic transcript levels of Tgfβ1 (E), TNFα (F), IL10 (G), IL33 (H), CCL2 (I), CCL5 (J), TLR4 (K), and TLR2 (L) in mice fed the CD or WD for 30 weeks. Values are means ± SEM (N = 3–6 mice per group). Brackets in panels EL indicate values of WD‐fed mice that were statistically different from those of CD‐fed animals. P values refer to the minimal statistical significance between the indicated WD‐ and CD‐fed mice. NS, not significant.
Figure 6
Figure 6
Inflammatory cell recruitment Flow cytometry analyses of hepatic immune cells in WT, Plin2‐HepKO and Plin2‐Null mice fed CD or WD for 6 weeks (N = 5 for each treatment group). A and B, representative flow cytometry profiles (A) and quantitation (B) of peripheral monocyte‐derived macrophages (F4/80‐intermediate and CD11b‐high) as a percentage of total macrophages in the Cd45+ fraction in livers of CD‐ and WD‐fed mice. Ovals in the representative flow profiles shown in A indicate gating settings used to identify monocyte derived macrophages. The corresponding quantities are shown next to each oval. C and D, representative flow cytometry profiles (C) and quantitation (D) of proinflammatory (Ly6c‐high) macrophages and quantitation of Ly6C+ cells are shown as a percentage of total Kupffer cells in CD‐ and WD‐fed mice. E and F, representative flow cytometry profiles (E) and quantitation of M2 polarized (CD206+) macrophages as a percentage of total infiltrating monocytes. Values are average percentages of total macrophages. Brackets in representative flow profiles shown in panels C and E indicate gating settings used to identify Ly6C high and CD206+ cell,s respectively. Their corresponding quantities are shown next to the respective bracket. Asterisks in B, D and F indicate values that were significantly different from CD‐fed mice.

Comment in

References

    1. Bertola A, Bonnafous S, Anty R, Patouraux S, Saint‐Paul MC, Iannelli A, Gugenheim J, Barr J, Mato JM, Le Marchand‐Brustel Y, Tran A & Gual P (2010). Hepatic expression patterns of inflammatory and immune response genes associated with obesity and NASH in morbidly obese patients. PLoS One 5, e13577. - PMC - PubMed
    1. Blaner WS, O'Byrne SM, Wongsiriroj N, Kluwe J, D'Ambrosio DM, Jiang H, Schwabe RF, Hillman EM, Piantedosi R & Libien J (2009). Hepatic stellate cell lipid droplets: a specialized lipid droplet for retinoid storage. Biochim Biophys Acta 1791, 467–473. - PMC - PubMed
    1. Brasaemle DL (2007). The perilipin family of structural lipid droplet proteins: Stabilization of lipid droplets and control of lipolysis. J Lipid Res 48, 2547–2549. - PubMed
    1. Braunersreuther V, Viviani GL, Mach F & Montecucco F (2012). Role of cytokines and chemokines in non‐alcoholic fatty liver disease. World J Gastroenterol 18, 727–735. - PMC - PubMed
    1. Brunt EM, Wong VW, Nobili V, Day CP, Sookoian S, Maher JJ, Bugianesi E, Serlin CB, Neuschwander‐Tetri BA & Rinella M (2015). Nonalcoholic fatty live disease. Nat Rev Dis Primers 1, 22. - PubMed

Publication types

MeSH terms