

Disparities in Breast Cancer Survival by Socioeconomic Status Despite Medicare and Medicaid Insurance
- PMID: 30537364
- PMCID: PMC6287075
- DOI: 10.1111/1468-0009.12355
Disparities in Breast Cancer Survival by Socioeconomic Status Despite Medicare and Medicaid Insurance
Abstract
Policy Points Patients with low socioeconomic status (SES) experience poorer survival rates after diagnosis of breast cancer, even when enrolled in Medicare and Medicaid. Most of the difference in survival is due to more advanced cancer on presentation and the general poor health of lower SES patients, while only a very small fraction of the SES disparity is due to differences in cancer treatment. Even when comparing only low- versus not-low-SES whites (without confounding by race) the survival disparity between disparate white SES populations is very large and is associated with lower use of preventive care, despite having insurance.
Context: Disparities in breast cancer survival by socioeconomic status (SES) exist despite the "safety net" programs Medicare and Medicaid. What is less clear is the extent to which SES disparities affect various racial and ethnic groups and whether causes differ across populations.
Methods: We conducted a tapered matching study comparing 1,890 low-SES (LSES) non-Hispanic white, 1,824 black, and 723 Hispanic white women to 60,307 not-low-SES (NLSES) non-Hispanic white women, all in Medicare and diagnosed with invasive breast cancer between 1992 and 2010 in 17 US Surveillance, Epidemiology, and End Results (SEER) regions. LSES Medicare patients were Medicaid dual-eligible and resided in neighborhoods with both high poverty and low education. NLSES Medicare patients had none of these factors.
Measurements: 5-year and median survival.
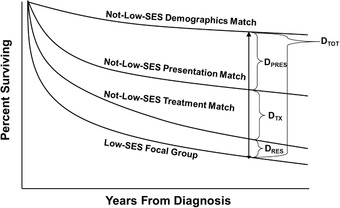
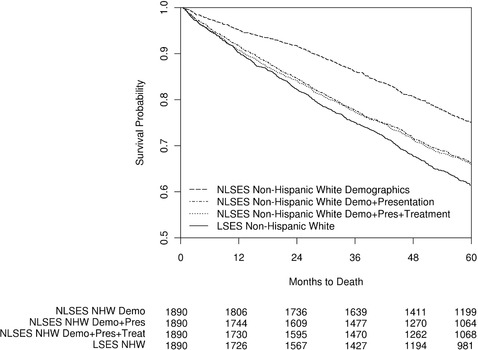
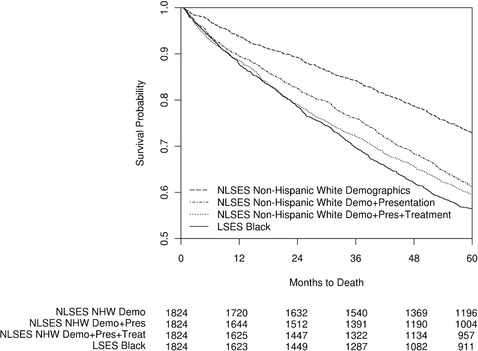
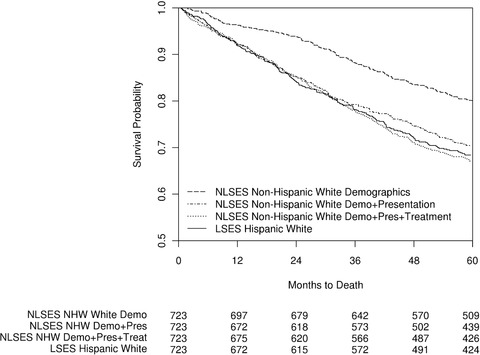
Findings: LSES non-Hispanic white patients were diagnosed with more stage IV disease (6.6% vs 3.6%; p < 0.0001), larger tumors (24.6 mm vs 20.2 mm; p < 0.0001), and more chronic diseases such as diabetes (37.8% vs 19.0%; p < 0.0001) than NLSES non-Hispanic white patients. Disparity in 5-year survival (NLSES - LSES) was 13.7% (p < 0.0001) when matched for age, year, and SEER site (a 42-month difference in median survival). Additionally, matching 55 presentation factors, including stage, reduced the disparity to 4.9% (p = 0.0012), but further matching on treatments yielded little further change in disparity: 4.6% (p = 0.0014). Survival disparities among LSES blacks and Hispanics, also versus NLSES whites, were significantly associated with presentation factors, though black patients also displayed disparities related to initial treatment. Before being diagnosed, all LSES populations used significantly less preventive care services than matched NLSES controls.
Conclusions: In Medicare, SES disparities in breast cancer survival were large (even among non-Hispanic whites) and predominantly related to differences of presentation characteristics at diagnosis rather than differences in treatment. Preventive care was less frequent in LSES patients, which may help explain disparities at presentation.
Keywords: Medicare; breast cancer; disparities; socioeconomic status.
© 2018 Milbank Memorial Fund.
Figures
References
-
- Bradley CJ, Given CW, Roberts C. Race, socioeconomic status, and breast cancer treatment and survival. J Natl Cancer Inst. 2002;94(7):490‐496. - PubMed
-
- Byers TE, Wolf HJ, Bauer KR, et al. The impact of socioeconomic status on survival after cancer in the United States: findings from the National Program of Cancer Registries Patterns of Care Study. Cancer. 2008;113(3):582‐591. - PubMed
-
- Pappas G, Queen S, Hadden W, Fisher G. The increasing disparity in mortality between socioeconomic groups in the United States, 1960 and 1986. N Engl J Med. 1993;329(2):103‐109. - PubMed
Publication types
MeSH terms
Grants and funding
LinkOut - more resources
Full Text Sources
Medical
