. 2018 Dec 10;34(6):922-938.e7.
doi: 10.1016/j.ccell.2018.11.005.

Resistance to Epigenetic-Targeted Therapy Engenders Tumor Cell Vulnerabilities Associated with Enhancer Remodeling

Affiliations

Resistance to Epigenetic-Targeted Therapy Engenders Tumor Cell Vulnerabilities Associated with Enhancer Remodeling

Amanda Balboni Iniguez et al. Cancer Cell. .

Abstract

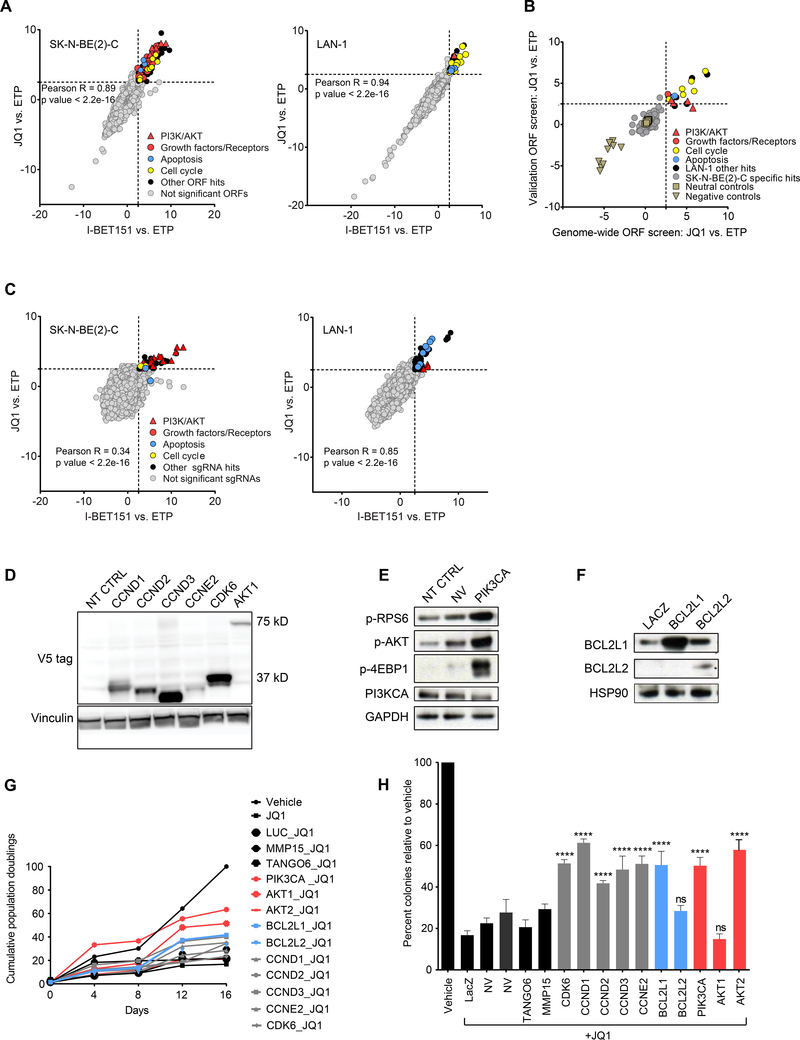
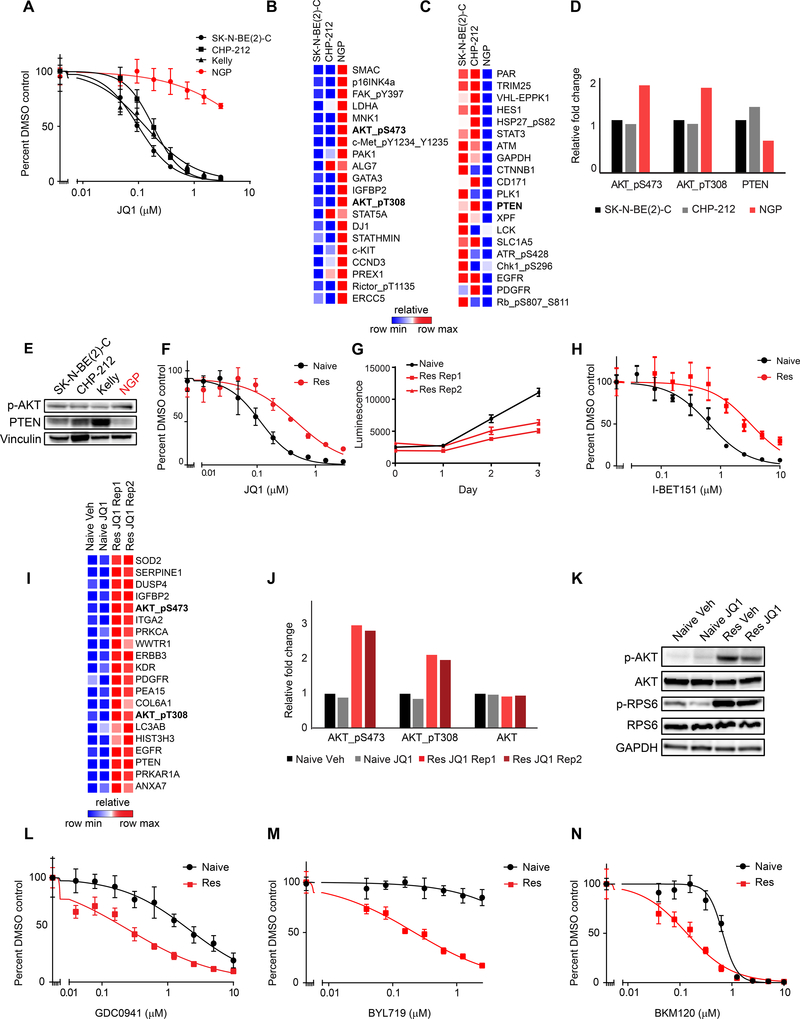
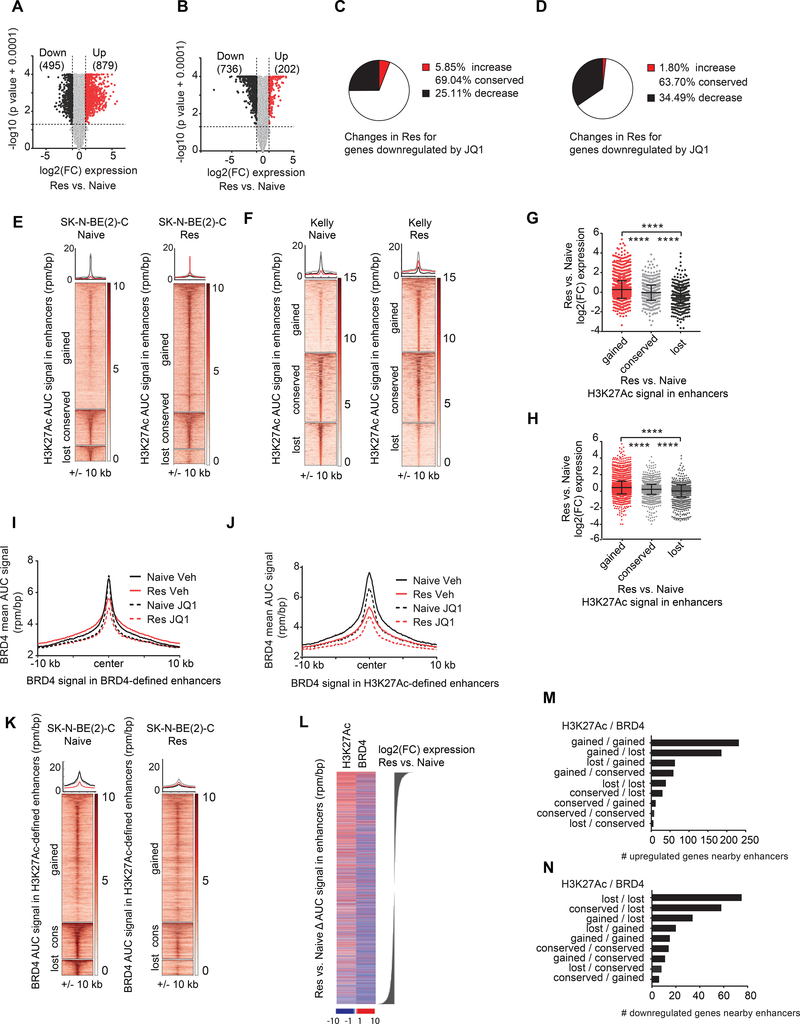
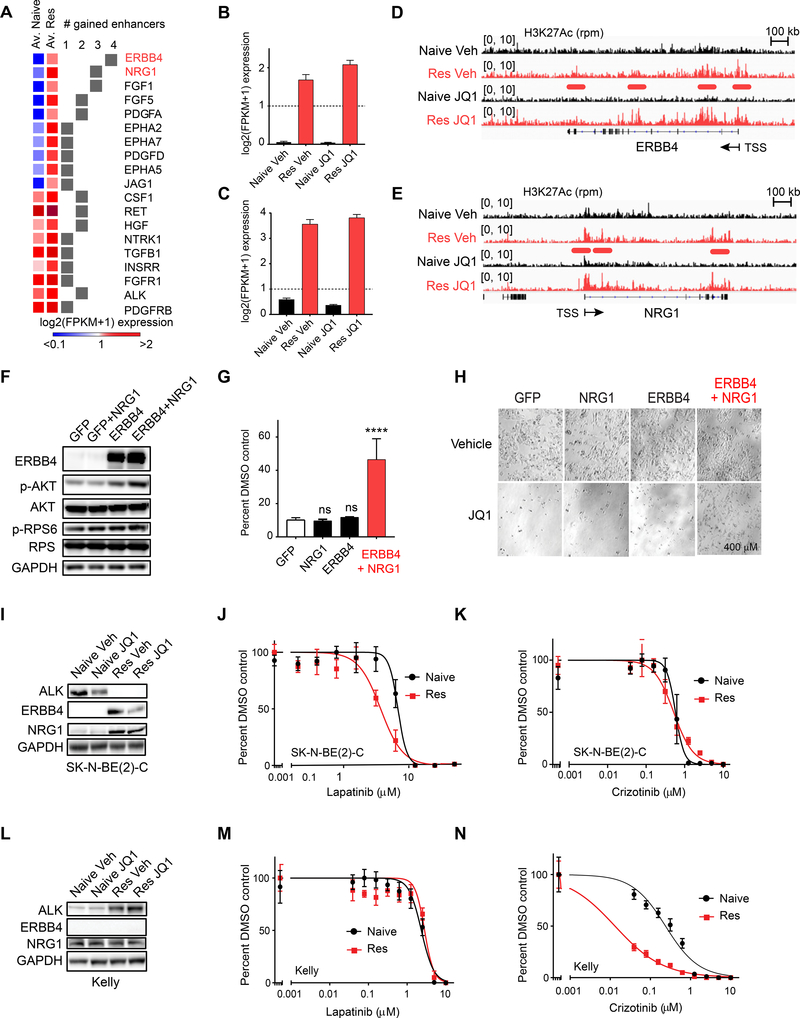
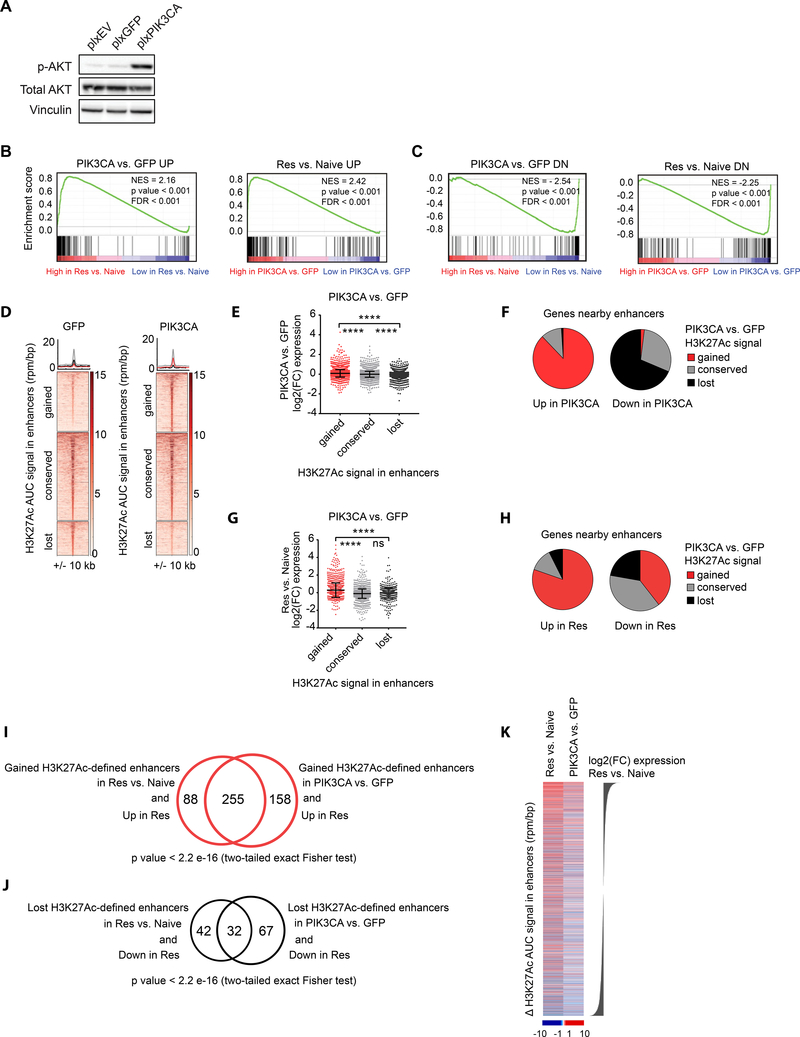
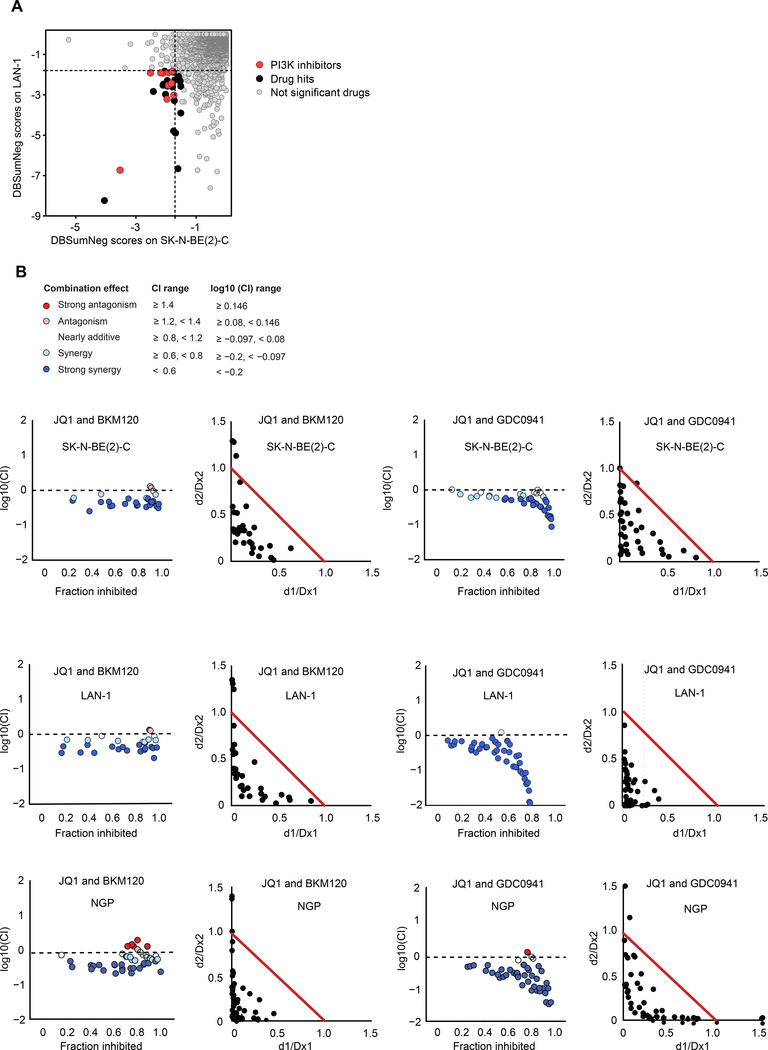
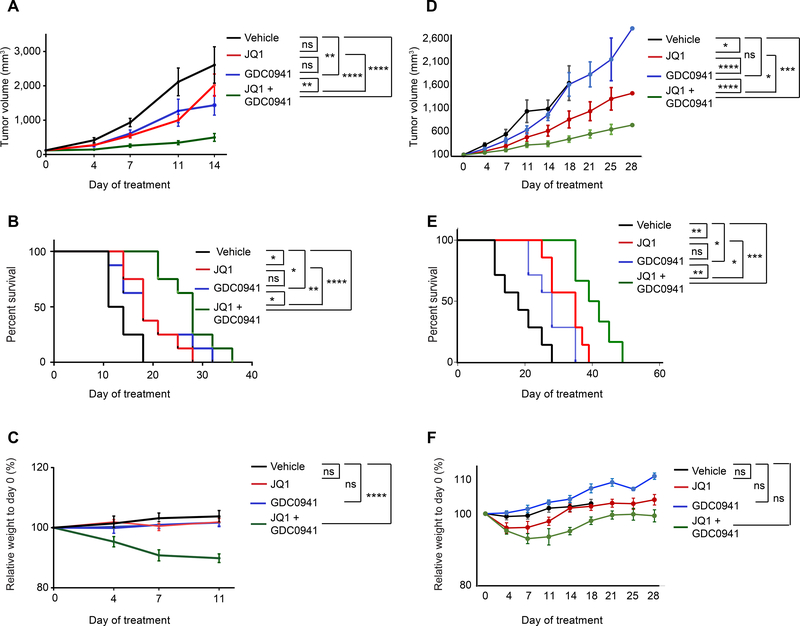
Drug resistance represents a major challenge to achieving durable responses to cancer therapeutics. Resistance mechanisms to epigenetically targeted drugs remain largely unexplored. We used bromodomain and extra-terminal domain (BET) inhibition in neuroblastoma as a prototype to model resistance to chromatin modulatory therapeutics. Genome-scale, pooled lentiviral open reading frame (ORF) and CRISPR knockout rescue screens nominated the phosphatidylinositol 3-kinase (PI3K) pathway as promoting resistance to BET inhibition. Transcriptomic and chromatin profiling of resistant cells revealed that global enhancer remodeling is associated with upregulation of receptor tyrosine kinases (RTKs), activation of PI3K signaling, and vulnerability to RTK/PI3K inhibition. Large-scale combinatorial screening with BET inhibitors identified PI3K inhibitors among the most synergistic upfront combinations. These studies provide a roadmap to elucidate resistance to epigenetic-targeted therapeutics and inform efficacious combination therapies.

Keywords: BET inhibition; MYCN; PI3K signaling; drug resistance; enhancer remodeling; neuroblastoma.


Conflict of interest statement

DECLARATION OF INTERESTS

K.S. participates in the DFCI/Novartis Drug Discovery Program which includes grant support for an unrelated project and previously included consulting and has consulted for Rigel Pharmaceuticals on a topic unrelated to this manuscript. R.B. and P.B. receive grant funding from Novartis Institute for Biomedical Research for unrelated projects. W.A.W. is founder of StemSynergy Therapeutics which works on targeting WNT signaling in colorectal cancer.

Figures

Figure 1:
Figure 1:. Genome-scale lentiviral ORF and CRISPR screens identify candidate drivers of BET inhibitor resistance in MYCN-amplified neuroblastoma.
A. Scatter plots of z-scores for log2 fold changes (log2(FC)) in ORF expression for JQ1 vs. ETP (y-axis) and I-BET151 vs. ETP (x-axis) in SK-N-BE(2)-C (left) and LAN-1 (right) cells. Genes with z-scores ≥ 2.5 with both BET inhibitors (dashed gray line) were nominated as candidate genes conferring resistance and classified as significant ORFs. B. Scatter plot showing the distribution of the JQ1 vs. ETP z-scores for the 150 ORFs included in the validation mini-ORF rescue screen in the LAN-1 cell line. C. Genome-scale pooled lenti-CRISPR screen in SK-N-BE(2)-C (left) and LAN-1 (right) cells under JQ1 and I-BET151 drug selection. Genes with z-scores ≥ 2.5 with both BET inhibitors (dashed gray line) were nominated as candidate sgRNAs conferring resistance and classified as significant sgRNAs. D-F. Western blots confirming overexpression of the indicated ORF hits with V5 antibody in cases where the V5 tag was expressed (D), or by antibodies directed against the ORF or downstream effectors (E, F) (p-AKT = pT308-AKT). G-H. Long-term viability assays (G) and colony formation assays (H) in SK-N-BE(2)-C cells overexpressing the indicated ORFs and treated with vehicle or 1 μM JQ1. Luciferase (LUC), LacZ, MMP15, and TANGO6 ORFs are included as negative controls. Data is presented as mean values of triplicate points ± standard deviation (SD), NT CTRL = non-targeting control ORF. NV= no virus. (* p value < 0.05, ** p value < 0.01, *** p value < 0.001, **** p value < 0.0001, Mann-Whitney nonparametric test). See also Figure S1 and Tables S1-S4.
Figure 2:
Figure 2:. Characterization of innate and acquired BET inhibitor resistant MYCN-amplified neuroblastoma cell lines.
A. Viability analysis of JQ1 treatment in four MYCN-amplified neuroblastoma cell lines. B-C. RPPA data demonstrating the top 20 upregulated (B) and downregulated (C) proteins and phosphoproteins in JQ1 resistant NGP cells compared to JQ1 sensitive SK-N-BE(2)-C and CHP-212 cells. D. Quantification of pS473-AKT, pT308-AKT, total AKT and PTEN expression levels based on RPPA data. E. Western blots for p-AKT and PTEN in neuroblastoma cell lines. (p-AKT = pT308-AKT). F. Effects of JQ1 treatment on the viability of naive and JQ1 resistant (Res) SK-N-BE(2)-C cells. G. Absolute growth rates of SK-N-BE(2)-C naive cells treated with vehicle control and two replicates of JQ1 resistant cells treated with 1 μM JQ1. H. Effects of I-BET151 treatment on the viability of naive and JQ1 resistant SK-N-BE(2)-C cells. I. RPPA data demonstrating the top 20 most differentially expressed proteins in JQ1 resistant vs. naive SK-N-BE(2)-C cells treated with vehicle (Veh) or JQ1. J. Quantification of pS473-AKT, pT308-AKT, and total AKT levels from data shown in (I). K. Western blot of PI3K pathway activity in JQ1 resistant and naive cells. (p-AKT = pT308-AKT). L-N. Effects of the PI3K inhibitors GDC0941 (L), BYL719 (M), and BKM120 (N) on the viability of JQ1 resistant vs. naive SK-N-BE(2)-C cells. Results are presented as representative dose response curves of three independent experiments. Data is presented as mean values of eight technical replicates ± SD. See also Figure S2.
Figure 3.
Figure 3.. Enhancer remodeling is associated with the transcriptional changes in the BET inhibitor resistant state.
A-B. Volcano plots highlighting the genes differentially expressed in resistant vs. naive SK-N-BE(2)-C (A) and Kelly (B) cells. The number of differentially expressed genes are shown in parentheses. C-D. Pie charts depicting the percent transcriptional changes in the resistant cells for genes downregulated by JQ1 in naive cells SK-N-BE(2)-C (C) and Kelly (D) cells. E-F. Heatmaps showing H3K27Ac binding among gained, conserved and lost enhancers in resistant vs. naive SK-N-BE(2)-C (E) and Kelly (F) cells. Regions are ranked by H3K27Ac binding signal in naive cells. Metaplots for average binding intensities across the gained (red), conserved (gray) and lost (black) enhancer regions are shown on top. G-H. Dot plots showing log2(FC) in expression for the genes associated with gained, conserved, and lost enhancers in SK-N-BE(2)-C (G) and Kelly (H) JQ1 resistant vs. naive cells. (**** p value < 0.0001 un-paired two sample Student t-test with Welch correction). Data are presented as mean values ± SD. I. Metaplot showing the average BRD4 binding signal (rpm/bp) on BRD4-defined enhancer regions +/− 10 kb in naive and resistant SK-N-BE(2)-C cells treated with vehicle control or JQ1. J. Metaplot showing the average BRD4 binding signal (rpm/bp) on H3K27Ac-defined enhancer regions +/− 10 kb in naive and resistant SK-N-BE(2)-C cells treated with vehicle control or JQ1. K. Heatmaps showing BRD4 binding on gained, conserved and lost H3K27Ac-defined enhancer regions in resistant vs. naive SK-N-BE(2)-C cells. Regions are ranked by BRD4 binding signal in naive cells. Metaplots for average binding intensities across the gained (red), conserved (gray) and lost (black) enhancer regions are shown on top. L. Heatmap showing ΔAUC for H3K27Ac and BRD4 signal in enhancers in resistant vs. naive SK-N-BE(2)-C cells ranked by log2(FC) expression changes. M-N. Barplots depicting the number of upregulated (M) and downregulated (N) genes nearby enhancers in resistant vs. naïve SK-N-BE(2)-C cells grouped according to gained, conserved or lost combinations of H3K27Ac and BRD4 levels in enhancer regions. For heatmaps, each row represents a single genomic region (+/− 10 kb) from the enhancer center. Genomic occupancy is shaded by binding intensity in units of reads per million per base pair (rpm/bp). See also Figure S3 and S4.
Figure 4:
Figure 4:. Enhancer remodeling is associated with transcriptional upregulation of RTKs upstream of PI3K signaling engendering therapeutic vulnerabilities.
A. Heatmap demonstrating the average expression in naive and resistant cells for all RTK/GF genes associated with 1–4 gained enhancers and log2(FC) expression > 1 in resistant vs. naive cells. B-C. Average log2 FPKM expression for ERBB4 (B) and NRG1 (C) across JQ1 naive and resistant samples. Error bars represent SD. D-E. H3K27Ac ChIP-sequencing tracks for ERBB4 (D) and NRG1 (E). Enhancers gained in resistance are underlined in red. F. Western blot of SK-N-BE(2)-C cells engineered to overexpress GFP or ERBB4 and stimulated with vehicle (Veh) or recombinant NRG1 for 6 hr. Western blots are probed for downstream effectors of PI3K signaling. G. Long-term viability assays in SK-N-BE(2)-C cells overexpressing the indicated proteins and treated with vehicle (DMSO) or 1 μM JQ1. Data are presented as percent viable cells relative to the DMSO arm for each condition. Shown are mean values of quadruplicate points ± SD. (ns = not significant, **** p value < 0.0001, un-paired two sample Student t-test with Welch correction). H. Representative images of data presented in (G). I. Western blot analysis of naive and JQ1 resistant SK-N-BE(2)-C cells probed for ALK, ERBB4, and NRG1. Cells were treated with vehicle (Veh) or JQ1 for 24 hr. J-K. Effects of lapatinib (J) and crizotinib (K) treatment on viability in naive and JQ1 resistant SK-N-BE(2)-C cells. L. Western blot analysis of naive and JQ1 resistant Kelly cells treated with vehicle (Veh) or JQ1 for 24 hr. M-N. Effects of lapatinib (M) and crizotinib (N) treatment on viability in naive and JQ1 resistant Kelly cells. See also Figure S5.
Figure 5:
Figure 5:. Transcriptomic analysis of BET inhibitor resistant cells reveals overexpression of PI3K signaling recapitulates enhancer remodeling and transcriptional changes characterizing the resistant state.
A. Western blot of SK-N-BE(2)-C cells engineered to overexpress an empty vector (plxEV), plxGFP or plxPIK3CA. B. GSEA demonstrating enrichment of genes upregulated in resistance among genes upregulated by PIK3CA overexpression (left) and vice versa (right). C. GSEA demonstrating enrichment of genes downregulated in resistance among genes downregulated by PIK3CA overexpression (left) and vice versa (right). D. Heatmaps showing H3K27Ac binding in gained, conserved and lost enhancer regions in PIK3CA vs. GFP samples. Each row represents a single genomic region +/− 10 kb from the enhancer center. Genomic occupancy is shaded by binding intensity in units of reads per million per base pair (rpm/bp). Regions are ranked by H3K27Ac binding signal in GFP cells. Metaplots for average binding intensities across the gained (red), conserved (gray) and lost (black) enhancer regions are shown on top. E. Dot plots showing log2(FC) in expression in PIK3CA vs. GFP cells for the genes associated with gained, conserved, and lost enhancers with PIK3CA overexpression (**** p value < 0.0001 un-paired two sample Student t-test with Welch correction). F. Pie charts showing the percentages of genes with gained, conserved or lost nearby enhancers with PIK3CA overexpression, among genes which are upregulated or downregulated by PIK3CA overexpression. G. Dot plots showing log2(FC) in expression in resistant vs. naive SK-N-BE(2)-C cells for the genes associated with gained, conserved, and lost enhancers with PIK3CA overexpression (**** p value < 0.0001, ns= not significant, un-paired two sample Student t-test with Welch correction). H. Pie charts showing the percentages of genes with gained, conserved and lost nearby enhancers with PIK3CA overexpression, among genes which are upregulated or downregulated in resistance. I. Venn-diagram showing the overlap of genes upregulated in resistant SK-N-BE(2)-C cells with nearby gained enhancers in resistance vs. genes upregulated in resistant SK-N-BE(2)-C cells nearby gained enhancers in PIK3CA overexpressing SK-N-BE(2)-C cells. Significance estimated based on two-tailed Fisher exact test. J. Venn-diagram showing the overlap of genes downregulated in resistant SK-N-BE(2)-C cells with nearby lost enhancers in resistant SK-N-BE(2)-C cells vs. genes downregulated in resistant SK-N-BE(2)-C cells with nearby lost enhancers in PIK3CA overexpressing SK-N-BE(2)-C cells. Significance estimated based on two-tailed Fisher exact test. K. Heatmaps showing ΔH3K27Ac AUC signal in enhancers for resistant vs. naive and PIK3CA vs. GFP samples ranked by log2(FC) expression in resistant vs. naive SK-N-BE(2)-C cells. Enhancers in this figure were defined by H3K37Ac binding. Dot plots in this figure are presented as mean values ± SD.
Figure 6:
Figure 6:. Chemical combinatorial screening identifies PI3K inhibitors as highly synergistic with JQ1 in MYCN-amplified neuroblastoma.
A. JQ1 screened against the Mechanism Interrogation PlatE (MIPE) library in SK-N-BE(2)-C and LAN-1 MYCN-amplified neuroblastoma cell lines. Synergy was assessed using the Bliss model. DBSumNeg is defined as the sum of negative deviations from the Bliss model. Dotted black lines indicate threshold for synergy. B. Synergy was assessed by Chou-Talalay combination index (CI) for JQ1 and the PI3K inhibitors, BKM120 and GDC0941, across the indicated cell lines. For CI plots, the x-axis represents fraction inhibited and the y-axis represents log10(CI). Normalized isobolograms depict CI scores over a range of concentrations. The coordinates of the CI scores are d1/Dx1 and d2/Dx2, where Dx1 is the concentration of drug 1 (JQ1) that alone produces the fractional inhibition effect x, and Dx2 is the concentration of drug 2 (PI3Ki) that alone produces the fractional inhibition effect x. The red line displayed is the line of additivity. See also Figure S6 and Table S5.
Figure 7.
Figure 7.. BET inhibitors and PI3K inhibitors are strongly synergistic in mouse models of MYCN-amplified neuroblastoma
A. Tumor volume measurements for SK-N-BE(2)-C xenograft nude mice treated with vehicle control, 50 mg/kg JQ1 IP QD, 100 mg/kg GDC0941 PO QD, or the combination of JQ1 and GDC0941 for 14 days. Data for a given time point were plotted if >50% of mice in the group were alive. Data are plotted as mean values ± SD (n = 8). B. Kaplan-Meier survival curves for the experiment described in (A). C. Relative weight measurements of mice from experiment described in (A). Data are plotted as mean values ±SEM (n=8). Each treatment condition was compared to the vehicle treatment. D. Tumor volume measurements of a PDX mouse model of MYCN-amplified neuroblastoma treated with vehicle control, 50 mg/kg JQ1 IP QD, 100 mg/kg GDC0941 QD PO, or the combination of JQ1 and GDC0941 for 28 days. Data for a given time point were plotted if >50% of mice in the group were alive. Data are plotted as mean values ± SD (n = 7). E. Kaplan-Meier survival curves for the experiment described in (D). F. Relative weight measurements of mice from experiment described in (D). (ns = not significant, * p value < 0.05, ** p value < 0.01, *** p value < 0.001, **** p value < 0.0001). For tumor volume and weight measurements, significance was determined by 2-way ANOVA with Tukey post hoc test. For survival analysis, significance was determined by log-rank Mantel Cox test.

References

    1. Berthon C, Raffoux E, Thomas X, Vey N, Gomez-Roca C, Yee K, Taussig DC, Rezai K, Roumier C, Herait P, et al. (2016). Bromodomain inhibitor OTX015 in patients with acute leukaemia: a dose-escalation, phase 1 study. The Lancet Haematology 3, e186–195. - PubMed
    1. Bliss CI (1956). The calculation of microbial assays. Bacteriological reviews 20, 243–258. - PMC - PubMed
    1. Boeva V, Louis-Brennetot C, Peltier A, Durand S, Pierre-Eugene C, Raynal V, Etchevers HC, Thomas S, Lermine A, Daudigeos-Dubus E, et al. (2017). Heterogeneity of neuroblastoma cell identity defined by transcriptional circuitries. Nature genetics. - PubMed
    1. Brown JD, Lin CY, Duan Q, Griffin G, Federation A, Paranal RM, Bair S, Newton G, Lichtman A, Kung A, et al. (2014). NF-kappaB directs dynamic super enhancer formation in inflammation and atherogenesis. Molecular cell 56, 219–231. - PMC - PubMed
    1. Carroll TS, Liang Z, Salama R, Stark R, and de Santiago I (2014). Impact of artifact removal on ChIP quality metrics in ChIP-seq and ChIP-exo data. Frontiers in genetics 5, 75. - PMC - PubMed

Publication types

MeSH terms

Substances