. 2018 Dec 10;34(6):996-1011.e8.
doi: 10.1016/j.ccell.2018.10.016.

Molecular Evolution of Early-Onset Prostate Cancer Identifies Molecular Risk Markers and Clinical Trajectories

Affiliations

Molecular Evolution of Early-Onset Prostate Cancer Identifies Molecular Risk Markers and Clinical Trajectories

Clarissa Gerhauser et al. Cancer Cell. .

Abstract

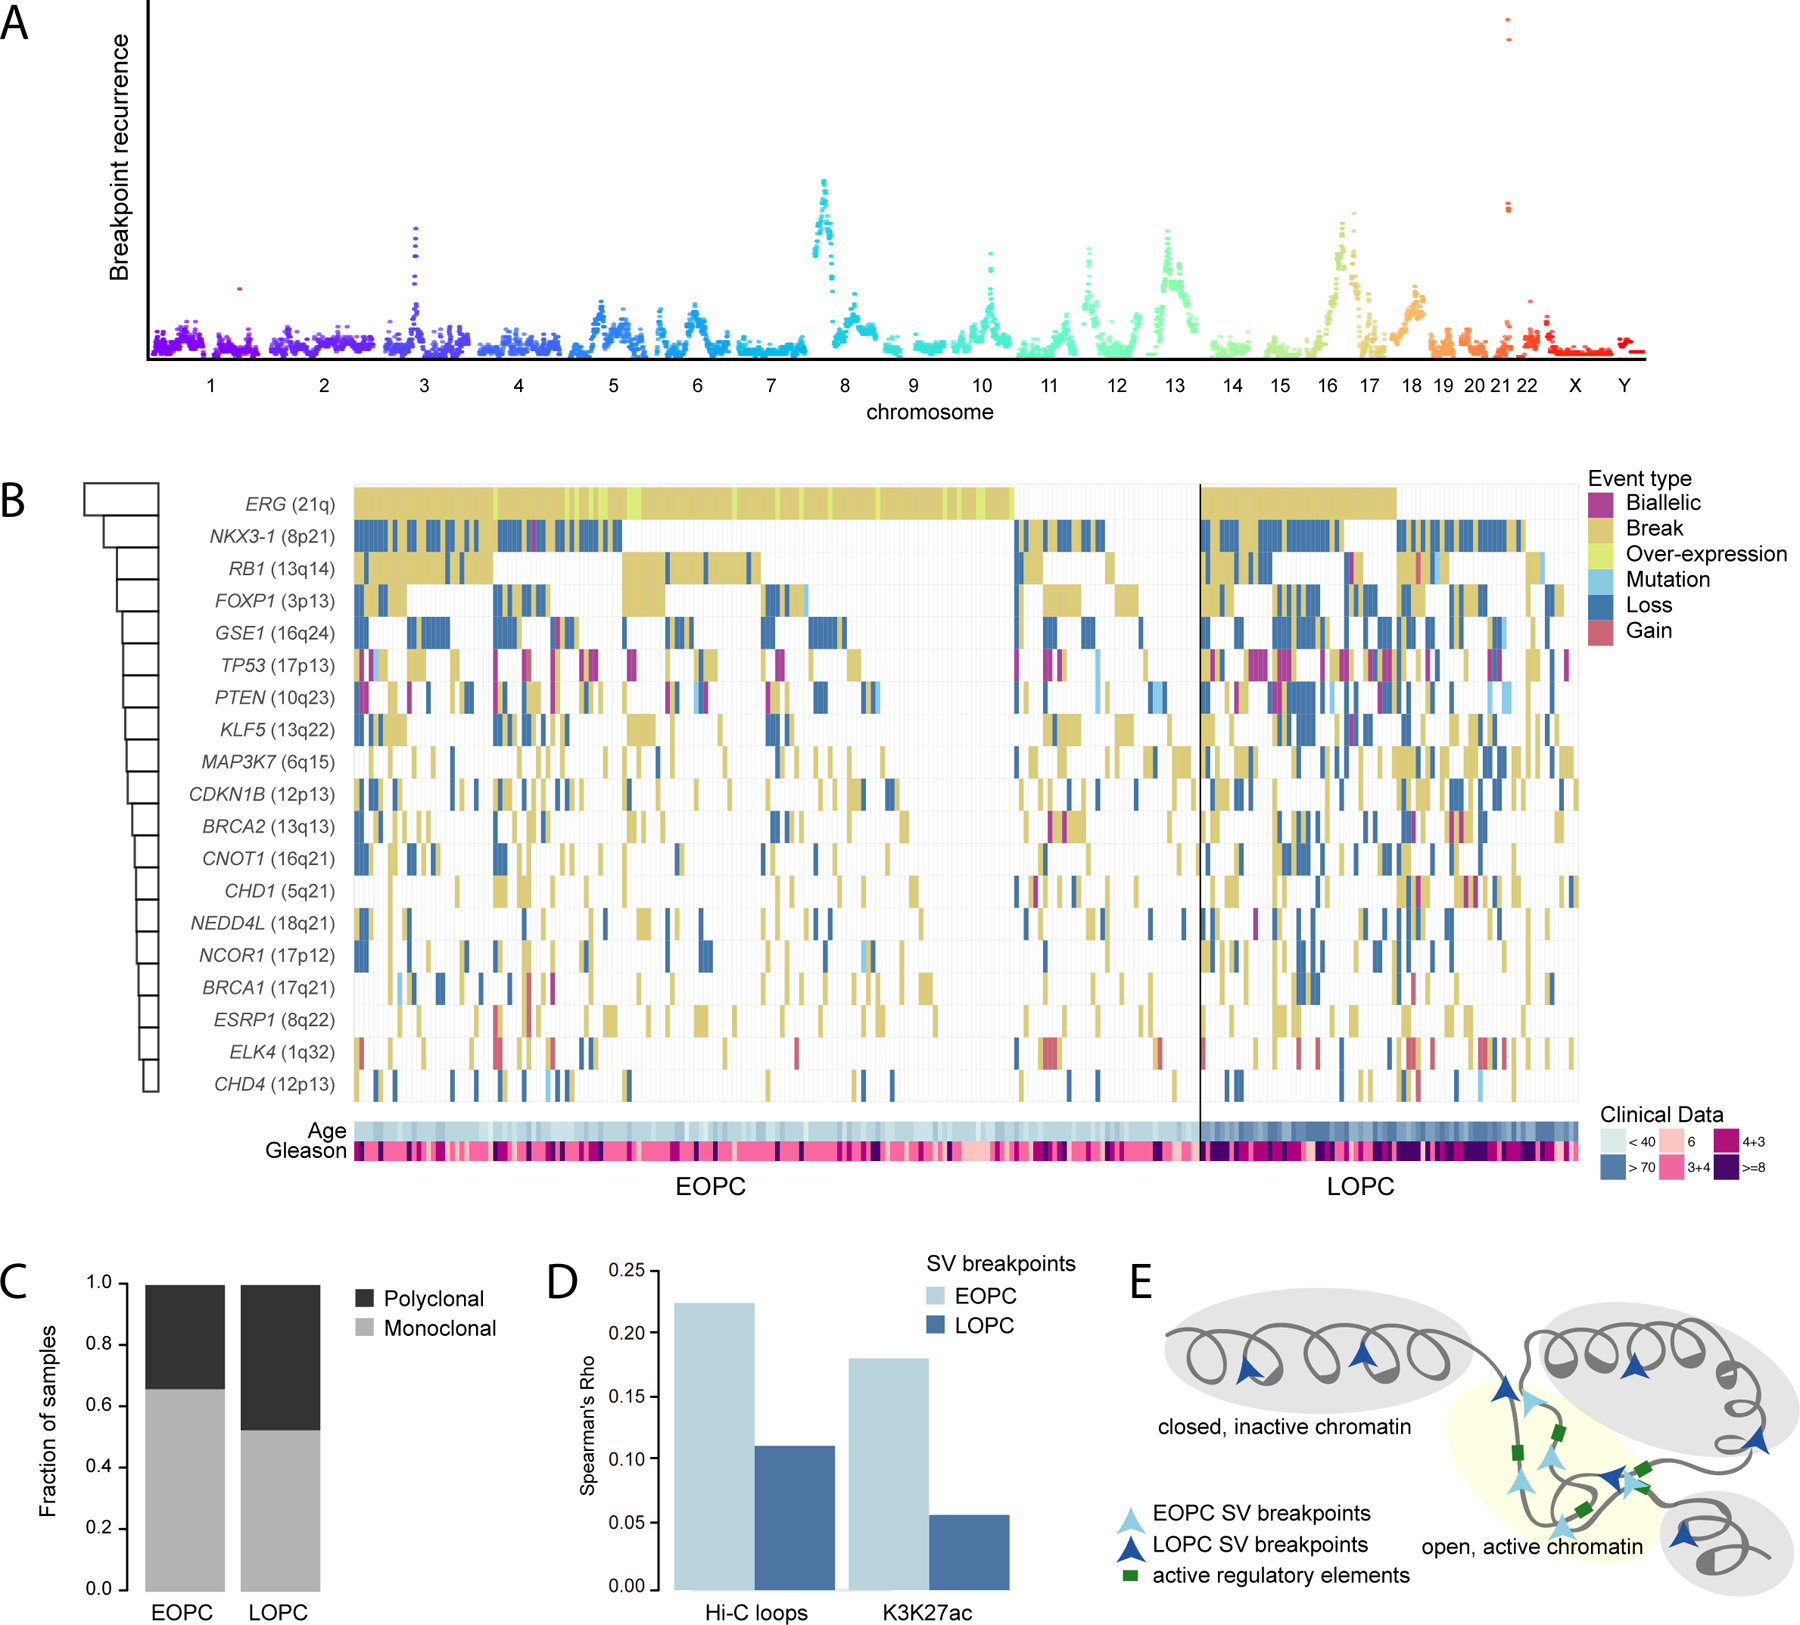
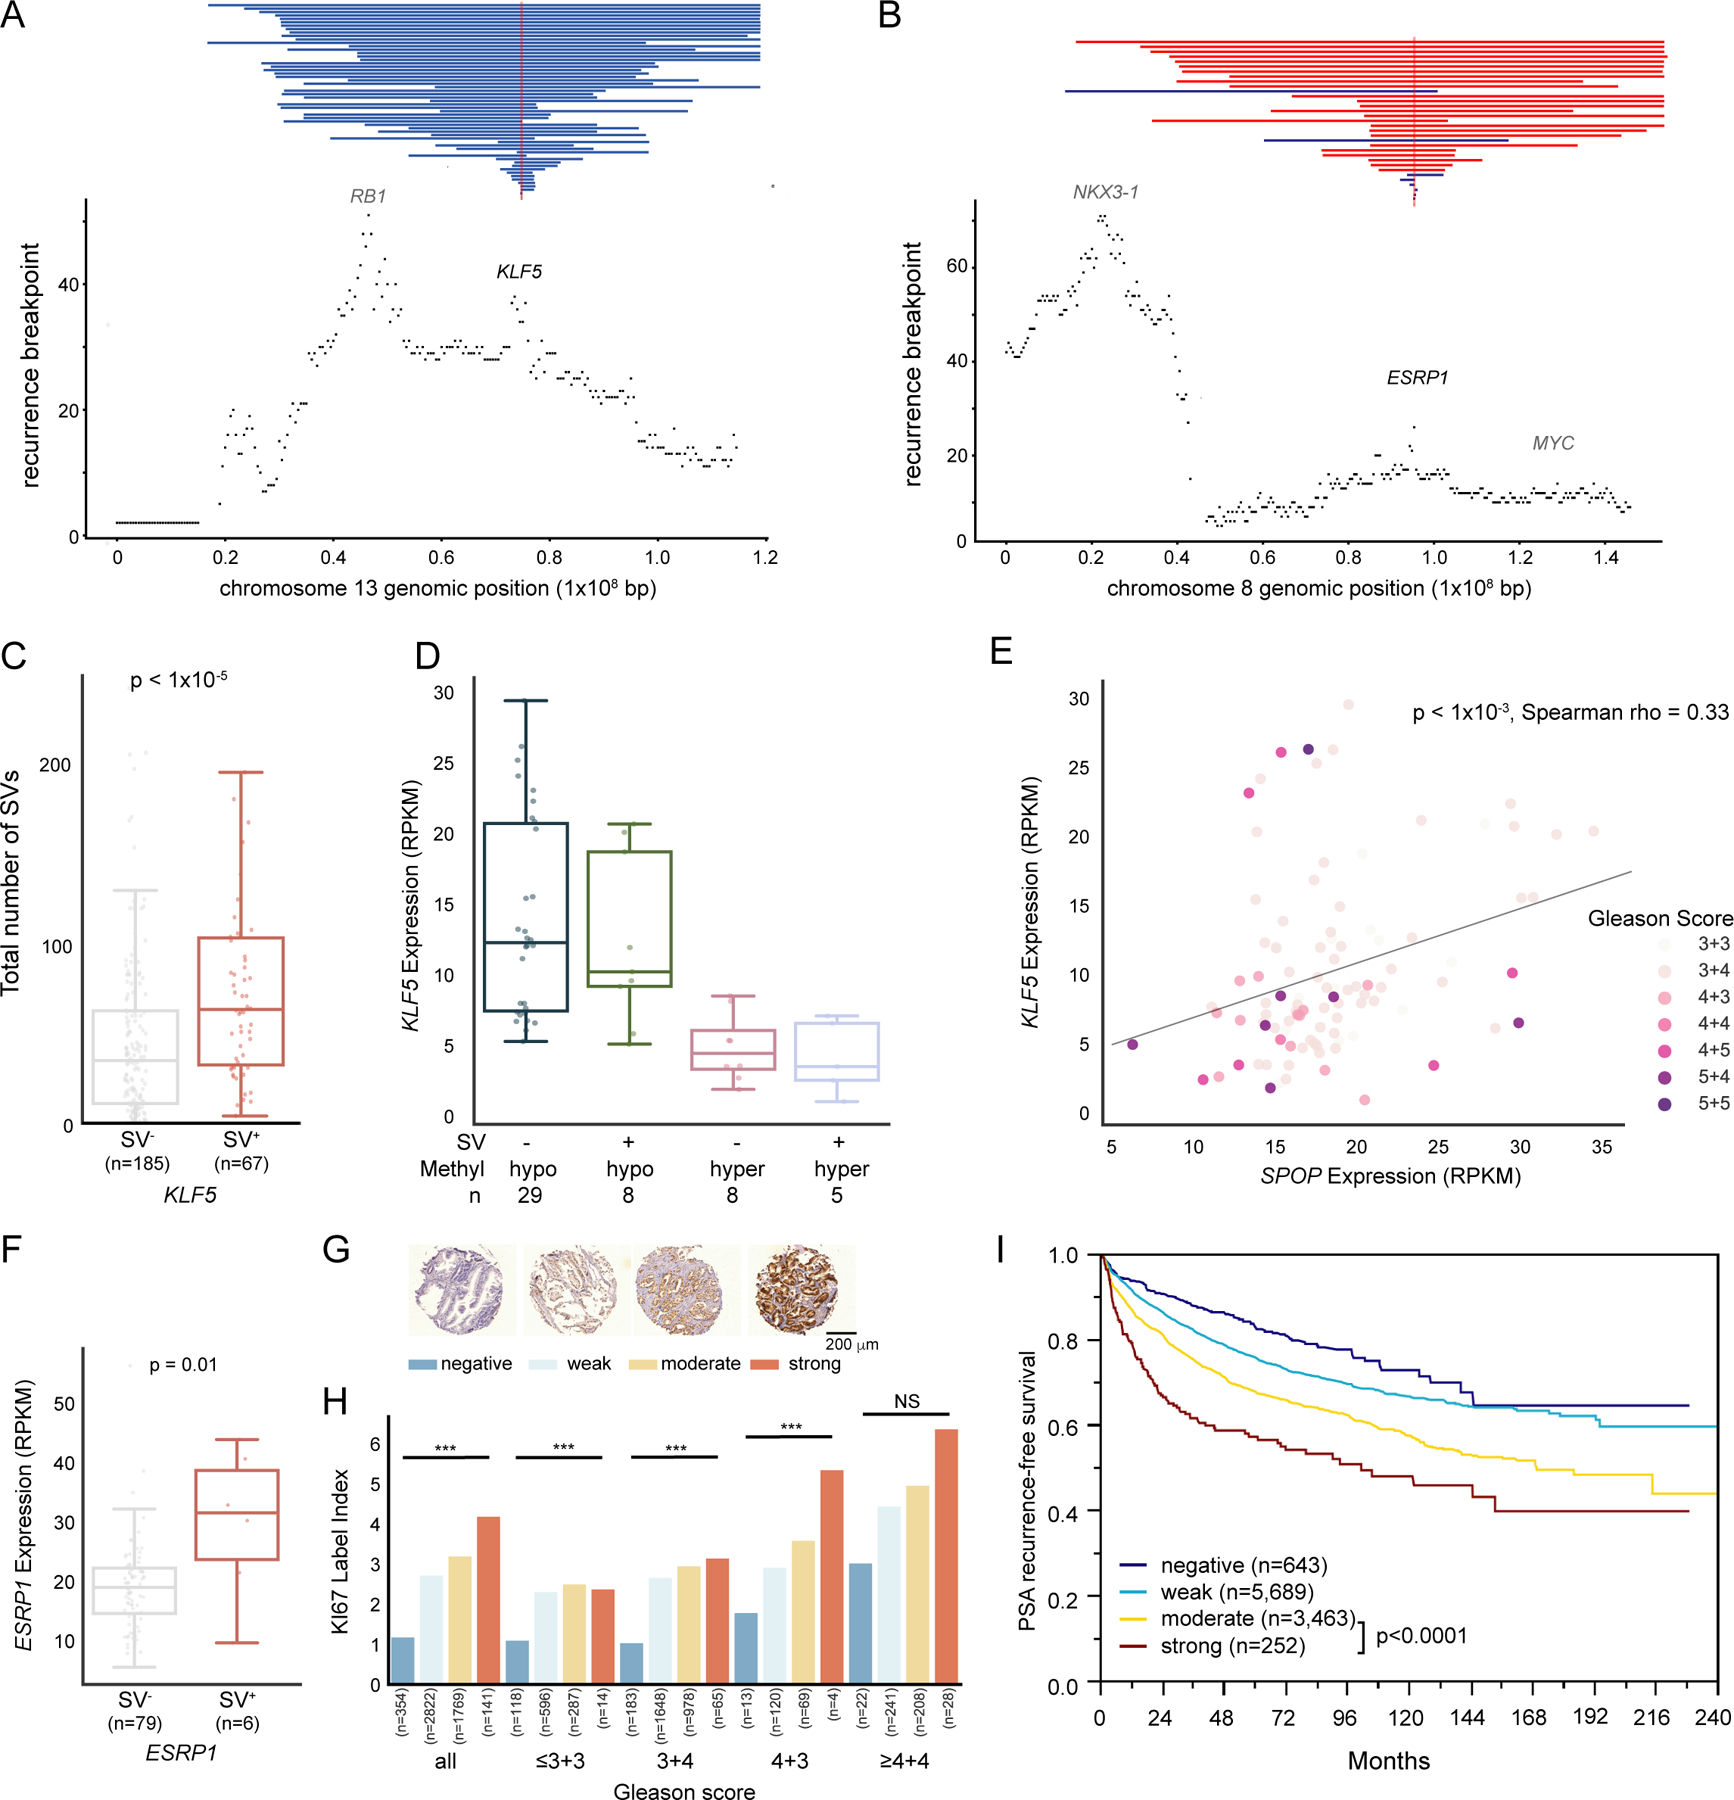
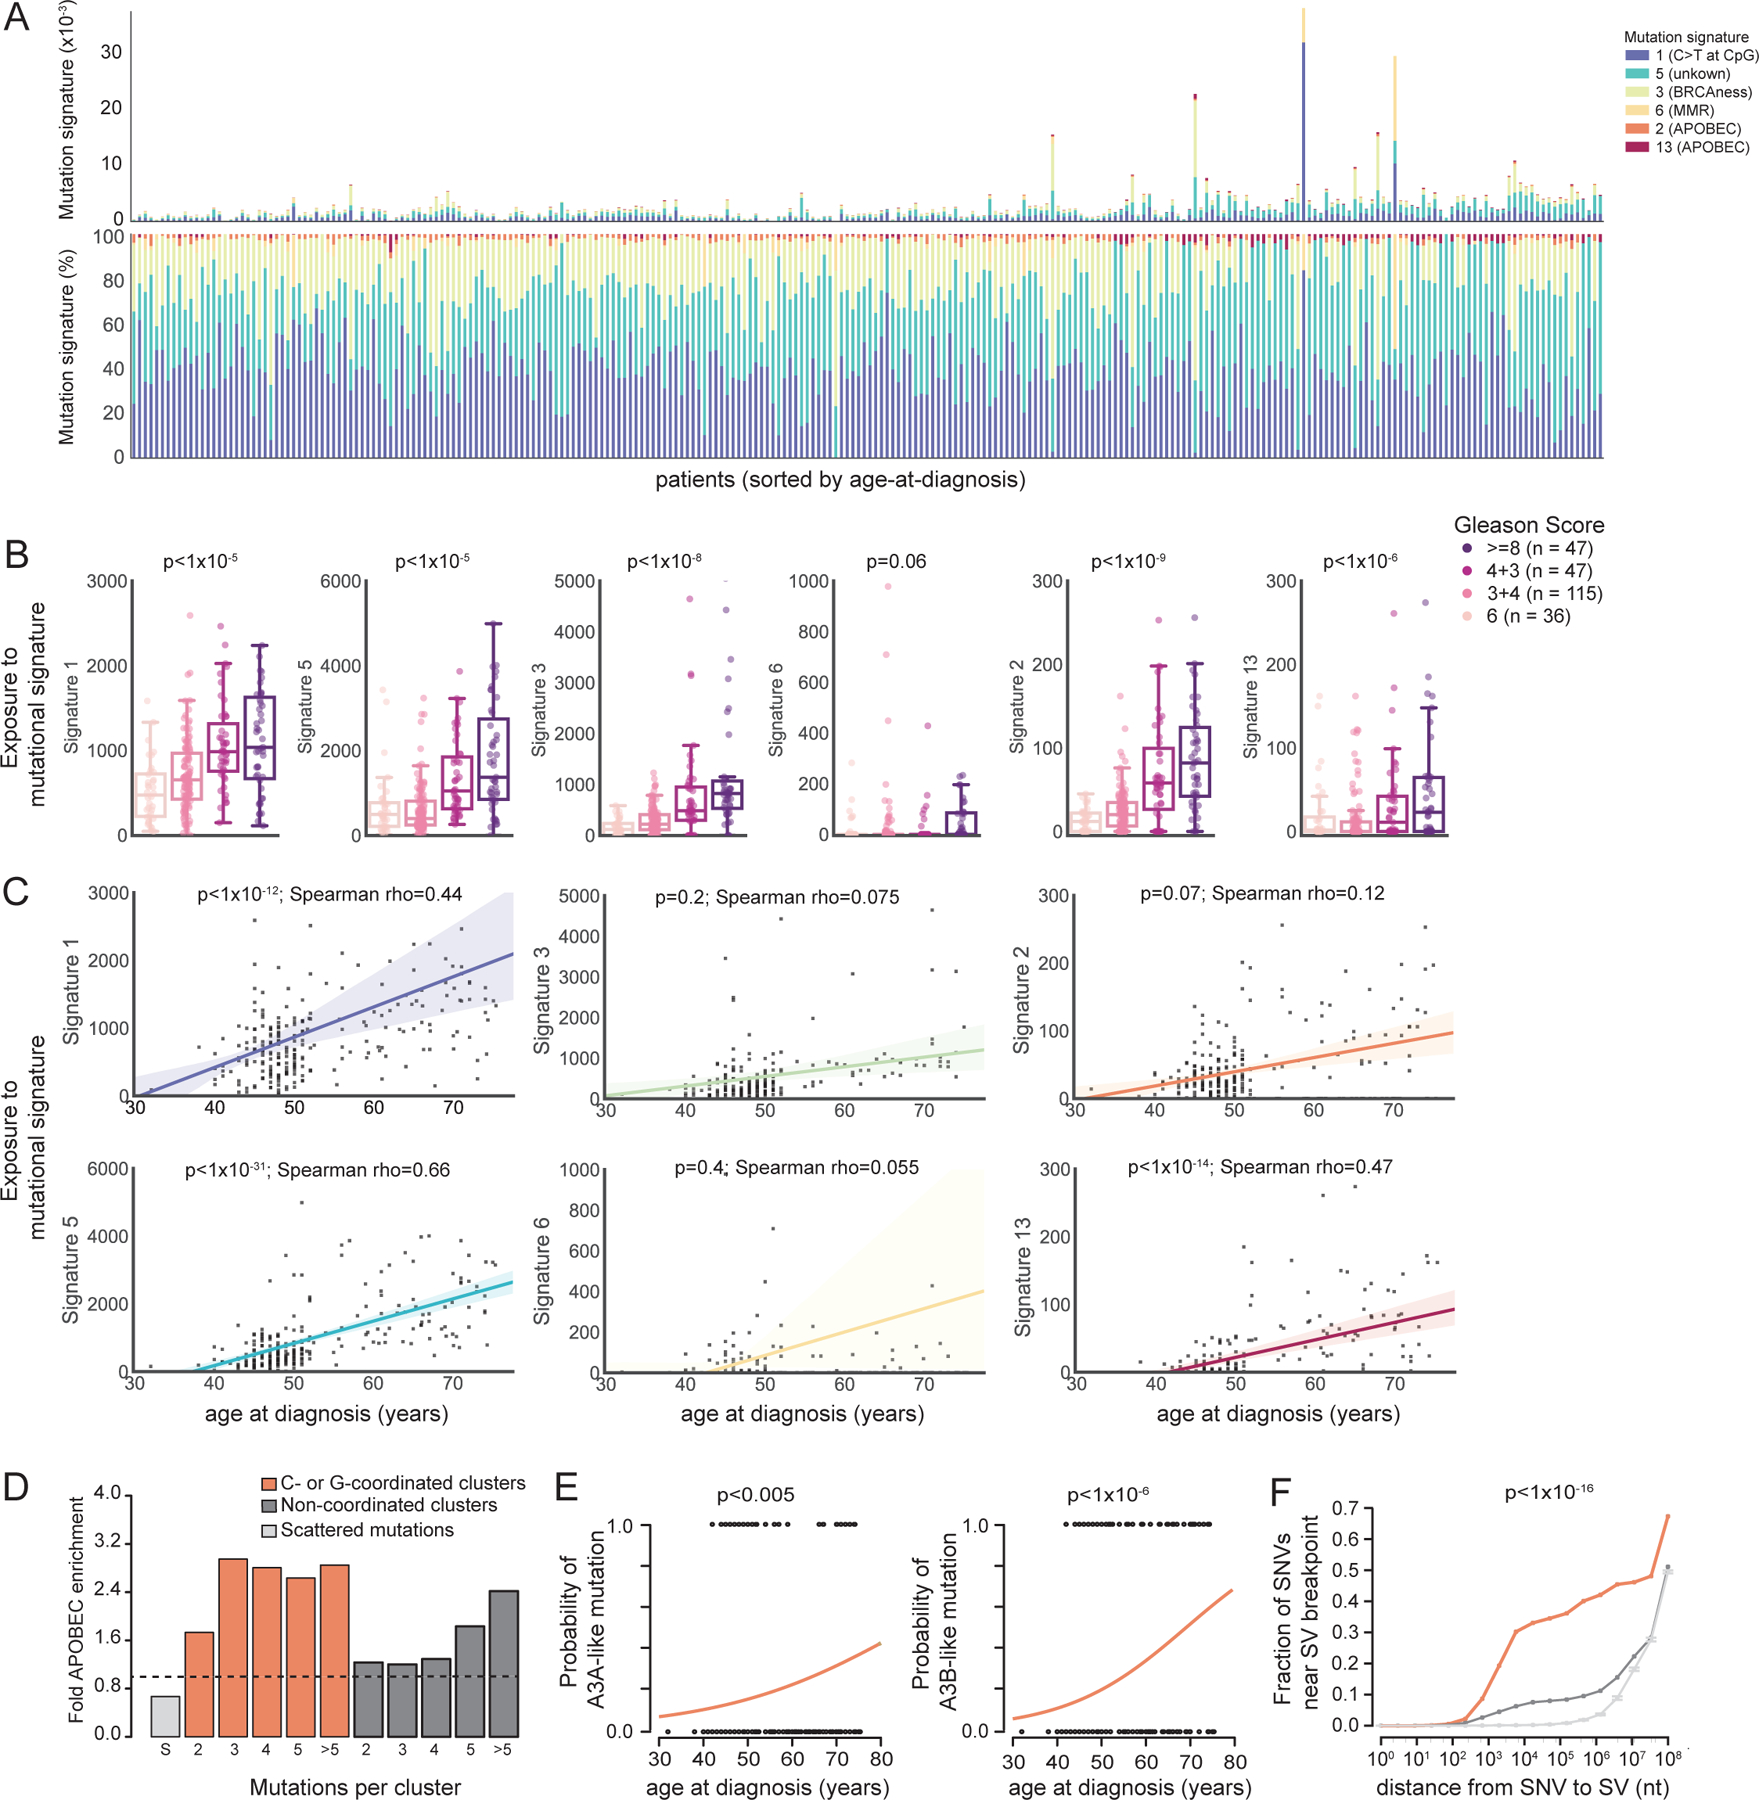
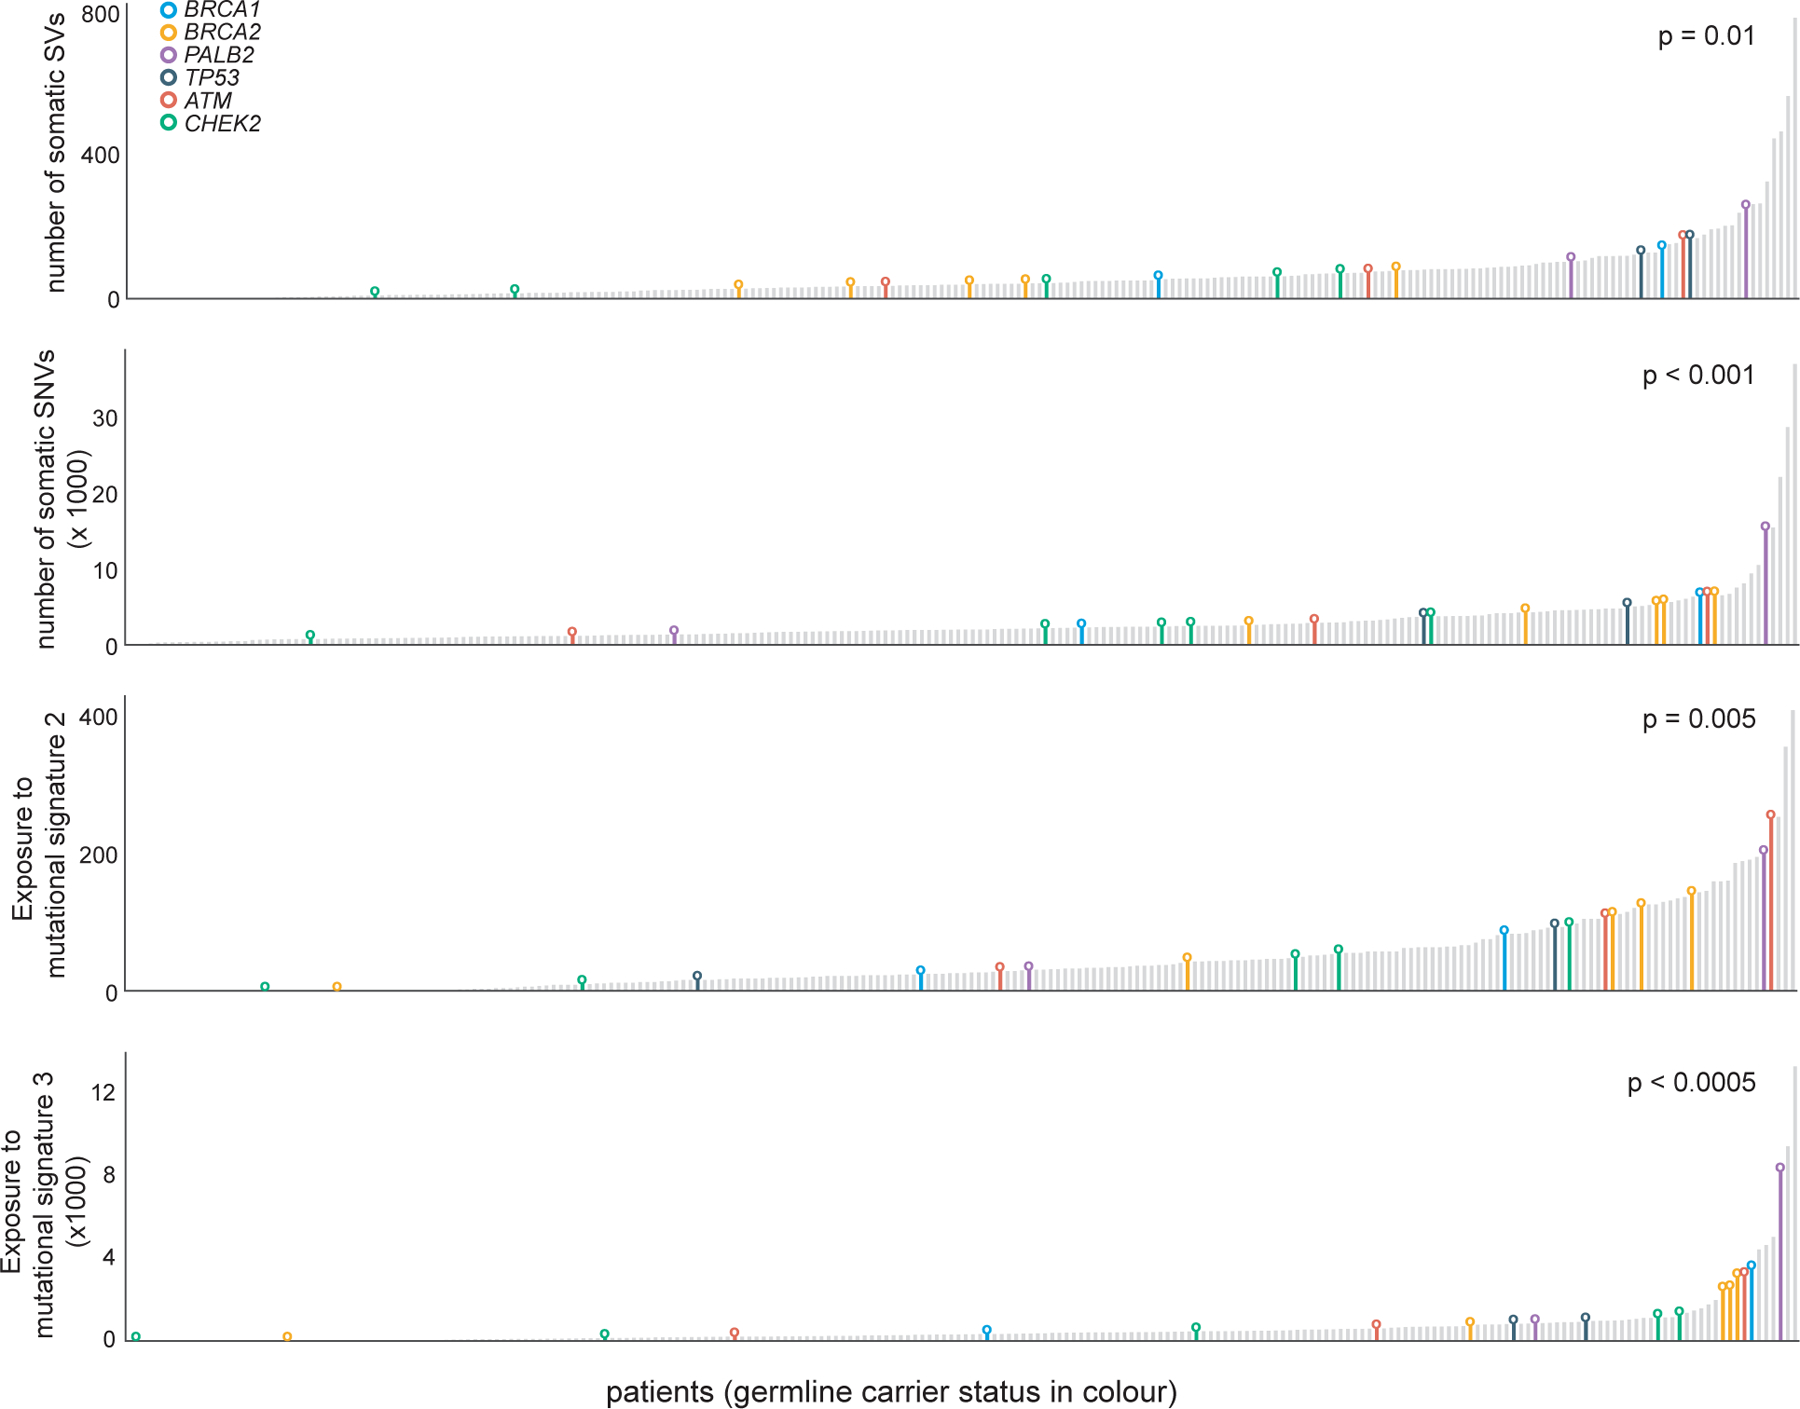
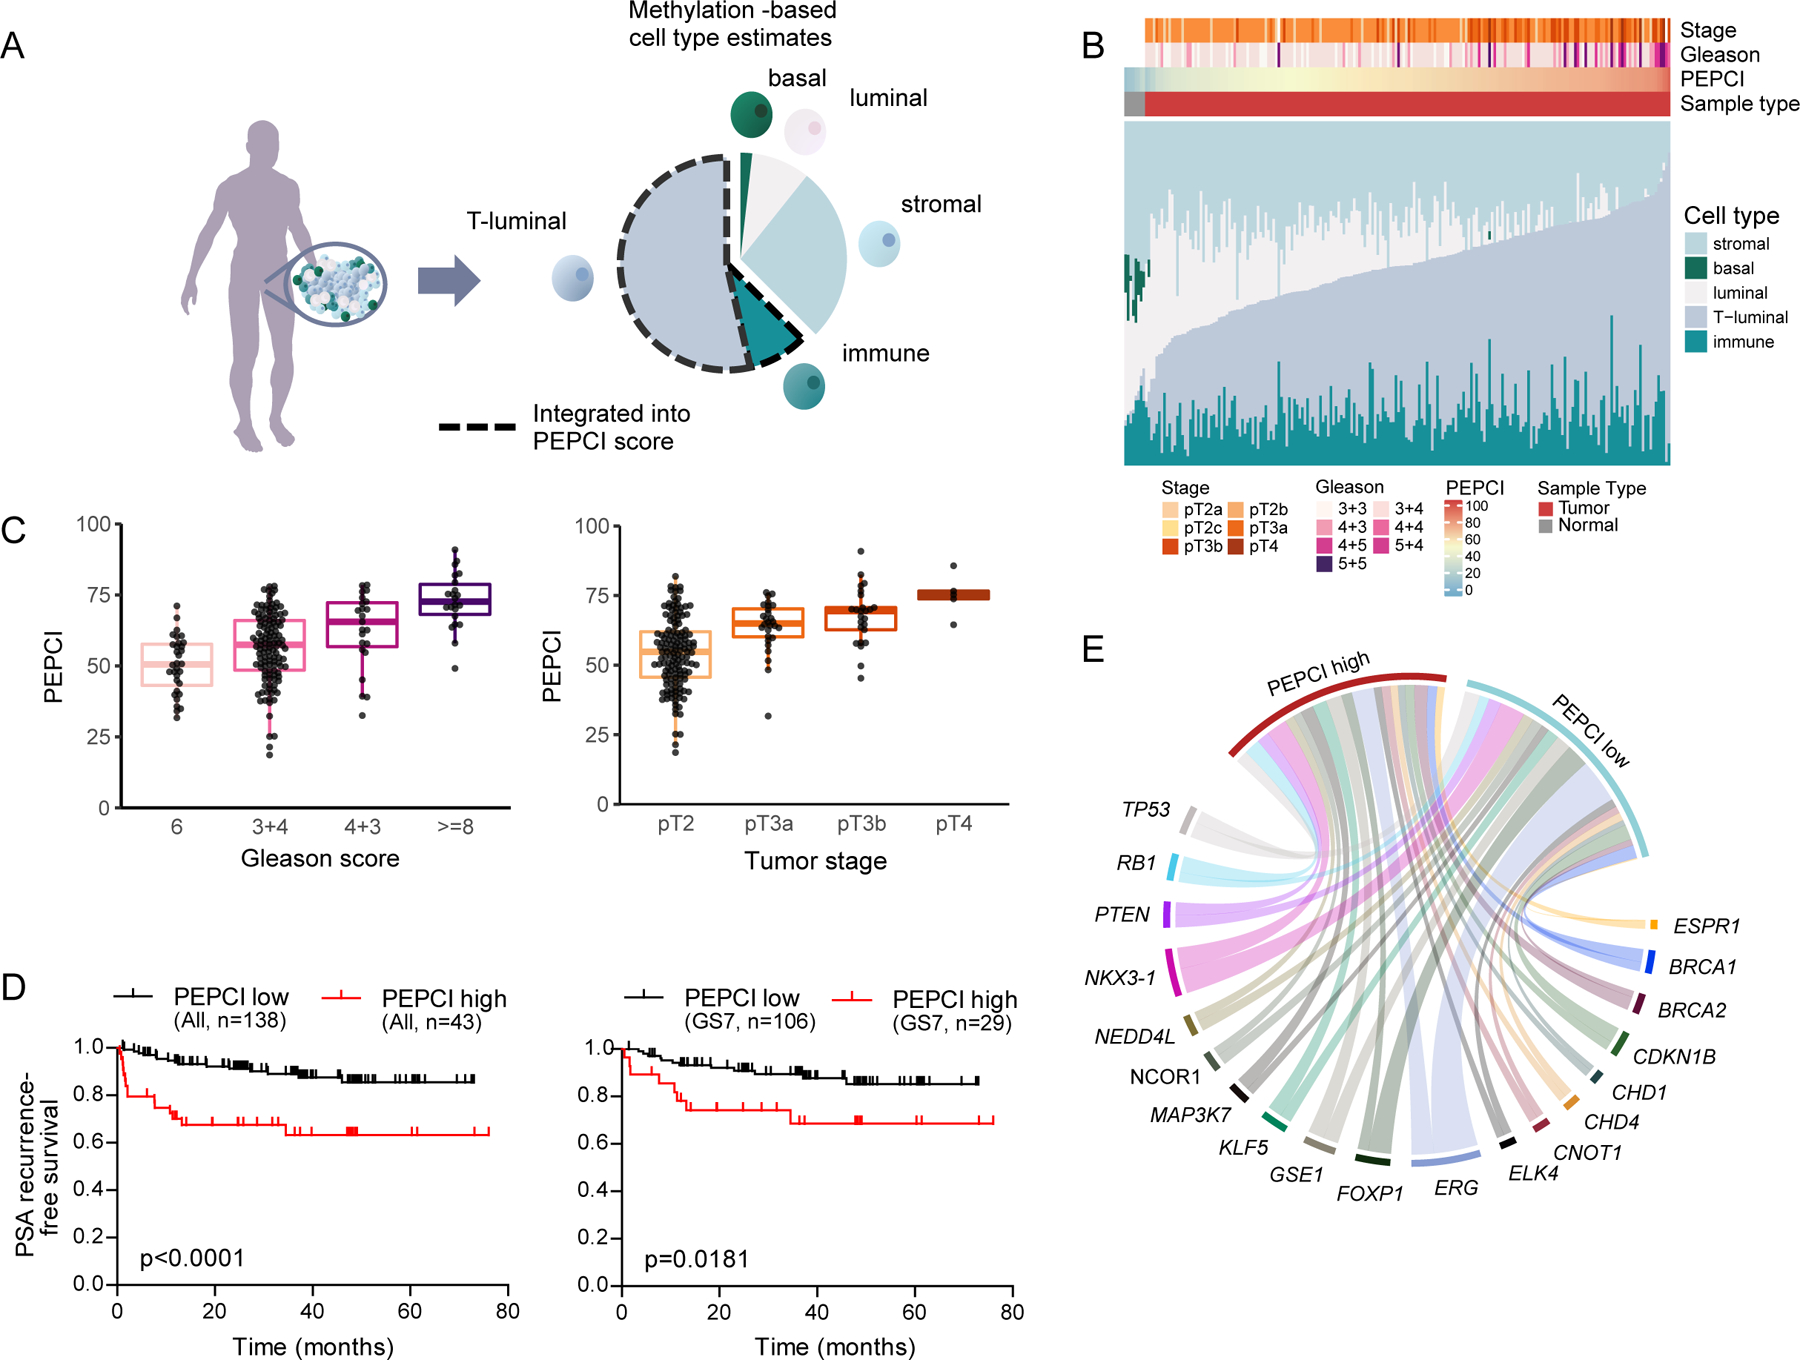
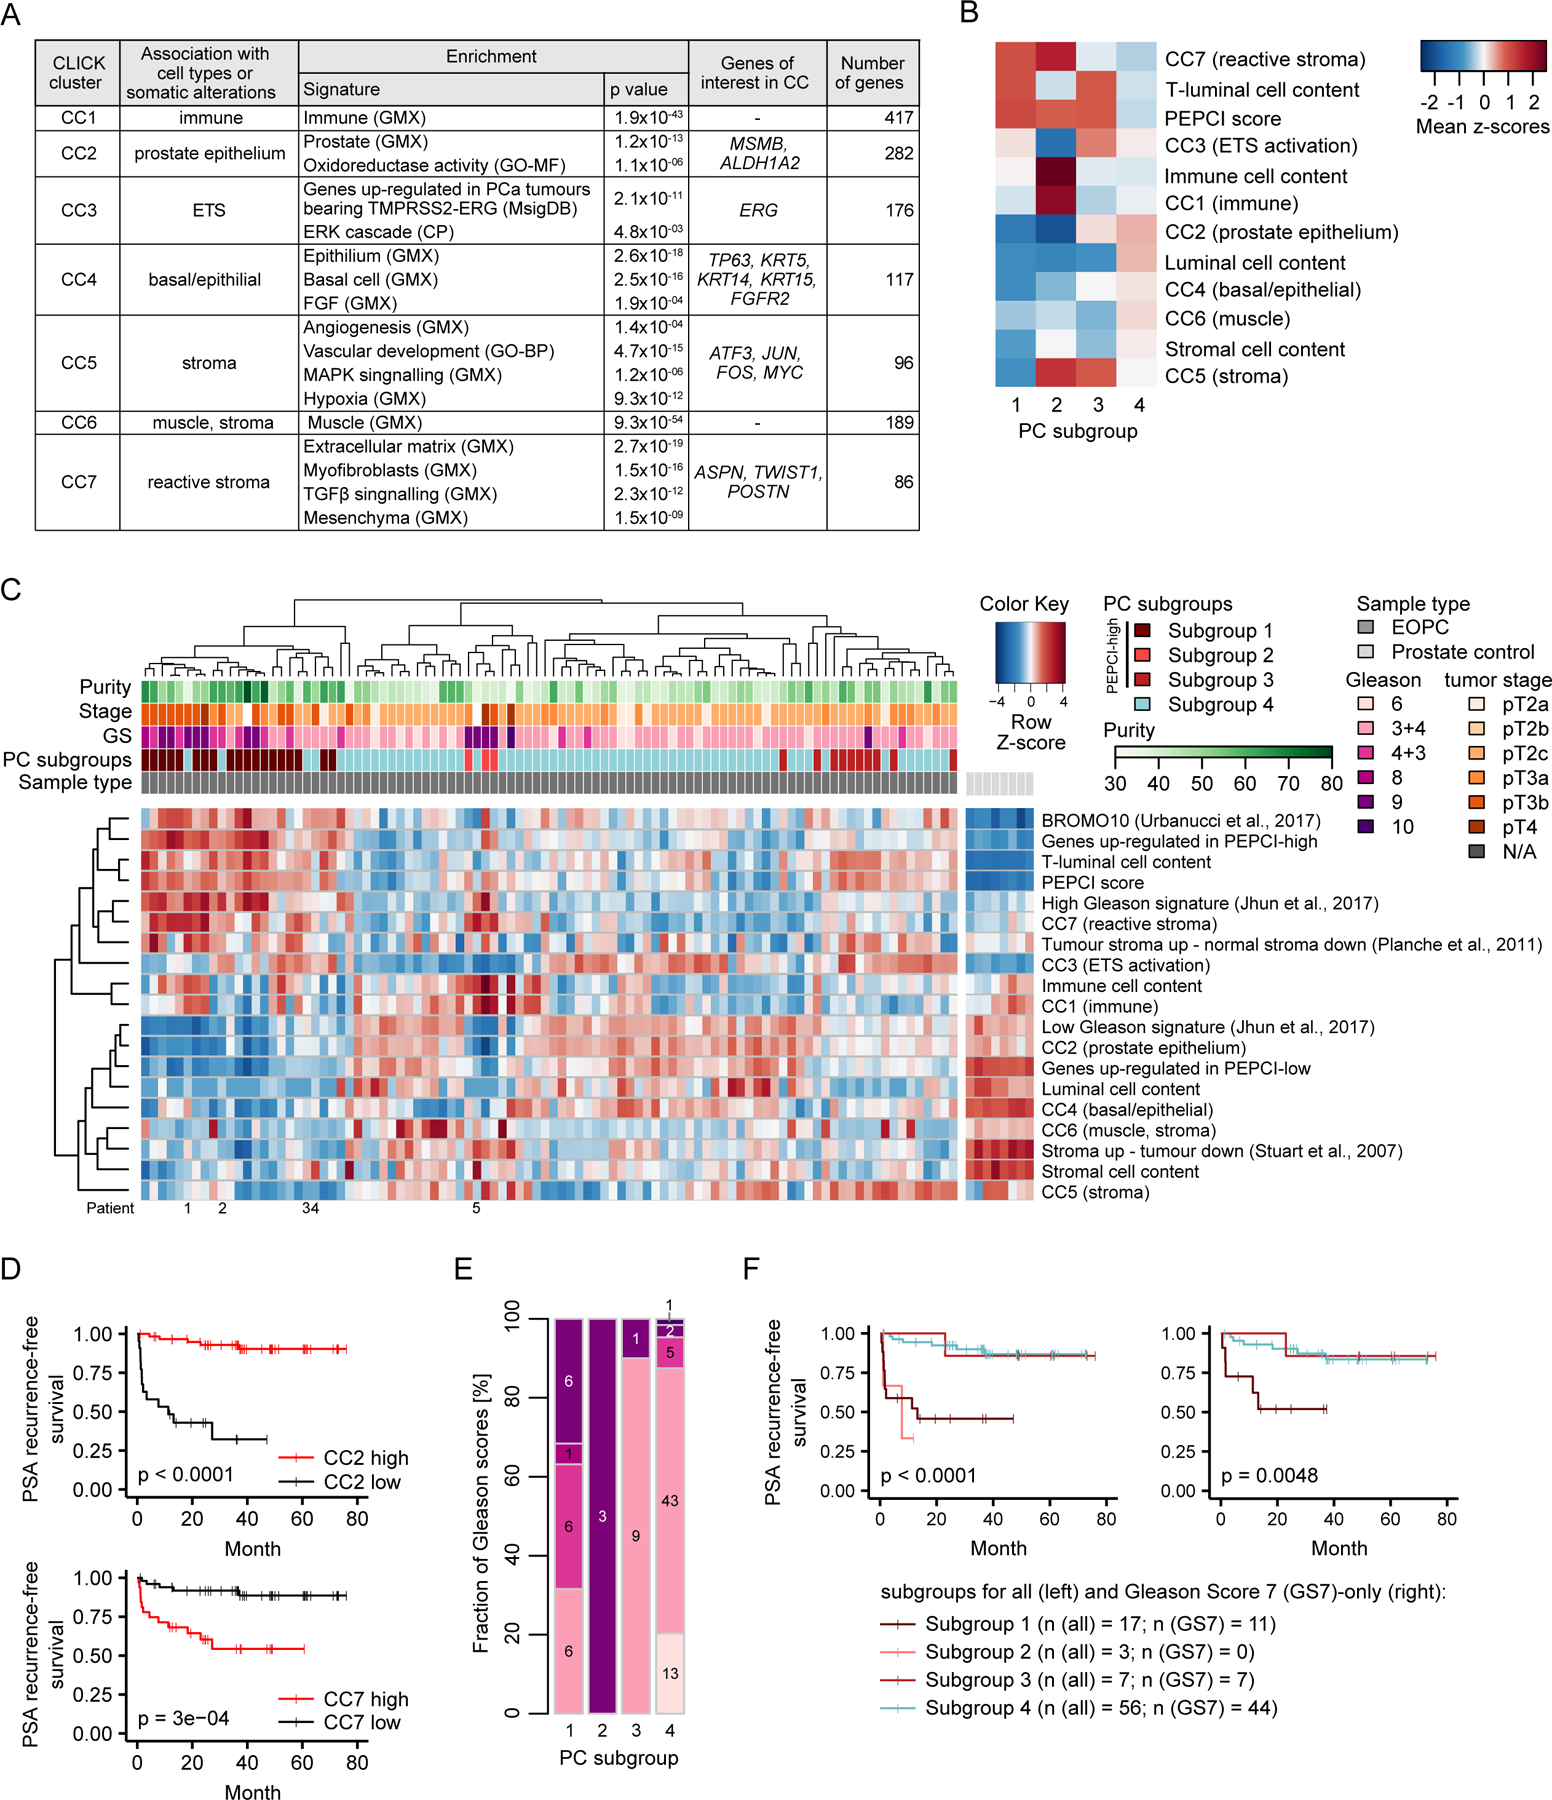
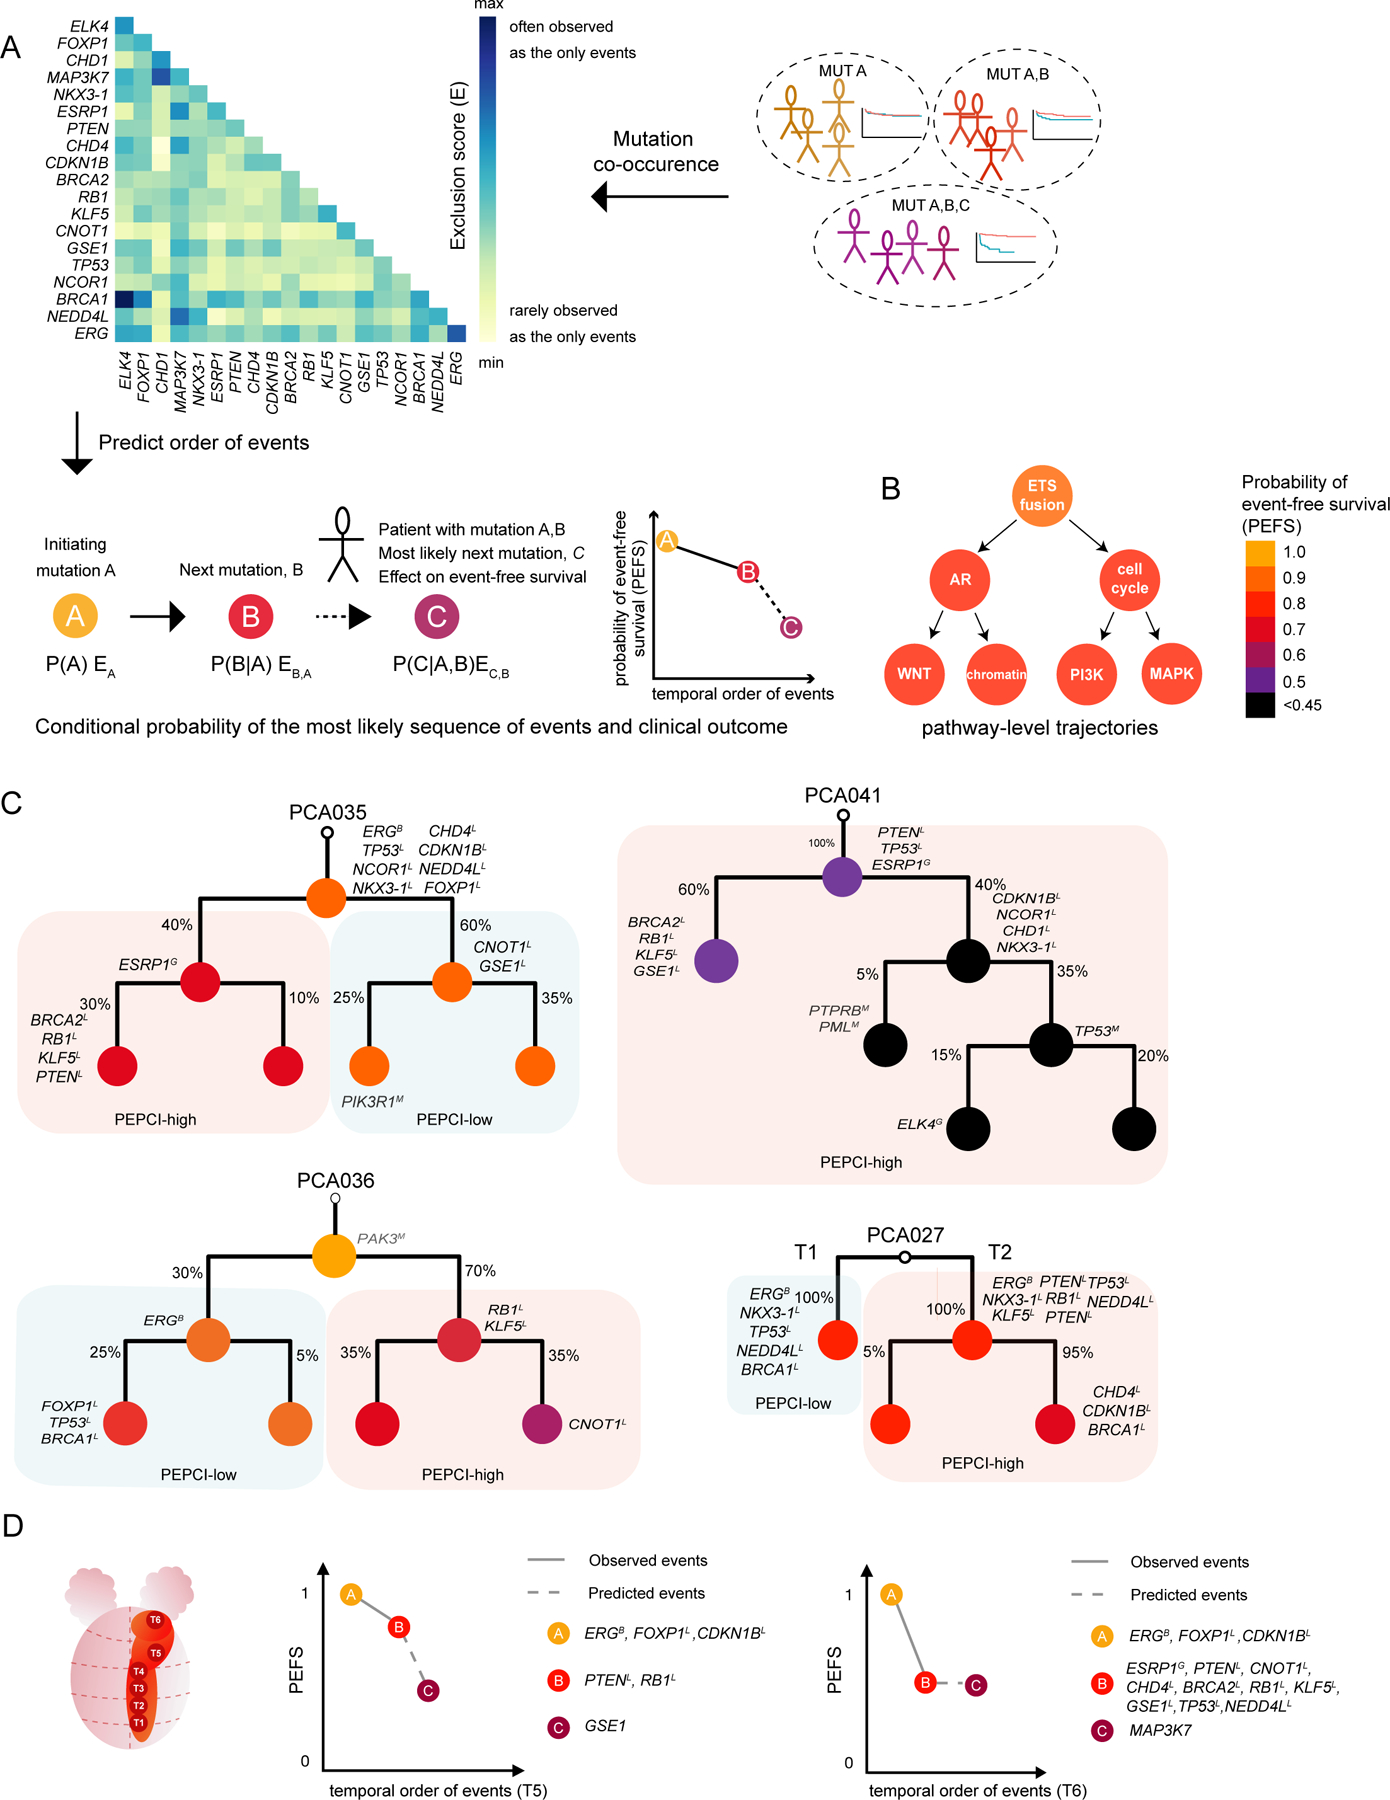
Identifying the earliest somatic changes in prostate cancer can give important insights into tumor evolution and aids in stratifying high- from low-risk disease. We integrated whole genome, transcriptome and methylome analysis of early-onset prostate cancers (diagnosis ≤55 years). Characterization across 292 prostate cancer genomes revealed age-related genomic alterations and a clock-like enzymatic-driven mutational process contributing to the earliest mutations in prostate cancer patients. Our integrative analysis identified four molecular subgroups, including a particularly aggressive subgroup with recurrent duplications associated with increased expression of ESRP1, which we validate in 12,000 tissue microarray tumors. Finally, we combined the patterns of molecular co-occurrence and risk-based subgroup information to deconvolve the molecular and clinical trajectories of prostate cancer from single patient samples.

Keywords: APOBEC; cancer genomics; early-onset cancer; epigenetic risk-score; mutational processes; prostate cancer; structural variants; tumor evolution; tumor evolution prediction.


Conflict of interest statement

Declaration of Interests

The authors declare no competing interests.

Figures

Figure 1.
Figure 1.. Somatic alteration landscape and age-at-diagnosis
(A) Genome-wide SV breakpoint recurrence pattern across 292 PC samples, color-coded separately for each chromosome. (B) An Oncoprint summarizing the mutational landscape of RGA regions in PC, color-coded by the mutational event-type and separate into EOPC and LOPC. The barplot at the left quantify the recurrence of each RGA in the PC cohort. The patient age and GS are shown at the bottom. (C) Fraction of EOPC and LOPC tumors from localized PC associated with either clonal or polyclonal paths (p = 0.18, Chi-square test). (D) Correlation between breakpoints and Hi-C chromatin loops (combined across eight cell lines) and PC-specific H3K27ac peaks in 1 Mbp bins, separated into localized EOPC and LOPC. (E) “Chromatin-state”-model of age-associated breakpoint patterns in PC. See also Figure S1 and Table S1.
Figure 2.
Figure 2.. Recurrent alterations target KLF5 and ESRP1
(A, B) SV recurrence plot at 13q22 (A) and 8q22 (B) with vertical red and blue lines represents genomic gain and loss, respectively (n tumor samples = 292). The smallest overlapping SV is shown in case of multiple SVs per tumor sample. (C) Number of somatic SVs from our total cohort of tumors according to presence (SV+) or absence (SV) of SVs affecting the KLF5 locus. MWU-based p value. (D) KLF5 gene expression of different methylation and somatic SV states with x-axis representing KLF5 promoter-proximal methylation status and somatic SV states. (E) Correlation between KLF5 and SPOP expression, with each dot representing a tumor, color-labeled with GS. (F) Boxplot of ESRP1 mRNA expression separated by tumors with an SV gain of ESRP1 (SV+) and without (SV). MWU-based p value. (G) ESRP1 protein expression stained in 11,954 TMA samples and scored as “negative” (dark blue), “weak” (light blue), “moderate” (yellow) or “strong” (red). (H) Barplot showing Ki67 labelling index separated by GS and ESRP1 staining. Number of tumors for each category is labelled below each bar. ***: p < 0.001, NS = not significant (a = 0.05). The colors of bars correspond to those in (G). (I) Kaplan-Meier plot, showing PSA-recurrence-free survival for patients stratified by ESRP1 staining intensity. Boxplots show median (line), upper and lower quartiles (boxes), and lines extending to 1.5 x IQR (whiskers). See also Figure S2 and Table S2.
Figure 3.
Figure 3.. Age-related mutational signatures in prostate cancer
(A) Barplot of the absolute (top) and relative (bottom) proportion of exposure of six mutational signatures (1, 5, 3, 6, 2 and 13, colored bars) per individual tumor of patients with localized PC, sorted by age-at-diagnosis (x-axis, range from 32 to 75 years). (B) Association between mutation signature burden (y-axis) and GS. POLR p values. Boxplots show median (line), upper and lower quartiles (boxes), and lines extending to 1.5 x IQR (whiskers). (C) Correlation between the mutation signature burden and age-at-diagnosis. (D) Fold-enrichment of APOBEC signature in scattered mutations (light grey), C/G clusters (orange) or non-coordinated clusters (dark grey). (E) Age-association between A3A (“ytCa” signature, left) or A3B (“rtCa” signature, right) in C/G clusters of mutations as a function of age (binomial logistic regression). Generalized linear model (GLM) logit p values. (F) Fraction of mutations close to SV breakpoint for C/G cluster mutations (orange, n = 1,694), non-coordinated cluster mutations (dark grey, n = 8,408) and non-clustered mutations (light-grey, 100 bootstraps of 456,406 SNVs, 95% confidence interval shown). X-axis displays log10 distance between SNV and breakpoint. See also Figure S3.
Figure 4.
Figure 4.. Predisposing germline mutations associate with specific somatic alteration landscapes
Association between individuals carrying germline PTV in the indicated cancer predisposition gene and total number of somatic SVs, total number of somatic SNVs, exposure to mutational signature 2 and mutational signature 3. X-axis represent patients, sorted in ascending order of the phenotype.
Figure 5.
Figure 5.. PEPCI, a methylation-based risk group score
(A) A schematic representation of methylation-based estimation of ct composition of each bulk tumor sample. (B) Stacked barplots of ct composition, tumor stage, GS and PEPCI per PC. (C) Association between PEPCI and GS (left) and pT (right). Boxplots show median (line), upper and lower quartiles (boxes), and lines extending to 1.5 x IQR (whiskers). (D) Kaplan-Meier curves of localized EOPC patients stratified according to PEPCI-high and PEPCI-low, for all cases (left) and for GS7 only (right). (E) Chord-diagram showing proportions of tumors with a specific RGA and the associated PEPCI-high and -low risk group, colored by each RGA. See also Figure S4 and Table S3.
Figure 6.
Figure 6.. Integrative expression and methylation analysis
(A) Summary of the most prominent characteristics of CCs. Sources of gene sets are indicated in the brackets: GMX, Genomatix curated gene sets; GO-MF and GO-BF, molecular and biological functions in gene ontology terms, respectively; CP, Genomatix canonical pathways. FDR-corrected p values < 0.05. (B) Heatmap of the four PC subgroups and their average ct compositions and CC mean pattern values. (C) Hierarchical clustering heatmap of ct content, CCs, three external gene signatures and indicated PC subgroups across 96 EOPC samples and eight normal prostate controls. CCs and external gene signatures are represented as mean pattern values. Clustering was based on PEPCI-related features and CC information (excluding CC6 due to low information content). Patient number 1 and 3: PEPCI score just below the Inflection point, #2 multi-area sample with varying PEPCI score, #4 and #5: high stromal content. (D) Kaplan-Meier curves between subgroups in CC2 and CC7 and event-free survival (log-rank test). (E) Stacked barplot of fraction of GS in the four PC subgroups. (F) Kaplan-Meier curves of the four PC subgroups using ICGC EOPC samples with available methylation and RNA-seq data (left, n= 83) and a subset of GS7 cases (right, n=62). See also Table S4 and Figures S5 and S6.
Figure 7.
Figure 7.. Molecular evolution of prostate cancer
(A) Outline of the PRESCIENT method. (B) RGAs were labelled with a molecular pathway, which was used as an event in PRESCIENT. (C) Molecular reconstruction of individual EOPC tumors, using a Bayesian mixture model with each node annotated with RGAs and event-free survival prediction (color-range). The clonal status is annotated with percentages at each branch. Mutations in COSMIC genes are annotated in grey for each node. Branches are labelled by background color based on PEPCI score for PEPCI-high and PEPCI-low. (D) A schematic representation of PCA035 (left) and application of PRESCIENT prediction to T5 (middle) and T6 (right) regions of the tumor. See also Figure S7.

Comment in

References

    1. 1000 Genomes Project Consortium, Auton A, Brooks LD, Durbin RM, Garrison EP, Kang HM, Korbel JO, Marchini JL, McCarthy S, McVean GA, et al. (2015). A global reference for human genetic variation. Nature 526, 68–74. - PMC - PubMed
    1. Alexandrov LB, Nik-Zainal S, Wedge DC, Aparicio SA, Behjati S, Biankin AV, Bignell GR, Bolli N, Borg A, Borresen-Dale AL, et al. (2013). Signatures of mutational processes in human cancer. Nature 500, 415–421. - PMC - PubMed
    1. Alexandrov LB, Jones PH, Wedge DC, Sale JE, Campbell PJ, Nik-Zainal S, and Stratton MR (2015). Clock-like mutational processes in human somatic cells. Nat. Genet. 47, 1402–1407. - PMC - PubMed
    1. Aran D, Sirota M, and Butte AJ (2015). Systematic pan-cancer analysis of tumour purity. Nat. Commun 6, 8971. - PMC - PubMed
    1. Aryee MJ, Liu W, Engelmann JC, Nuhn P, Gurel M, Haffner MC, Esopi D, Irizarry RA, Getzenberg RH, Nelson WG, et al. (2013). DNA methylation alterations exhibit intraindividual stability and interindividual heterogeneity in prostate cancer metastases. Sci. Transl. Med 5, 169ra10. - PMC - PubMed

Publication types