. 2018 Dec 11;2(23):3553-3565.
doi: 10.1182/bloodadvances.2018017137.

GATA2 deficiency and human hematopoietic development modeled using induced pluripotent stem cells

Affiliations

GATA2 deficiency and human hematopoietic development modeled using induced pluripotent stem cells

Moonjung Jung et al. Blood Adv. .

Abstract

GATA2 deficiency is an inherited or sporadic genetic disorder characterized by distinct cellular deficiency, bone marrow failure, various infections, lymphedema, pulmonary alveolar proteinosis, and predisposition to myeloid malignancies resulting from heterozygous loss-of-function mutations in the GATA2 gene. How heterozygous GATA2 mutations affect human hematopoietic development or cause characteristic cellular deficiency and eventual hypoplastic myelodysplastic syndrome or leukemia is not fully understood. We used induced pluripotent stem cells (iPSCs) to study hematopoietic development in the setting of GATA2 deficiency. We performed hematopoietic differentiation using iPSC derived from patients with GATA2 deficiency and examined their ability to commit to mesoderm, hemogenic endothelial precursors (HEPs), hematopoietic stem progenitor cells, and natural killer (NK) cells. Patient-derived iPSC, either derived from fibroblasts/marrow stromal cells or peripheral blood mononuclear cells, did not show significant defects in committing to mesoderm, HEP, hematopoietic stem progenitor, or NK cells. However, HEP derived from GATA2-mutant iPSC showed impaired maturation toward hematopoietic lineages. Hematopoietic differentiation was nearly abolished from homozygous GATA2 knockout (KO) iPSC lines and markedly reduced in heterozygous KO lines compared with isogenic controls. On the other hand, correction of the mutated GATA2 allele in patient-specific iPSC did not alter hematopoietic development consistently in our model. GATA2 deficiency usually manifests within the first decade of life. Newborn and infant hematopoiesis appears to be grossly intact; therefore, our iPSC model indeed may resemble the disease phenotype, suggesting that other genetic, epigenetic, or environmental factors may contribute to bone marrow failure in these patients following birth. However, heterogeneity of PSC-based models and limitations of in vitro differentiation protocol may limit the possibility to detect subtle cellular phenotypes.


Conflict of interest statement

Conflict-of-interest disclosure: The authors declare no competing financial interests.

Figures

None
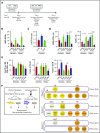
Graphical abstract
Figure 1.
Figure 1.
Hematopoietic differentiation of patient iPSC is grossly intact. (A) Hematopoietic differentiation scheme. Spin EB derived from iPSC underwent a multistep hematopoietic differentiation process (top). Mesodermal precursors were evaluated at day 4. HEP were assessed at day 9. At day 16 of hematopoietic differentiation, CD34+CD45+ cells were sorted for CFU assay and gene expression analysis. FB/MSC-ZF includes iPSC from subject 1 (GATA2 R361H) and subject 2 (GATA2 R337X). FB/MSC-Int5 includes iPSC from subject 3 (intron 5 proband). Patient PBMC-derived iPSC efficiency was compared with healthy volunteer PBMC-derived iPSC controls. PBMC-ZF includes 3 clones from subject 1 (R361H). PBMC-Int5F includes 3 clones from subject 3 (proband). PBMC-Int5M includes 3 clones from subject 4 (asymptomatic carrier). A minimum of 2 independent experiments were performed unless otherwise specified. (B) Percentage of mesodermal precursor cells on day 4 of differentiation. (FB/MSC-control: n = 10; ZF, n = 7; Int5, n = 3; PBMC-control: n = 4; ZF, n = 3; Int5, n = 6; Int5M, n = 3). One ZF2 clone (R337X-FB-1) and 3 Int5 clones among the FB/MSC-iPSC group and 3 R361H clones and 3 Int5M clones among the PBMC-iPSC group were tested in 1 experiment. (C) Fraction of HEP at day 9 derived from various control, ZF, or intron 5 GATA2-mutant iPSC (control: n = 10; ZF, n = 6; Int5, n = 3). Three Int5 clones were tested in 1 experiment. (D) Fraction of CD34+CD45+ cells and CD45+ cells at day 16 of hematopoietic differentiation (FB/MSC-control: n = 14; ZF, n = 11; Int5, n = 6; PBMC-control: n = 6; ZF, n = 3; Int5, n = 9; Int5M, n = 6). One ZF clone (R337X-FB-1) among the FB/MSC-iPSC group and 3 R361H clones among the PBMC-iPSC group were tested in 1 experiment. (E) Functional properties of iPSC-derived CD34+CD45+ cells as evaluated by CFU assay. The number and type of CFU colonies from 1000 sorted CD34+CD45+ cells were scored. Total number of colonies per 1000 sorted CD34+CD45+ (FB/MSC-control: n = 20; ZF, n = 10; Int5, n = 6; PBMC-control: n = 6, Int5F, n = 12; Int5M, n = 6). (F) Fraction of CFU subtype per total number of colonies, respective of mutation types. P values were determined by 1-way ANOVA followed by Dunnett multiple comparison test. Int5F and Int5M were compared independently by unpaired Student t test. *P < .05, **P < .01, and ***P < .005; ****P < .0001. (F) Targeted myeloid neoplasm panel next-generation sequencing was performed on patient’s primary cells (dermal fibroblasts, bone marrow stromal cells, or peripheral blood) and iPSC clones derived from those primary cells. *Two separate variants (supplemental Table 9). #GATA2 intronic variants were examined by Sanger sequencing because intronic regions were not covered in the targeted next-generation sequencing.
Figure 2.
Figure 2.
Reduced hematopoietic differentiation potential of GATA2-haploinsufficient isogenic iPSC. (A) Exon 6 of the GATA2 gene was targeted to generate knockout isogenic cell lines. (B) Structure of the wild-type GATA2/DNA complex modeled from the corresponding GATA3 structure: sequence RNA targeted for deletion by CRISPR (yellow); the 38-aa long C terminus sequence (red) is truncated and modified because of a premature stop codon; the resulting 13-aa segment has unknown, albeit predictable, conformation in solution; DNA molecule (blue), Zn ions (white), and unmodified GATA2 sequence (green). (C) Isogenic iPSC lines were differentiated into hematopoietic lineage as described previously. Fraction of CD34+CD45+ cells and the number and type of CFU were examined from independent GATA2 knockout isogenic lines and the 2 corrected patient-specific iPSC lines shown. A minimum of 2 independent experiments was performed. Fraction of CD34+CD45+ cells was grouped per cell line and GATA2 status. (Left: n = 4, 4, 4, 4, 4, 4, 4, 4, 3, 2, and 2, respectively; right: n = 8, 8, 8, 5, and 5, respectively). (D) Total number of colonies from 1000 sorted CD34+CD45+ cells per cell line and GATA2 status. (Left: n = 4, 4, 2, 2, 2, 2, 4, 4, 4, 2, and 2, respectively; right: n = 6, 6, 4, 6, and 6, respectively). (E) Fraction of CFU subtype per total number of colonies, respective of mutation types (GATA2+/+, n = 10; GATA2+/−, n = 10). Paired Student t test was performed to compare the effect of GATA2 gene status with its isogenic cell line. *P < .05; **P < .01. Nonsignificant P values are not shown.
Figure 3.
Figure 3.
Hematopoietic potential of HEP from patient-specific iPSC may be reduced. (A) Experimental scheme. HEP (VE-Cad+CD73CD43CD235a cells) were isolated by FACS on day 9 and cultured for additional 5 days on OP-9 mouse bone marrow stromal cells with addition of cytokines for 5 days, at which time hematopoietic potential was assessed by measuring CD43+ and CD45+ cells by flow cytometry. (B) Hematopoietic potential (%CD43+ and/or CD45+ cells) of HEP after 5 days of OP-9 coculture is shown. Minimum of 2 independent experiments were performed except for 3 Int5F clones that were differentiated in 1 experiment (control, n = 8; ZF, n = 6; Int5F, n = 3; P = nonsignificant (NS), unpaired Student t test was performed between control and ZF or control and Int5F). NS P values are not shown.
Figure 4.
Figure 4.
GATA2-deficient HSPCs derived from iPSC can commit to NK lineage differentiation. (A) NK cell output, defined as live CD45+CD3CD56+ cells, upon 3 weeks of NK-specific differentiation. A minimum of 2 independent experiments were performed (control, n = 6; ZF, n = 8; Int5, n = 6; P = NS by ANOVA). (B) Percent NK output and absolute number of NK cells differentiated from isogenic lines. The experiment was performed once.
Figure 5.
Figure 5.
Single-cell RNA-seq of sorted CD34+CD45+cells from GATA2 WT vs GATA2+/−iPSC reveal subtle differences in lineage commitment and gene expression profiles of GATA2 target genes. Imputed cell type classification for single-cell RNA-seq data from healthy volunteer pair (WT vs GATA2+/−) (A) and GATA2 R337X pair (patient mutant vs corrected) (B). The gene expression data have been dimensionally reduced via Uniform Manifold Approximation and Projection. (C) Pseudotemporally ordered cells derived from iPSC of healthy volunteer. Cells are colored by cell type. The center of each subplot represents the branch point between the myeloid and lymphoid lineages; myeloid lineages move to the right as they mature and lymphoid lineages move to the left. (D) Pseudotemporal ordering of cells derived from GATA2 WT iPSC are colored in blue; those from GATA2+/− iPSC are colored in red. (E) Pseudotemporally ordered cells derived from iPSC of GATA2 R337X pair. (F) Pseudotemporal ordering of cells derived from a corrected clone of GATA2 R337X iPSC are colored in blue; those from GATA2 R337X iPSC are colored in red. (G) Fraction of each cell type per GATA2 status. (H) Volcano plot of differentially expressed genes depending on GATA2 status. The 2 dotted vertical lines indicate log2-fold change; 2 dotted horizontal lines indicate P < .05. Ba-Prog, basophil progenitor; DC-Prog, dendritic cell progenitor; Eo-Prog, eosinophil progenitor; Er-Pro, erythroid progenitor; Lymph-Prog, lymphoid progenitor; Mk-Er-Prog, megakaryocyte-erythrocyte progenitor; Mk-Prog, megakaryocyte progenitor; Mo-Prog, monocyte progenitor; MPP, multipotent progenitor; Neu-Prog, neutrophil progenitor.

References

    1. Vinh DC, Patel SY, Uzel G, et al. . Autosomal dominant and sporadic monocytopenia with susceptibility to mycobacteria, fungi, papillomaviruses, and myelodysplasia. Blood. 2010;115(8):1519-1529. - PMC - PubMed
    1. Hsu AP, Sampaio EP, Khan J, et al. . Mutations in GATA2 are associated with the autosomal dominant and sporadic monocytopenia and mycobacterial infection (MonoMAC) syndrome. Blood. 2011;118(10):2653-2655. - PMC - PubMed
    1. Bigley V, Haniffa M, Doulatov S, et al. . The human syndrome of dendritic cell, monocyte, B and NK lymphoid deficiency. J Exp Med. 2011;208(2):227-234. - PMC - PubMed
    1. Dickinson RE, Griffin H, Bigley V, et al. . Exome sequencing identifies GATA-2 mutation as the cause of dendritic cell, monocyte, B and NK lymphoid deficiency. Blood. 2011;118(10):2656-2658. - PMC - PubMed
    1. Spinner MA, Sanchez LA, Hsu AP, et al. . GATA2 deficiency: a protean disorder of hematopoiesis, lymphatics, and immunity. Blood. 2014;123(6):809-821. - PMC - PubMed

Publication types

MeSH terms