Tamoxifen mechanically reprograms the tumor microenvironment via HIF-1A and reduces cancer cell survival
- PMID: 30538116
- PMCID: PMC6322388
- DOI: 10.15252/embr.201846557
Tamoxifen mechanically reprograms the tumor microenvironment via HIF-1A and reduces cancer cell survival
Abstract
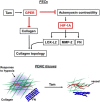
The tumor microenvironment is fundamental to cancer progression, and the influence of its mechanical properties is increasingly being appreciated. Tamoxifen has been used for many years to treat estrogen-positive breast cancer. Here we report that tamoxifen regulates the level and activity of collagen cross-linking and degradative enzymes, and hence the organization of the extracellular matrix, via a mechanism involving both the G protein-coupled estrogen receptor (GPER) and hypoxia-inducible factor-1 alpha (HIF-1A). We show that tamoxifen reduces HIF-1A levels by suppressing myosin-dependent contractility and matrix stiffness mechanosensing. Tamoxifen also downregulates hypoxia-regulated genes and increases vascularization in PDAC tissues. Our findings implicate the GPER/HIF-1A axis as a master regulator of peri-tumoral stromal remodeling and the fibrovascular tumor microenvironment and offer a paradigm shift for tamoxifen from a well-established drug in breast cancer hormonal therapy to an alternative candidate for stromal targeting strategies in PDAC and possibly other cancers.
Keywords: GPER; HIF‐1A; tamoxifen; tumor microenvironment.
© 2018 The Authors. Published under the terms of the CC BY 4.0 license.
Figures

- A
In total, 110 proteins show statistically significant (P < 0.05) changes, of which 45 are upregulated (by 50%; red) and 30 downregulated (by 50%; blue).
- B, C
Enriched (P < 0.05) Gene Ontology Biological Processes (GO‐BP) for proteins upregulated (B) and downregulated (C) by the tamoxifen treatment.

Killing curve for tamoxifen doses.
Quantification of cell counting percent relative to time 0—PSCs proliferation.

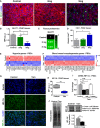
- A
Immunofluorescence images of PDAC tissues from KPC mice treated with vehicle control of tamoxifen, scale bar 100 μm.
- B–D
(B, D) Quantification of GLUT1 (hypoxia marker) and CD31 (endothelial cell marker). Control (n = 5), 2 mg (n = 5), and 5 mg (n = 4). In all cases, bars represent mean ± SEM. (C) Relative values of protein levels for Glut1 in PDAC tumors assessed by proteomic analysis (6 mice for control and 2 mg and 3 mice for 5 mg, and samples were analyzed in duplicates).
- E, F
Expression levels of DEGs relevant to response to hypoxia (left) and blood vessel morphogenesis (right). The values were normalized by tubulin family genes.
- G
Immunofluorescence images of PDAC tissues from KPC mice treated with vehicle control and 5 mg of tamoxifen, scale bar 100 μm.
- H
Quantification of HIF‐1A in PDAC tissues. Control (n = 5) and 5 mg (n = 4). In the box‐and‐whisker plot, the central box represents values from the lower to upper quartile. The middle line represents the mean. The vertical line extends from the minimum to the maximum value.
- I
qPCR levels of HIF‐1A in PSCs, normalized to RPLP0 and relative to control.
- J
Western blot bands for protein expression in PSCs (p‐Tmod is post‐translational modification). The plot shows the quantification of the sum of band intensities corresponding to isoform 1, isoform 2, isoform 3, and post‐transcriptionally modified HIF‐1A (n = 8 control and n = 8 tam).
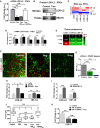
qPCR levels of LOX‐L2 in PSCs, normalized to RPLP0 and relative to control.
Western blot levels of LOX‐L2 in PSCs (n = 3 experimental replicates).
Expression of LOX family genes obtained from RNA‐seq data in control and tamoxifen‐treated PSCs (n = 3 experimental replicates). Expression value was normalized by tubulin family genes. Asterisk means significant differences (P < 0.05). Mann‐Whitney U‐test.
qPCR levels of LOX family in PSCs, normalized to RPLP0 and relative to control.
Relative values of protein levels for LOX members in PDAC tumors assessed by proteomic analysis (6 mice for control and 2 mg and 3 mice for 5 mg, and samples were analyzed in duplicates).
Immunofluorescence images of PDAC tissues from KPC mice treated with vehicle (control), and 2 mg and 5 mg of tamoxifen, scale bar 50 μm.
Quantification of LOX‐L2 for images in (F). n = 5 (control), 4 (2 mg), and 3 (5 mg), and n > 10 sections per animal.
qPCR levels of LOX‐L2 and HIF‐1A in PSCs, normalized to RPLP0 and relative to 1 kPa.
qPCR levels of LOX‐L2 and HIF‐1A in PSCs, normalized to RPLP0 and relative to control.
Quantification of average forces applied by PSCs on pillars. BBI = blebbistatin. In the box‐and‐whisker plot, the central box represents values from the lower and upper quartile. The middle line represents the mean. The vertical line extends from the minimum to the maximum. Three experimental repeats.
qPCR levels of LOX‐L2 in PSCs, normalized to RPLP0 (60S acidic ribosomal protein P0) and relative to control.

- A
Images of Matrigel collagen gels previously remodeled by PSCs, second harmonic generation signal for fibrillar collagen (green) and F‐actin (red), scale bar 100 μm.
- B
Fiber thickness color‐code map in a represented through the BoneJ plugin where larger spheres fit along fibers represent greater thickness, scale bar 100 μm.
- C
SHG fibrillar collagen images used for calculation of alignment through the FFT algorithm. Insets show FFTs of fibrillar collagen‐I images, representing alignment with respect to the elliptical distribution of the FFT central maxima. Circular behavior (values approaching 1) represents no aligned orientation and lower values represent fiber orientation as alignment is displayed as a power distribution orthogonal to the orientation direction. Scale bar 20 μm.
- D–F
Quantification of fiber thickness, length, and alignment for images in (A–C).
- G
Quantification of collagen fiber thickness using the BoneJ algorithm for images in (B and H).
- H
Representative images of Matrigel collagen gels previously remodeled by PSCs, second harmonic generation signal for fibrillar collagen (green) and F‐actin (red), scale bar 100 μm.
- A
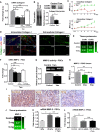
qPCR levels of collagen in PSCs, normalized to RPLP0 and relative to control.
- B
Western blot analysis of collagen normalized to total protein and relative to control.
- C
Quantification of time‐lapse collagen synthesis and deposition by PSCs.
- D
Representative immunofluorescent images used for the quantification in (C), scale bar 20 μm, collagen‐I was assessed with a specific primary antibody staining.
- E
Relative values of protein levels for collagen in PDAC tumors assessed by proteomic analysis (6 mice for control and 2 mg and 3 mice for 5 mg, and samples were analyzed in duplicates).
- F
qPCR levels of MMP‐2 in PSCs, normalized to RPLP0 and relative to control.
- G
MMP‐2 activity on control and tamoxifen‐treated PSCs assayed by gelatin zymography; above signal intensity of the representative bands used for the quantification presented in the plot below.
- H, I
Immunohistochemistry images and quantification of MMP‐2 levels in PDAC tissues from KPC mice treated with vehicle (control), and 2 and 5 mg of tamoxifen, scale bar 100 μm (n = 5 (control), 4 (2 mg), and 3 (5 mg) and n ≥ 5 sections per animal).
- J
Relative values of protein levels for MMP‐2 in PDAC tumors assessed by proteomic analysis (6 mice for control and 2 mg and 3 mice for 5 mg, and samples were analyzed in duplicates).
- K
qPCR levels of MMP‐2 in PSCs, normalized to RPLP0 and relative to 1 kPa.
- L
qPCR levels of MMP‐2 in PSCs, normalized to RPLP0 and relative to control.

- A
qPCR levels of fibronectin (FN), fibronectin extracellular domain A (FN‐EDA), and fibronectin extracellular domain B (FN‐EDB) in PSCs, normalized to RPLP0 and relative to control.
- B
Western blot analysis of FN normalized to total protein and relative to control.
- C
Quantification of fibronectin intensity density of images presented in (D).
- D
FN fluorescence and SHG collagen images for matrigel collagen gels remodeled by PSCs.
- E
Immunohistochemistry images of PDAC tissues from KPC mice treated with vehicle control, and 2 mg, and 5 mg of tamoxifen (n = 5 (control), 4 (2 mg), and 3 (5 mg), and n ≥ 5 sections per animal).
- F
FN fiber thickness color‐code map in (E) represented through the BoneJ plugin.
- G
Relative values of protein levels for FN in PDAC tumors assessed by proteomic analysis.
- H–J
Quantification of fibronectin immunohistochemistry staining, fiber thickness, and alignment scored of images presented in (E).
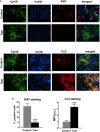
Immunofluorescence images of PDAC tissues from KPC mice treated with vehicle control, and 2 mg of tamoxifen, scale bar is 100 μm. Upper panels: Ki67 staining is used as a surrogate of proliferation. White arrows indicate Ki67‐positive nuclei in epithelial cells. Lower panels: Cc3 staining shows the cells undergoing caspase‐3‐mediated apoptosis. Tamoxifen panels show higher levels of yellow staining, which indicates higher percentage of apoptotic epithelial cells.
Quantification of staining in panel (A) (n = 4 animals per condition, and n ≥ 5 sections per animal, two experimental repetitions). Histogram bars represent mean ± SEM; ***P < 0.001, t‐test.

- A–F
(A, E, F) Immunofluorescence images of control and tamoxifen‐treated Suit2‐007 cells, scale bars is 20 μm. Panel (A) represents HIF‐1A staining in hypoxia and non‐hypoxia conditions, panels (E and F) show Ki67 and Cc3 staining as markers of proliferation and caspase‐mediated apoptosis, respectively. Panel (E): red—F‐actin, green—Ki67, blue—nuclei. Tamoxifen negatively regulates HIF‐1A in hypoxia and non‐hypoxia conditions. (B, C, D) Quantification of immunofluorescence staining in panels (A, E, F). For quantification, eight fields of view (n > 50 cells) per condition. Histogram bars represent mean ± SEM; **P < 0.01, ***P < 0.001, t‐test. All panels include data collected during 3 independent experiments.
Comment in
-
Tamoxifen calms down the distressed PDAC stroma.EMBO Rep. 2019 Jan;20(1):e47334. doi: 10.15252/embr.201847334. Epub 2018 Dec 11. EMBO Rep. 2019. PMID: 30538119 Free PMC article.
-
Inhibiting Tumor Fibrosis and Actomyosin through GPCR activation.Trends Cancer. 2019 Apr;5(4):197-199. doi: 10.1016/j.trecan.2019.02.005. Epub 2019 Feb 23. Trends Cancer. 2019. PMID: 30961827
References
-
- Ozdemir BC, Pentcheva‐Hoang T, Carstens JL, Zheng X, Wu CC, Simpson TR, Laklai H, Sugimoto H, Kahlert C, Novitskiy SV et al (2014) Depletion of carcinoma‐associated fibroblasts and fibrosis induces immunosuppression and accelerates pancreas cancer with reduced survival. Cancer Cell 25: 719–734 - PMC - PubMed
Publication types
MeSH terms
Substances
Grants and funding
LinkOut - more resources
Full Text Sources
Molecular Biology Databases
Research Materials

