. 2019 Feb 1;79(3):546-556.
doi: 10.1158/0008-5472.CAN-18-1492. Epub 2018 Dec 11.

Differential Subcellular Localization Regulates Oncogenic Signaling by ROS1 Kinase Fusion Proteins

Affiliations

Differential Subcellular Localization Regulates Oncogenic Signaling by ROS1 Kinase Fusion Proteins

Dana S Neel et al. Cancer Res. .

Abstract

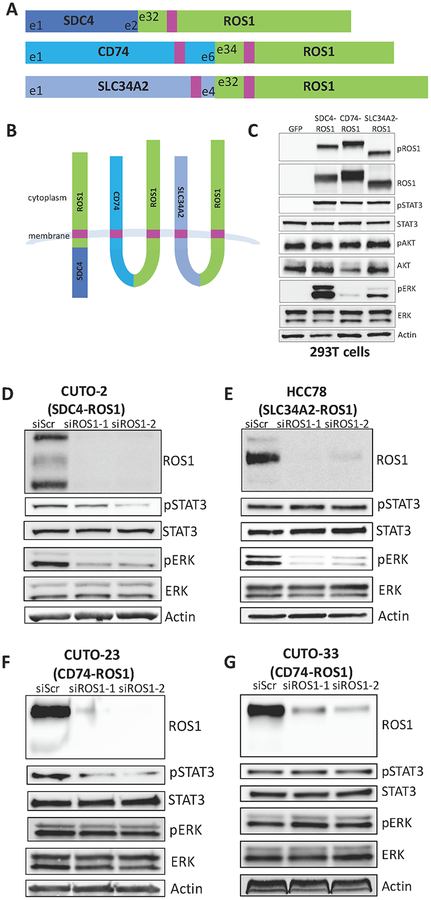
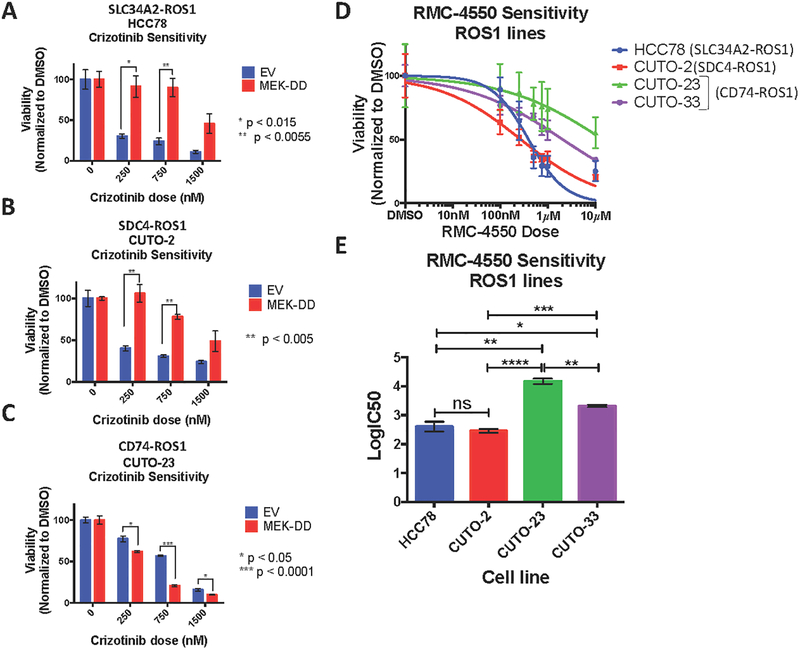
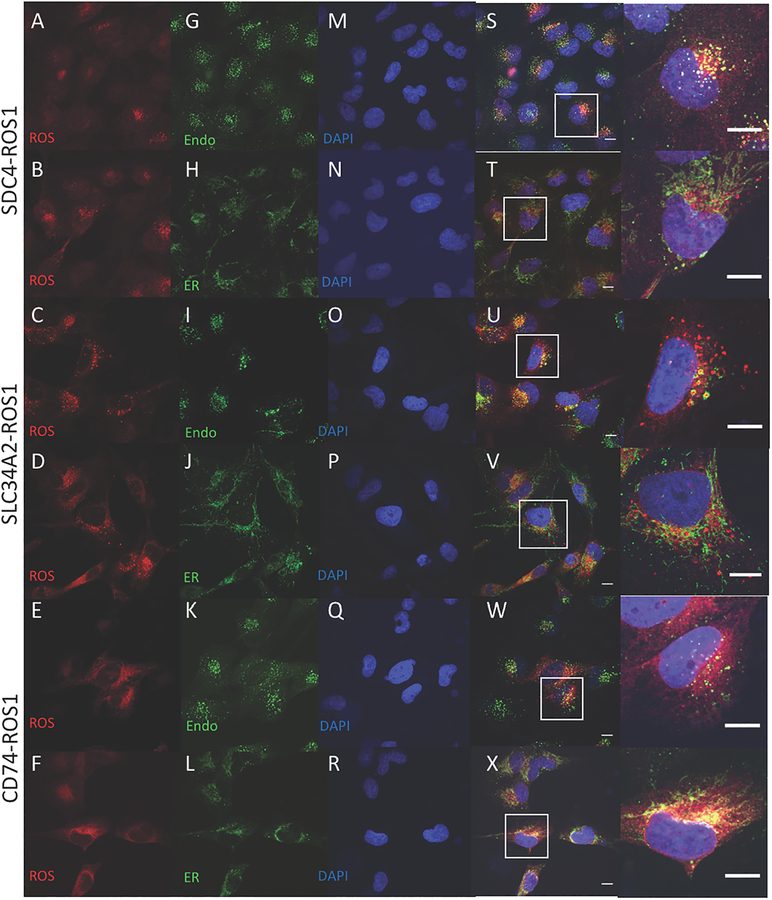
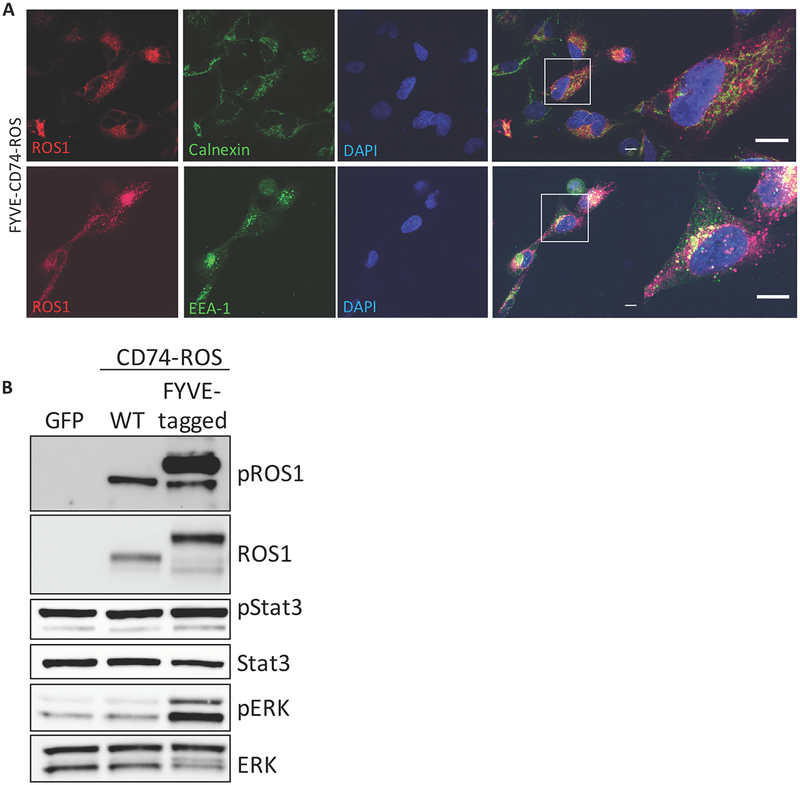
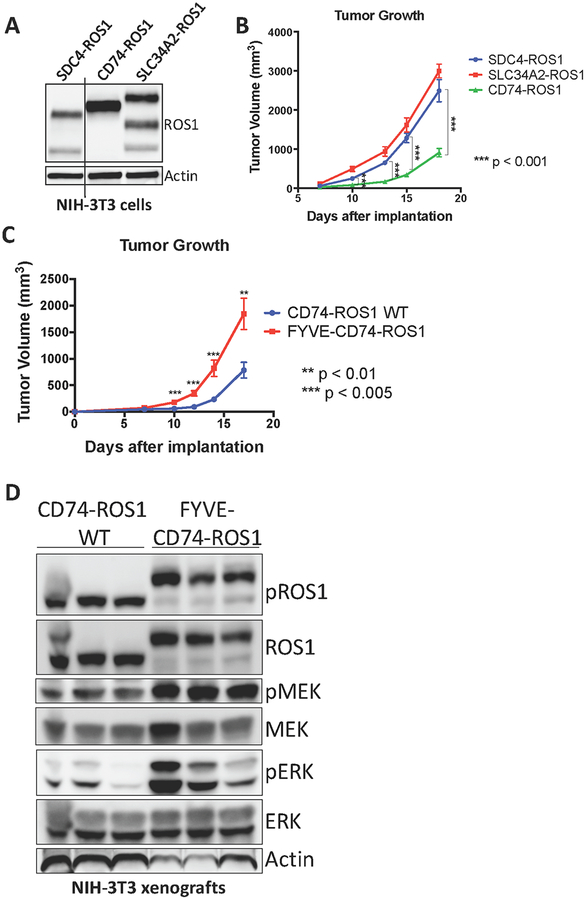
Chromosomal rearrangements involving receptor tyrosine kinases (RTK) are a clinically relevant oncogenic mechanism in human cancers. These chimeric oncoproteins often contain the C-terminal kinase domain of the RTK joined in cis to various N-terminal, nonkinase fusion partners. The functional role of the N-terminal fusion partner in RTK fusion oncoproteins is poorly understood. Here, we show that distinct N-terminal fusion partners drive differential subcellular localization, which imparts distinct cell signaling and oncogenic properties of different, clinically relevant ROS1 RTK fusion oncoproteins. SDC4-ROS1 and SLC34A2-ROS1 fusion oncoproteins resided on endosomes and activated the MAPK pathway. CD74-ROS1 variants that localized instead to the endoplasmic reticulum (ER) showed compromised activation of MAPK. Forced relocalization of CD74-ROS1 from the ER to endosomes restored MAPK signaling. ROS1 fusion oncoproteins that better activate MAPK formed more aggressive tumors. Thus, differential subcellular localization controlled by the N-terminal fusion partner regulates the oncogenic mechanisms and output of certain RTK fusion oncoproteins. SIGNIFICANCE: ROS1 fusion oncoproteins exhibit differential activation of MAPK signaling according to subcellular localization, with ROS1 fusions localized to endosomes, the strongest activators of MAPK signaling.


Conflict of interest statement

Potential competing interests: Trever G. Bivona has received a research grant and is a member of the SAB of Revolution Medicines. Robert Nichols is an employee of Revolution Medicines. The other authors declare no competing interests.

Figures

Figure 1.
Figure 1.. ROS1 fusion partners dictate differential activation of downstream signaling pathways.
(A) Diagram of the commonly occurring ROS1 fusion oncoproteins, which were studied here. Pink denotes a transmembrane domain. (B) Topological configuration of ROS1 fusions based on CCTOP computational analysis (28). (C) Immunoblot analysis of 293T cells transiently transfected for 48h with GFP, SDC4-ROS1, CD74-ROS1, or SLC34A2-ROS1, with 5h serum starvation. The pROS1 antibody used recognizes Y2274 of the full-length ROS1 protein. (D-G) Immunoblot analysis of patient-derived cell lines expressing (D) SDC4-ROS1, (E) SLC34A2-ROS1, or (F-G) CD74-ROS1 with siRNA-mediated knockdown of ROS1 (55h after transfection). Data shown in (C-G) are representative of ≥ 3 independent experiments.
Figure 2.
Figure 2.. MAPK pathway signaling is necessary and sufficient for survival of SDC4-ROS1-positive and SLC34A2-ROS1-positive lines, but not a CD74-ROS1 positive line.
(A-C) Crystal violet quantification of ROS1 fusion-positive patient-derived cell lines (A) HCC78, (B) CUTO-2 and (C) CUTO-23, expressing empty vector or constitutively active MEK-DD, treated with DMSO or a dose-response of the ROS1 inhibitor crizotinib for 6 days. (D) Crystal violet quantification of HCC78 (SLC34A2-ROS1), CUTO-2 (SDC4-ROS1), CUTO-23 (CD74-ROS1), and CUTO-33 (CD74-ROS1) cell lines treated with DMSO or a dose-response of the SHP2 inhibitor RMC-4550 for 6 days. (E) Half-maximal inhibitory concentration (IC50) determination for the SHP2 inhibitor RMC-4550 in the indicated ROS1 patient-derived cell lines based on crystal violet quantification of the experiment in (D). Data represent three independent experiments. Data represented as mean +/− s.e.m.
Figure 3.
Figure 3.. Localization of ROS1 protein in isogenic BEAS-2B system reveals different subcellular localization of the ROS1 fusion oncoproteins.
Immunofluorescence and confocal microscopy in BEAS-2B cells stably expressing SDC4-ROS1, SLC34A2-ROS1, and CD74-ROS1. Rows 1,2 = SDC4-ROS1; Rows 3,4 = SLC34A2-ROS1; Rows 5,6 = CD74-ROS1. Antibodies used were specific for: (A-F) = ROS1; (G,I,K) = EEA1; (H,J,L) = Calnexin; and (M-R) = DAPI; (S-X) = overlay image of the left 3 columns, with (right-most column) adjacent high magnification image of representative cells (outlined by white boxes). Scale bars shown indicate 10μM. Images are representative of ≥ 10 fields and at least 2 biological replicate experiments.
Figure 4.
Figure 4.. Localization of ROS1 oncoproteins regulates engagement of downstream signaling pathways.
(A) Immunofluorescence and confocal microscopy of BEAS2-B cells stably expressing an endosome-targeted FYVE-tagged CD74-ROS1 construct and stained with the indicated antibodies. Far right panel = increased magnification of a representative individual cell. Confocal images are representative of ≥ 10 fields and at least 2 independent experiments. Scale bars shown indicate 10μM. (B) Immunoblot analysis of BEAS2-B cells transfected with GFP, WT CD74-ROS1, or FYVE-CD74-ROS1. Immunoblot is representative of 3 independent experiments.
Figure 5.
Figure 5.. MAPK pathway activation in ROS1 fusion oncoprotein-driven cancer models is linked to increased tumorigenic properties in vivo.
(A) Immunoblot analysis of ROS1 fusion oncoprotein expression in isogenic NIH-3T3 cells. (B) Tumor growth rates of tumor xenografts of 1×10⁶ NIH-3T3 ROS1 fusion oncoprotein-expressing cells described in (A) implanted into the flanks of immunocompromised mice. (C) Tumor growth rates of tumor xenografts of 5×10⁵ cells NIH-3T3 cells expressing CD74-ROS1 WT or FYVE-tagged CD74-ROS1. (D) Immunoblot analysis of NIH-3T3 tumor xenograft explants expressing wild-type (WT) or FYVE-tagged CD74-ROS1. Each lane represents an individual tumor. Data in (B-C) are shown as the mean of 6 tumors +/− s.e.m.

References

    1. Lynch TJ, Bell DW, Sordella R, Gurubhagavatula S, Okimoto RA, Brannigan BW, et al. Activating mutations in the epidermal growth factor receptor underlying responsiveness of non-small-cell lung cancer to gefitinib. N Engl J Med. Massachusetts Medical Society; 2004;350:2129–39. - PubMed
    1. Pao W, Hutchinson KE. Chipping away at the lung cancer genome. Nat Med. Nature Publishing Group; 2012;18:349–51. - PubMed
    1. Li C, Sun Y, Fang R, Han X, Luo X, Wang R, et al. Lung adenocarcinomas with HER2-activating mutations are associated with distinct clinical features and HER2/EGFR copy number gains. J Thorac Oncol. 2012;7:85–9. - PubMed
    1. Stephens P, Hunter C, Bignell G, Edkins S, Davies H, Teague J, et al. Lung cancer: intragenic ERBB2 kinase mutations in tumours. Nature. Nature Publishing Group; 2004;431:525–6. - PubMed
    1. Takeuchi K, Choi YL, Togashi Y, Soda M, Hatano S, Inamura K, et al. KIF5B-ALK, a novel fusion oncokinase identified by an immunohistochemistry-based diagnostic system for ALK-positive lung cancer. Clin Cancer Res. 2009;15:3143–9. - PubMed

Publication types

MeSH terms