. 2018 Dec 11;9(1):5147.
doi: 10.1038/s41467-018-07557-4.

Degrading permafrost puts Arctic infrastructure at risk by mid-century

Affiliations

Degrading permafrost puts Arctic infrastructure at risk by mid-century

Jan Hjort et al. Nat Commun. .

Abstract

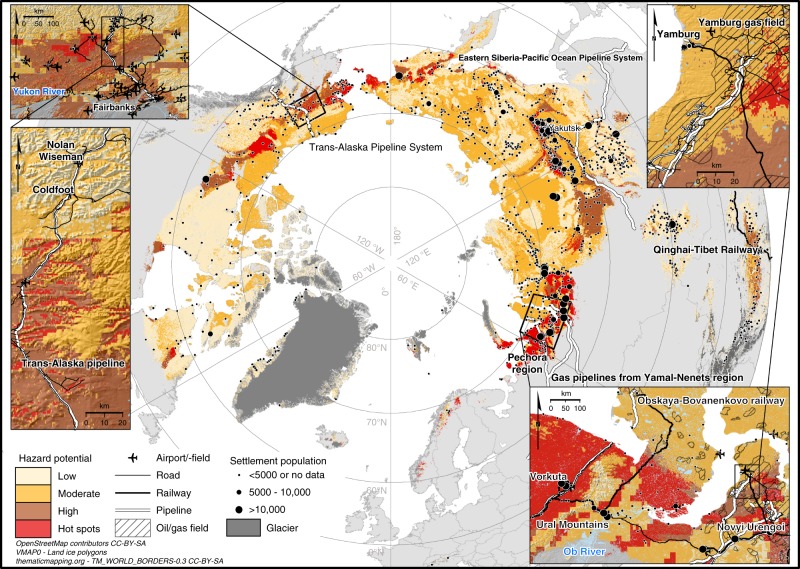
Degradation of near-surface permafrost can pose a serious threat to the utilization of natural resources, and to the sustainable development of Arctic communities. Here we identify at unprecedentedly high spatial resolution infrastructure hazard areas in the Northern Hemisphere's permafrost regions under projected climatic changes and quantify fundamental engineering structures at risk by 2050. We show that nearly four million people and 70% of current infrastructure in the permafrost domain are in areas with high potential for thaw of near-surface permafrost. Our results demonstrate that one-third of pan-Arctic infrastructure and 45% of the hydrocarbon extraction fields in the Russian Arctic are in regions where thaw-related ground instability can cause severe damage to the built environment. Alarmingly, these figures are not reduced substantially even if the climate change targets of the Paris Agreement are reached.


Conflict of interest statement

The authors declare no competing interests.

Figures

Fig. 1
Fig. 1
Distribution of permafrost in the baseline (2000–2014) and future (Representative Concentration Pathway 4.5 2041–2060) climates. Note that the baseline extent of permafrost (blue) includes future distribution (greenish). The location and observed mean annual ground temperature (MAGT) of the data points (boreholes) are shown with coloured circles
Fig. 2
Fig. 2
Central results of the infrastructure hazard computations. Proportion of all residential, transportation, and industrial infrastructure in areas of near-surface permafrost thaw (a) and high hazard (b) in the pan-Arctic permafrost area based on different Representative Concentration Pathway (RCP) scenarios by the middle of the century (2041–2060). The comparable results of RCP4.5 for geographical sub-regions (Eurasia, North America and central Asian mountains) are presented in (c) and (d) (also 2041–2060; percentages for airports/-field, pipelines and industrial areas are not shown for central Asian mountains owing to too few observations). The numerical results are presented in Supplementary Table 3. The uncertainty ranges (bars) were based on the uncertainty in the mean annual ground temperature (ad) and active layer thickness predictions (b and d)
Fig. 3
Fig. 3
Pan-Arctic infrastructure hazard map with close-ups from central Alaska and northwestern parts of the Russian Arctic. A consensus of three geohazard indices (settlement index, risk zonation index, and analytic hierarchy process-based index) showing hazard potential by risk level (low–high) for infrastructure damage by the middle of the century (2041–2060). Hot spots indicate areas where all three indices showed high potential for infrastructure damage. Infrastructure other than settlements, the Qinghai–Tibet Railway, and major pipeline systems are shown only in the close-ups. OpenStreetMap data extracts, are licensed under CC BY-SA 2.0 (https://creativecommons.org/licenses/by-sa/2.0/) and Open Database License v1.0 (http://opendatacommons.org/licenses/odbl/1.0/). World Borders dataset is from http://thematicmapping.org/downloads/world_borders.php and licensed under CC BY-SA 3.0 (https://creativecommons.org/licenses/by-sa/3.0/)

References

    1. AMAP. Snow, Water, Ice and Permafrost in the Arctic (SWIPA) (Arctic Monitoring and Assessment Programme (AMAP), Oslo, Norway, 2017).
    1. Nelson FE. (Un)frozen in time. Science. 2003;299:1673–1675. doi: 10.1126/science.1081111. - DOI - PubMed
    1. Romanovsky VE, Smith SL, Christiansen HH. Permafrost thermal state in the polar Northern Hemisphere during the International Polar Year 2007–2009: a synthesis. Permafr. Periglac. Process. 2010;21:106–116. doi: 10.1002/ppp.689. - DOI
    1. Vaughan, D. G. et al. in Climate Change 2013: The Physical Science Basis (eds Stocker, T. F. et al.) Ch. 4 (IPCC, Cambridge University Press, Cambridge, MA, 2013).
    1. Schuur EAG, et al. Climate change and the permafrost carbon feedback. Nature. 2015;520:171–179. doi: 10.1038/nature14338. - DOI - PubMed

Publication types