. 2019 Jan;20(1):86-96.
doi: 10.1038/s41590-018-0273-1. Epub 2018 Dec 10.

Histone demethylase LSD1 is required for germinal center formation and BCL6-driven lymphomagenesis

Affiliations

Histone demethylase LSD1 is required for germinal center formation and BCL6-driven lymphomagenesis

Katerina Hatzi et al. Nat Immunol. 2019 Jan.

Abstract

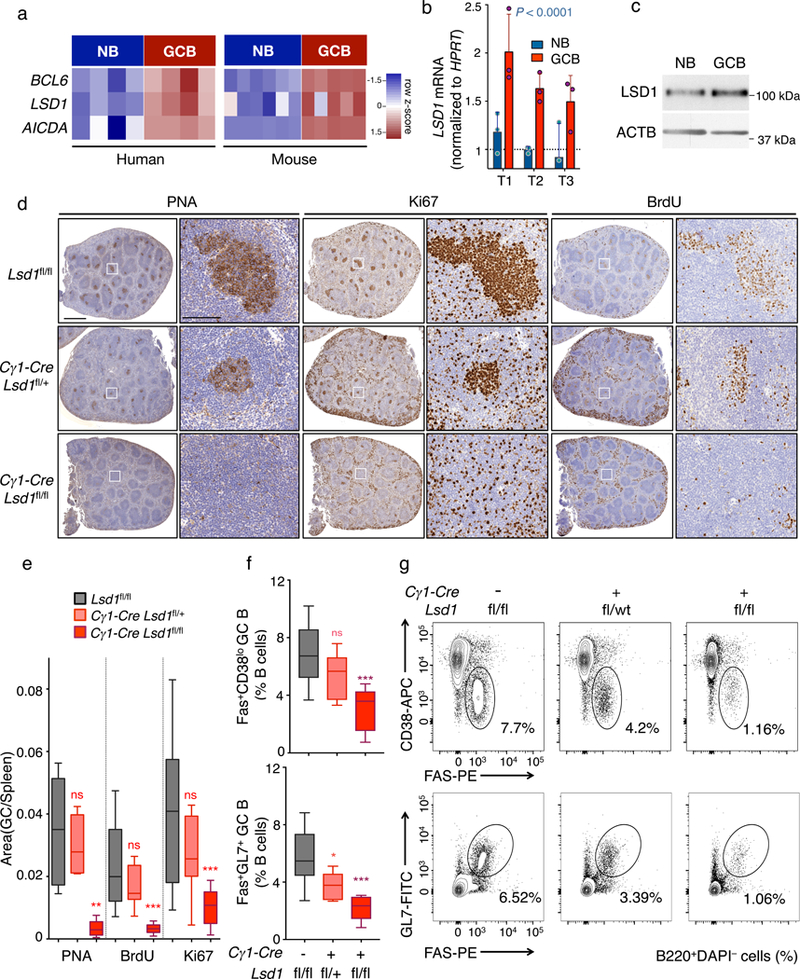
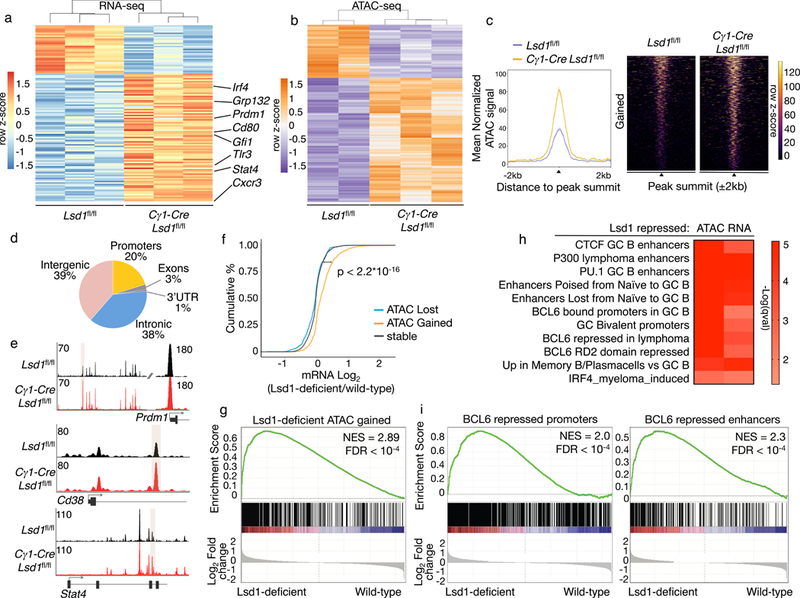
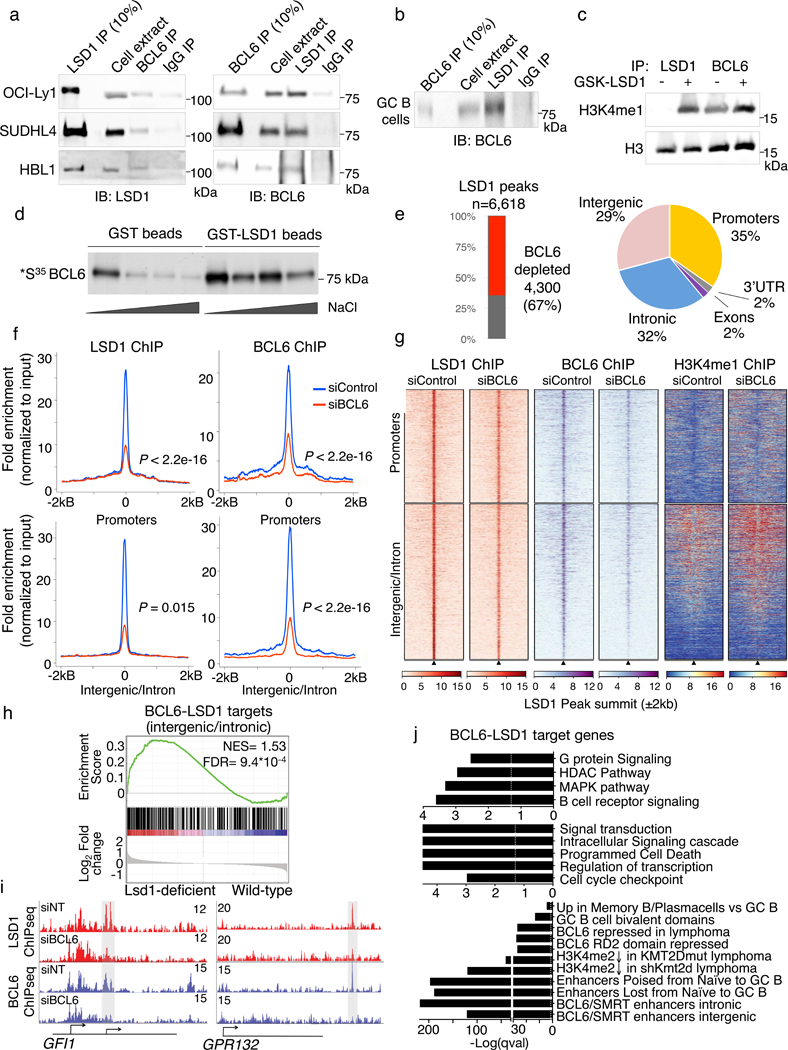
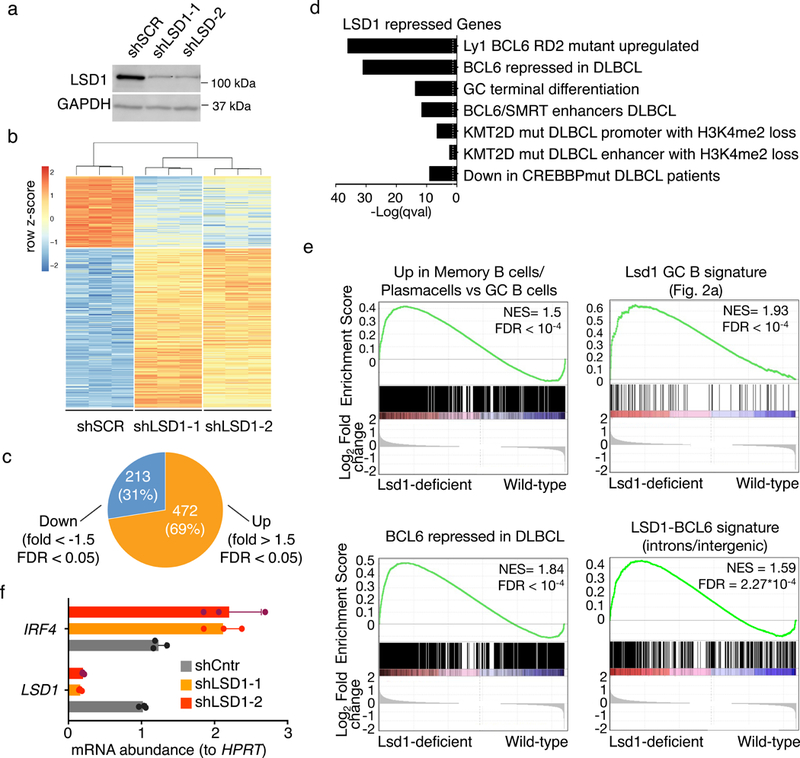
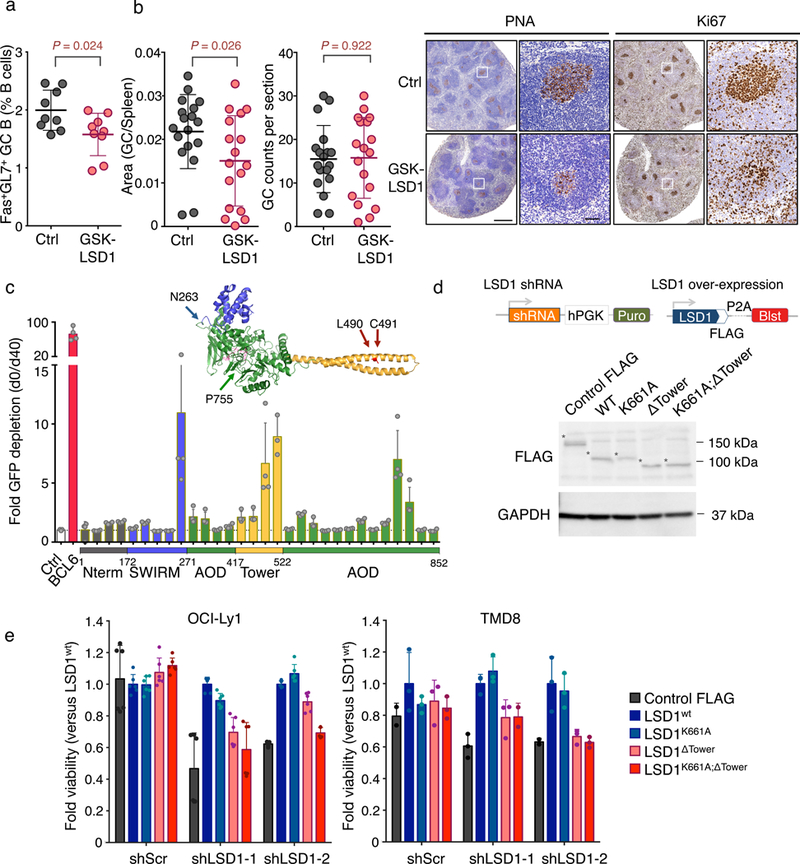
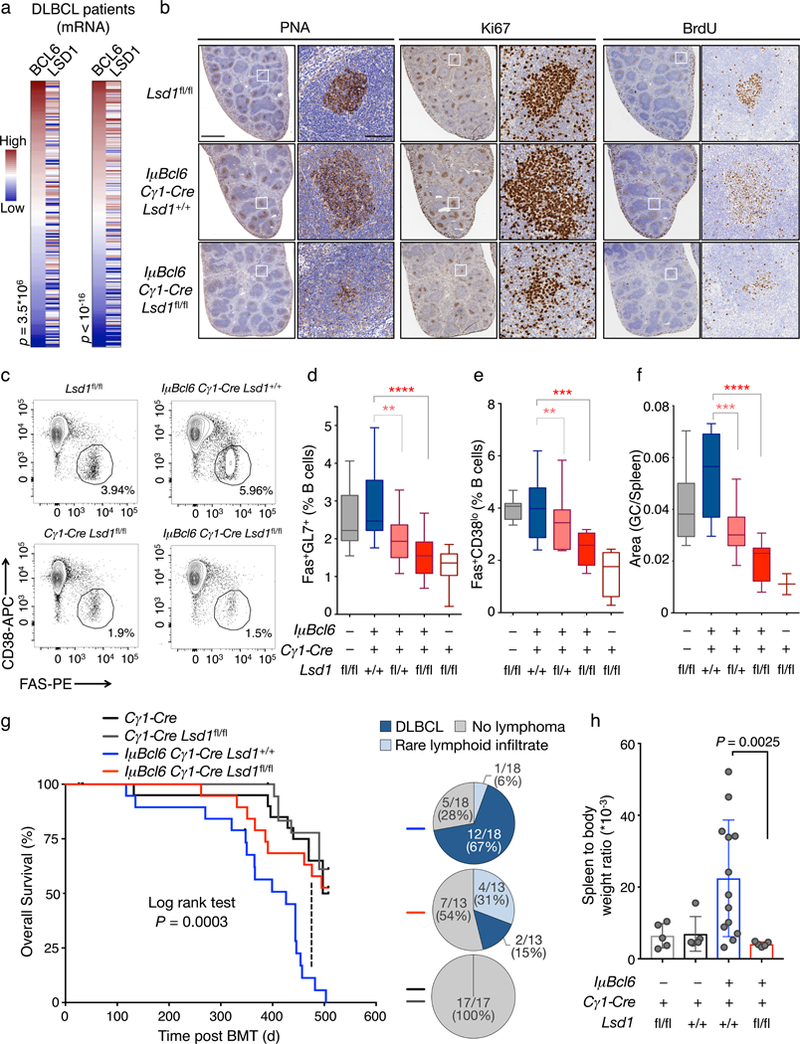
Germinal center (GC) B cells feature repression of many gene enhancers to establish their characteristic transcriptome. Here we show that conditional deletion of Lsd1 in GCs significantly impaired GC formation, associated with failure to repress immune synapse genes linked to GC exit, which are also direct targets of the transcriptional repressor BCL6. We found that BCL6 directly binds LSD1 and recruits it primarily to intergenic and intronic enhancers. Conditional deletion of Lsd1 suppressed GC hyperplasia caused by constitutive expression of BCL6 and significantly delayed BCL6-driven lymphomagenesis. Administration of catalytic inhibitors of LSD1 had little effect on GC formation or GC-derived lymphoma cells. Using a CRISPR-Cas9 domain screen, we found instead that the LSD1 Tower domain was critical for dependence on LSD1 in GC-derived B cells. These results indicate an essential role for LSD1 in the humoral immune response, where it modulates enhancer function by forming repression complexes with BCL6.


Figures

Figure 1.
Figure 1.. LSD1 is essential for GC formation and robust humoral immune response.
a) RNA-seq analysis showing BCL6, LSD1 and AICDA mRNA abundance in human and mouse NB vs GC B cells visualized by heatmap based on row FPKM (Fragments Per Kilobase of transcript per Million mapped reads) z-scores. Data from biologically independent human (n= 4 Naïve B (NB), n= 4 GC B samples) or mouse RNA-seq (n= 6 Naïve B, n= 5 GC B) samples b) Fold LSD1 mRNA levels (mean ± s.d.) in NB and GC B cells isolated from three biologically independent reactive human tonsils (T1, T2, T3) normalized to HPRT (triplicate qPCR reactions). P value was calculated by two-way ANOVA. c) LSD1 immunoblot (cropped image) from NB and GC B cells isolated from human tonsils. Actin served as protein loading control. Data are representative of two independent experiments with similar results. d) Immunohistochemistry of spleen sections from Lsd1fl/fl, Cγ1-Cre Lsd1fl/+ or Cγ1-Cre Lsd1fl/fl immunized with SRBC and sacrificed 10 d post immunization stained with PNA, Ki67, and BrdU at two magnifications (Scale bars: 1 mm, 100 μm). Images representative of more than 10 spleen sections. e) Quantification of PNA, Ki67 and BrdU staining from (d). The GC area versus the total spleen section area is the quantified area of PNA stained regions versus the total area of each spleen section. Data from n= 12 Lsd1fl/fl, n=11 Cγ1-Cre Lsd1fl/+ and n=10 Cγ1-Cre Lsd1fl/fl biologically independent mice. f-g) Flow cytometry analysis of mouse GC splenocytes populations calculated as percent of GC B cells (Fas+CD38lo or Fas+GL7+) within live B cells (B220+) (f). The gated areas in representative flow cytometry dotplots (g) show the corresponding GC B cell population within live B cells (B220+ DAPI). Data from n= 10 Lsd1fl/fl, n= 9 Cγ1-Cre Lsd1fl/+ and n= 9 Cγ1-Cre Lsd1fl/fl biologically independent mice. Boxplots are shown as median, interquartile range, and minimum to maximum (e,f).P values indicate comparison to Lsd1fl/fl mice by two-sided unpaired t-test (e,f) (*P < 0.05, **P < 0.01, ***P < 0.001).
Figure 2.
Figure 2.. LSD1 deletion alters the GC B cell transcription program.
a) RNA-seq analysis of sorted GC B cells from biologically independent immunized conditional Lsd1fl/fl (n = 3) versus Cγ1-Cre Lsd1fl/fl (n = 3) mice. Heatmap represents row-based z-scores of DESeq2 normalized read counts for differentially expressed genes (FDR < 0.05, fold change > 1.5). b) Heatmap of differentially accessible ATAC-seq peaks (FDR < 0.05) from sorted GC B cells from biologically independent immunized Lsd1fl/fl (n = 2) versus Cγ1-Cre Lsd1fl/fl (n = 3) mice. Heatmap represents row based z-scores of DESeq2 normalized Tn5 insertion counts for each differentially accessible ATAC-seq peak. c) Mean normalized Tn5 insertion signal and heatmap of fragment density for loci gaining accessibility (FDR < 0.05) in ATAC-seq from GC B cells sorted from biologically independent immunized Lsd1fl/fl (n = 2) versus Cγ1-Cre Lsd1fl/fl (n = 3) mice. d) Genomic distribution of loci gaining accessibility in Lsd1-deficient cells compared to wild-type based on RefSeq. e) Examples of loci gaining accessibility in Lsd1-deficient cells compared to wild-type controls surrounding Prdm1, Cd38 and Stat4. Read density tracks from pooled replicates (n = 2 Lsd1fl/fl; n = 3 Cγ1-Cre Lsd1fl/fl). f) Cumulative distribution of log2 fold gene expression change values by proximity of the genes to differentially accessible loci that are closing, opening or remaining stable in Lsd1 deficient cells compared to wild-type controls. Data from biologically independent immunized Lsd1fl/fl (n = 2) versus Cγ1-Cre Lsd1fl/fl (n = 3) mice. P value was based on two-sided Kolmogorov-Smirnov test. g) GSEA analysis of genes linked to opening loci in Lsd1-deficient GC B cells versus wild-type using ranked gene expression changes induced by Lsd1 depletion in GC B cells in vivo. NES and FDR values as implemented by GSEA; based on 10,000 sample permutations. h) Gene pathway analysis of genes gaining accessibility upon Lsd1 deletion (ATAC) or genes upregulated by RNA-seq upon LSD1 deletion in GC B cells (RNA). Fisher exact test was used to calculate enrichment P values for each gene set and q values were calculated based on BH. i) GSEA analysis of genes targeted and repressed by BCL6 through their promoter or genes linked to BCL6 bound proximal enhancers that are upregulated upon BCL6 knockdown in lymphoma cells. Genes were ranked based on decreasing log2 fold gene expression changes comparing LSD1 deficient cells to wild-type GC B cells (NES and FDR values as implemented by GSEA, based on 10,000 sample permutations).
Figure 3.
Figure 3.. LSD1 interacts with BCL6 in lymphoma cells
a) Reciprocal coimmunoprecipitation of BCL6 and LSD1 (cropped image) from lymphoma cell extracts from OCI-Ly1, SUDHL4 and HBL1 cells. IgG antibody served as a negative control. Experiments were performed at least 3 times with OCI-Ly1 twice with SUDHL4 and once with HBL1 cells. b) Coimmunoprecipitation of BCL6 and LSD1 in tonsil GC B cell extracts (cropped image). IgG antibody served as a negative control. Experiment was performed twice with similar result. c) H3 and H3K4me1 immunoblot of histone demethylation reactions (cropped image) from LSD1and BCL6 precipitates from lymphoma B cell extracts and bulk core histone substrates treated 1 μM GSK-LSD1 inhibitor or vehicle. Experiment was performed twice with similar result. d) GST-pull down assay using GST-LSD1 or GST alone as control. Purified proteins were incubated with radiolabelled BCL6 and washed with increasing NaCl concentration washes. Radioactive signal indicating interaction was captured by fluorography (cropped image). Experiment was performed at least twice with similar result. e) Breakdown of LSD1 significantly depleted peaks after BCL6 knockdown or LSD1 peaks unaltered after BCL6 depletion. Piechart indicates the genome-wide distribution of BCL6-dependent LSD1 peaks based on RefSeq. f) Fold enrichment of BCL6 and LSD1 ChIP-seq reads normalized to corresponding input in lymphoma cells treated with BCL6 siRNA or non-targeted control siRNA (P values were calculated by one-sided Kolomonov-Smirnoff test). Top panels show LSD1 peaks that occur in promoter regions (n= 2,557) and bottom panel show LSD1 peaks that are in intronic or intergenic regions (n= 3,503). g) Heatmaps showing LSD1, BCL6 and H3K4me1 ChIP-seq peak density surrounding LSD1 peaks in promoters and intergenic/intronic regions shown in (e) with BCL6 siRNA or non-targeted control siRNA. h) GSEA analysis based on genes ranked by decreasing log2 fold gene expression changes of LSD1-deficient cells versus wild-type controls using genesets linked to BCL6-LSD1 complexes through intronic or intergenic binding (NES and FDR as implemented by GSEA; based on 10,000 sample permutations). i) Examples of LSD1 and BCL6 ChIP-seq tracks surrounding the GFI1 and GPR132 promoter with or without siBCL6 treatment. Experiment was validated more than three times by qChIP. j) Pathway analysis of genes linked to BCL6 dependent LSD1 peaks. P values based on two-sided Fisher exact test for each gene set; FDR was calculated based on BH.
Figure 4.
Figure 4.. Loss of LSD1 inhibits proliferation and lymphoma cell growth in vivo
a) Cropped immunoblot for LSD1 in OCI-Ly1 cells transduced with control shRNA or two shRNA targeting LSD1. GAPDH was used as loading control. Data are representative of three independent experiments. b) Heat map representing the row z-scores of the expression value (DESeq2 normalized read counts) characterized by RNA-seq for genes differentially expressed between shLSD1–1 and shLSD1–2 versus control shRNA (FDR < 0.05, fold change > 1.5). Data from triplicate independent shRNA treated samples. c) Piechart of genes differentially expressed between shLSD1–1 and shLSD1–2 versus control shRNA GC B cells (FDR < 0.05, fold change >1.5) d) Gene ontology analysis and pathway analysis based on curated datasets of genes upregulated upon LSD1 depletion (FDR<0.05, fold change>1.5) in DLBCL cells. Fisher exact test was used to calculate enrichment P values for each gene set and FDR was calculated based on BH. e) GSEA analysis based on decreasing log2 fold gene expression changes comparing LSD1 knockdown DLBCL cells to cells with control shRNA using the following genesets i) genes upregulated in plasma cell and memory cells versus GC B cells ii) genes repressed by Lsd1 in GC B cells in vivo iii) genes upregulated after BCL6 siRNA knockdown in DLBCL and iv) genes linked to BCL6-LSD1 complexes through intronic or intergenic binding (NES and FDR values as implemented by GSEA, based on 10,000 sample permutations) f) Fold change of IRF4 mRNA levels (mean ± s.d.) in LSD1 knockdown cells versus control shRNA transfected cells normalized to HPRT based (triplicate qPCR reactions).
Figure 5.
Figure 5.. LSD1 lymphoma prosurvival effect is mediated through non-catalytic functions.
a) Flow cytometry analysis of GC B cell splenocytes calculated as percent Fas+GL7+ cells within live B cells (B220+DAPI) from biologically independent immunized mice (n = 9 mice per group; mean ± s.d.) and treated on a daily basis with GSK-LSD1 (0.5 mg/kg) or PBS vehicle and sacrificed at 10 days. P values were calculated using two-sided unpaired t-test, *P < 0.05). Data are representative of three independent experiments. b) Quantification of PNA stained spleen sections from GSK-LSD1 treated versus vehicle treated mice. Left: Fraction of PNA stained area versus the total spleen section area. Middle: GC counts per spleen section. Right: Representative immunohistochemistry images of mouse spleen sections stained with PNA or Ki67 at two magnifications (vehicle versus GSK-LSD1 treated). Each point represents an individual mouse (Data pooled from two independent experiments; n=18 mice per group; mean ± s.d.; P values were calculated using two-sided unpaired t-test; scale bars, 0.5mm and 50 μm respectively). c) Fold depletion of % GFP+ cells (mean± s.d.) bearing sgRNAs targeting different parts of the LSD1 ORF at d40 post doxycycline induction versus d0. LSD1 protein structure with color-coded protein domains (N terminus: grey, SWIRM: blue, Tower: yellow, AOD: green) (PyMOL). Experiment was performed in n= 4 technical replicates and was further replicated using an independent Cas9 expressing OCI-Ly1 clone (see Supplementary Fig. 5h). d) Graphical representation of knockdown and rescue FLAG constructs and cropped immunoblot extracts from lymphoma cells transfected with FLAG tagged LSD1 rescue constructs: wild-type LSD1 (LSD1wt), catalytically inactive LSD1 (LSD1K661A), LSD1 lacking the Tower domain (LSD1ΔTower) and catalytically inactive LSD1 lacking the Tower domain (LSD1K661A;ΔTower) probed with anti-FLAG antibody. Cells transfected with Cas9-FLAG construct were used as controls. GAPDH served as protein loading control. Asterisk indicates each FLAG protein. Experiment representative of two blots. e) Viable cell counts (mean± s.d.) of two lymphoma cell lines (OCI-Ly1 and TMD8 cells in triplicate wells) transfected by control shRNA or two LSD1 targeted shRNAs and rescued with various LSD1 mutant constructs (d) normalized to cells rescued with wild-type LSD1.
Figure 6.
Figure 6.. LSD1 loss of function abrogates Bcl6 driven GC hyperplasia and lymphomagenesis.
a) Correlation of BCL6 and LSD1 mRNA levels in two independent DLBCL cohorts from ref. (left) and ref. (right). Heatmaps were ranked by increasing BCL6 mRNA abundance. P value is based on Spearman correlation. b) Immunohistochemistry images of representative individual spleen sections from Lsd1fl/fl mice (n= 3), IμBcl6 Cγ1-Cre Lsd1+/+ mice (n= 11) and IμBcl6 Cγ1-Cre Lsd1fl/fl mice (n= 9) immunized with SRBC and sacrificed 10 d post immunization stained with PNA, Ki67, and BrdU at two magnifications. Scale bars, 1mm and 100 μm respectively. c) Representative flow cytometry dotplots of mouse GC splenocytes. The gated area shows the percent of GC B cell populations Fas+CD38lo within live B cells (B220+ DAPI) d) Flow cytometry analysis of mouse GC B cell splenocytes identified as Fas+GL7+ from Lsd1fl/fl mice (n = 15), IμBcl6 Cγ1-Cre Lsd1+/+ mice (n = 19), IμBcl6 Cγ1-Cre Lsd1fl/+ mice (n = 18), IμBcl6 Cγ1-Cre Lsd1fl/fl mice (n = 17), and Cγ1-Cre Lsd1fl/fl mice (n = 11) at day 10 post immunization. Data are shown as percent of live B cells (B220+DAPI) and were pooled from two independent experiments. e) Flow cytometry analysis of mouse GC B cell splenocytes identified as Fas+CD38lo cells from Lsd1fl/fl (n = 8), IμBcl6 Cγ1-Cre Lsd1+/+ (n = 11), IμBcl6 Cγ1-Cre Lsd1fl/+ (n = 10), IμBcl6 Cγ1-Cre Lsd1fl/fl (n = 9) and Cγ1-Cre Lsd1fl/fl mice (n = 3) at day 10 post immunization. Data are shown as percent of live B cells (B220+DAPI). Flow cytometry analysis of mouse GC B cells as percent of live B cells (B220+DAPI) as Fas+CD38loB220+DAPI. f) Quantification of PNA stained area from Lsd1fl/fl (n = 8), IμBcl6 Cγ1-Cre Lsd1+/+ (n = 11), IμBcl6 Cγ1-Cre Lsd1fl/+ (n = 10), IμBcl6 Cγ1-Cre Lsd1fl/fl (n = 9) and Cγ1-Cre Lsd1fl/fl (n = 3) mouse spleen sections versus the total spleen section area. Each sample represents an individual mouse. P values indicate comparison to IμBcl6 Cγ1-Cre Lsd1+/+ mice by two-sided unpaired t-test (**P < 0.01, ***P < 0.001, ****P < 0.0001); boxplots are shown as median, interquartile range, and minimum to maximum. g) Overall survival of mice transplanted with bone marrow from Cγ1-Cre Lsd1fl/fl (n= 20), Cγ1-Cre (n= 18), IμBcl6 Cγ1-Cre Lsd1+/+ (n = 19), IμBcl6 Cγ1-Cre Lsd1fl/fl (n = 19) animals by measuring time of death or euthanasia after bone marrow transplantation. P value calculated by log rank test is indicated. h) Quantification of spleen to body ratio (mean ± s.d.) of individual sacrificed mice belonging to groups transplanted with bone marrow from Cγ1-Cre Lsd1fl/fl mice (n = 5), Cγ1-Cre mice (n = 5), IμBcl6 Cγ1-Cre Lsd1+/+ mice (n= 13), IμBcl6 Cγ1-Cre Lsd1fl/fl mice (n = 5). P value indicates two-sided unpaired t-test.

Comment in

  • B cells turn on, tune in with LSD1.
    Good-Jacobson KL. Good-Jacobson KL. Nat Immunol. 2019 Jan;20(1):3-5. doi: 10.1038/s41590-018-0281-1. Nat Immunol. 2019. PMID: 30538329 No abstract available.

References

    1. Mesin L, Ersching J & Victora GD Germinal Center B Cell Dynamics. Immunity 45, 471–482 (2016). - PMC - PubMed
    1. Hatzi K & Melnick A Breaking bad in the germinal center: how deregulation of BCL6 contributes to lymphomagenesis. Trends Mol Med 20, 343–352 (2014). - PMC - PubMed
    1. Beguelin W et al. EZH2 is required for germinal center formation and somatic EZH2 mutations promote lymphoid transformation. Cancer cell 23, 677–692 (2013). - PMC - PubMed
    1. Beguelin W et al. EZH2 and BCL6 Cooperate to Assemble CBX8-BCOR Complex to Repress Bivalent Promoters, Mediate Germinal Center Formation and Lymphomagenesis. Cancer Cell 30, 197–213 (2016). - PMC - PubMed
    1. Bunting KL et al. Multi-tiered Reorganization of the Genome during B Cell Affinity Maturation Anchored by a Germinal Center-Specific Locus Control Region. Immunity 45, 497–512 (2016). - PMC - PubMed

Publication types