. 2019 Feb 1;30(3):333-345.
doi: 10.1091/mbc.E18-06-0402. Epub 2018 Dec 12.

Single-molecule dynamics of the P granule scaffold MEG-3 in the Caenorhabditis elegans zygote

Affiliations

Single-molecule dynamics of the P granule scaffold MEG-3 in the Caenorhabditis elegans zygote

Youjun Wu et al. Mol Biol Cell. .

Abstract

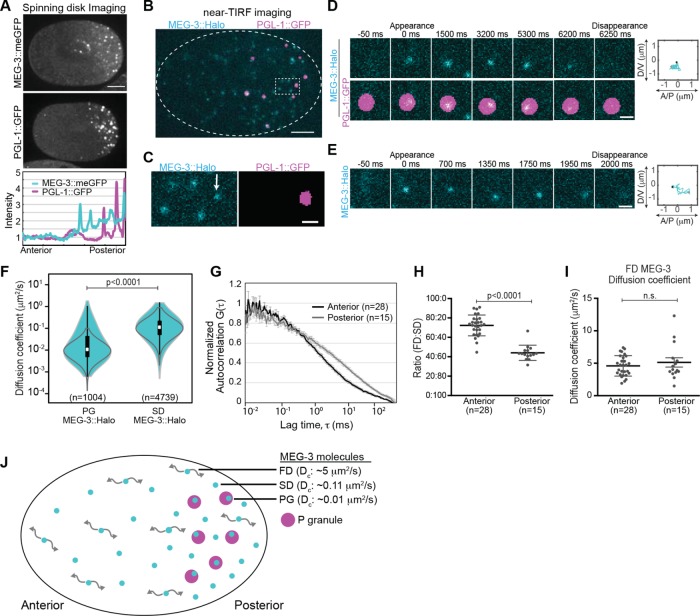
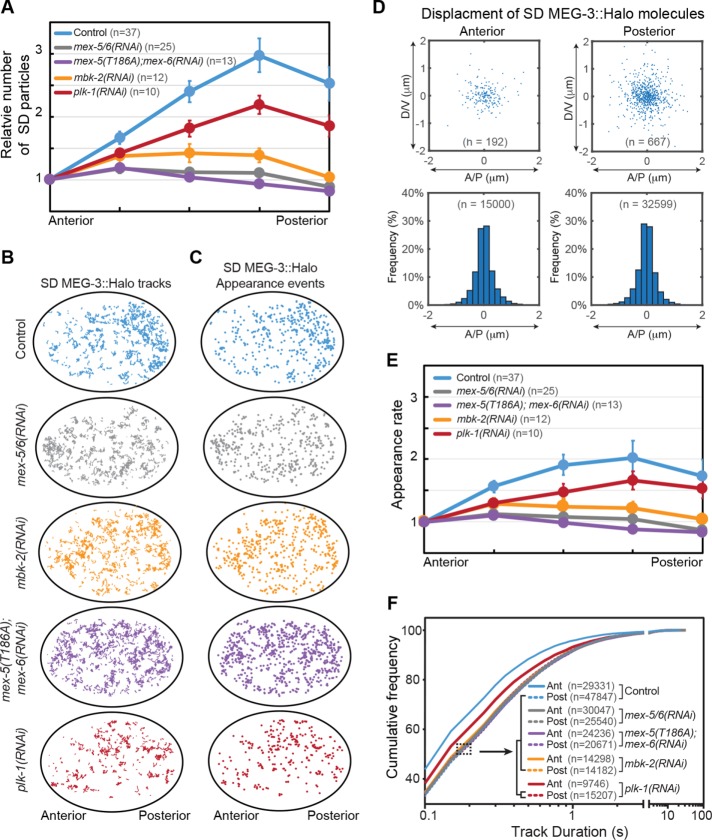
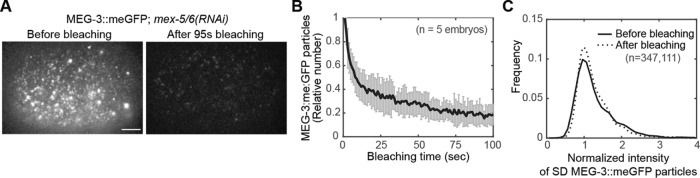
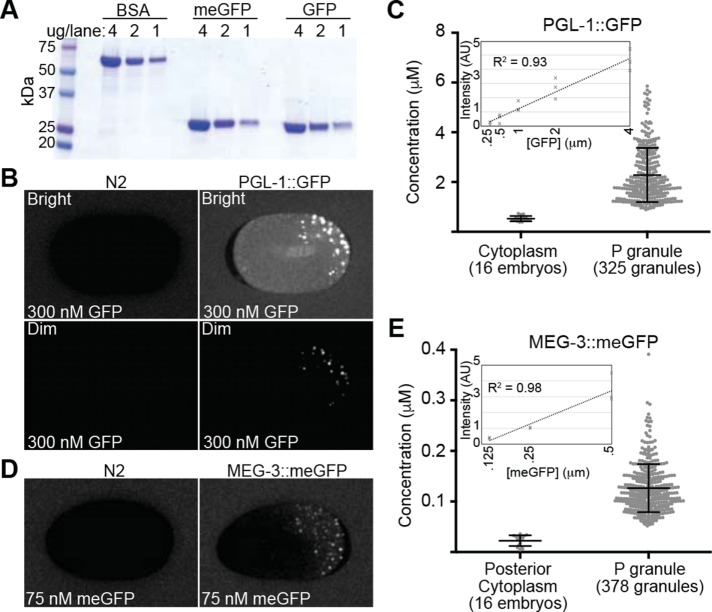
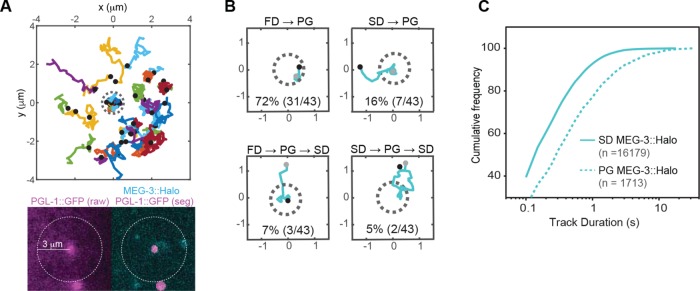
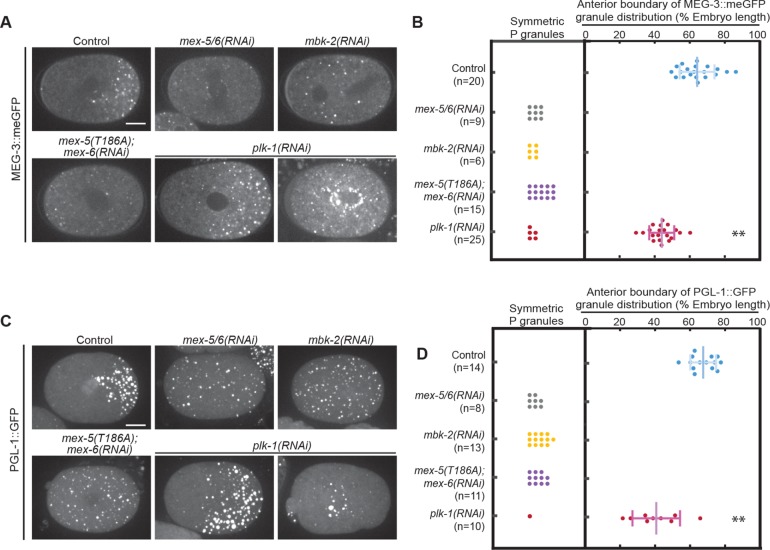
During the asymmetric division of the Caenorhabditis elegans zygote, germ (P) granules are disassembled in the anterior cytoplasm and stabilized/assembled in the posterior cytoplasm, leading to their inheritance by the germline daughter cell. P granule segregation depends on MEG (maternal-effect germline defective)-3 and MEG-4, which are enriched in P granules and in the posterior cytoplasm surrounding P granules. Here we use single-molecule imaging and tracking to characterize the reaction/diffusion mechanisms that result in MEG-3::Halo segregation. We find that the anteriorly enriched RNA-binding proteins MEX (muscle excess)-5 and MEX-6 suppress the retention of MEG-3 in the anterior cytoplasm, leading to MEG-3 enrichment in the posterior. We provide evidence that MEX-5/6 may work in conjunction with PLK-1 kinase to suppress MEG-3 retention in the anterior. Surprisingly, we find that the retention of MEG-3::Halo in the posterior cytoplasm surrounding P granules does not appear to contribute significantly to the maintenance of P granule asymmetry. Rather, our findings suggest that the formation of the MEG-3 concentration gradient and the segregation of P granules are two parallel manifestations of MEG-3's response to upstream polarity cues.


Figures

FIGURE 1:
FIGURE 1:
Single-molecule imaging of MEG-3::Halo. (A) Top, spinning disk confocal images of MEG-3::meGFP and PGL-1::GFP embryos at NEBD. Scale bar = 10 μm. Anterior is to the left, and posterior is to the right in this and all subsequent images. Bottom, intensity profile along the anterior/posterior axis of the embryos shown above (normalized to the anterior pole). (B) Near-TIRF imaging of MEG-3::Halo; PGL-1::GFP embryos. MEG-3::Halo molecules (cyan) are present both within PGL-1::GFP granules (magenta) and in the surrounding cytoplasm. PGL-1::GFP granules are segmented. Scale bar = 5 μm. (C) Enlargement of the region in B indicated by the dotted box. Note the presence of MEG-3::Halo molecules both within (PG molecule, marked by arrow) and outside (SD molecules) of the segmented PGL-1::GFP granules. Under these imaging conditions, fast-diffusing MEG-3::Halo molecules are blurred and cannot be tracked. Scale bar = 1 μm. (D, E) Examples of the appearance and disappearance of single MEG-3::Halo PG (D) and SD (E) molecules. Time relative to the initial appearance of the molecule is indicated above the panels. Right, the trajectories of the corresponding molecules with the black and the gray dot showing the appearance and disappearance events, respectively. Scale bar = 1 μm. (F) Violin plot (log-scale) of estimated Dc of PG and SD MEG-3::Halo molecules in the posterior. White dots = median, box = 25th and 75th percentiles, whiskers = 1.5X the interquartile range from the 25th and 75th percentiles. Statistical significance in F, H, and I were determined with Student’s t tests (two-tailed). Gray lines indicate Dc estimates from simulated Brownian motion of molecules with Dc = 0.01 μm2/s (left) and Dc = 0.11 μm2/s (right). (G) FCS autocorrelation curves of MEG-3::meGFP in the anterior and posterior cytoplasm (anterior, n = 28; posterior, n = 15). Error bars indicate SEM. (H) Ratio of fast and slow-diffusing components estimated by fitting the FCS curves (G) to a two-component model. For H and I, error bars represent standard deviation. (I) Dc of the fast-diffusing component estimated from FCS curves (G). (J) Schematic of an embryo with distinct FD, SD, and PG MEG-3 molecules and their median apparent Dc. P granules are in magenta.
FIGURE 2:
FIGURE 2:
Single-molecule behaviors underlying MEG-3::Halo gradient formation. (A) The number of SD MEG-3::Halo particles across the A/P axis of embryos with the indicated genotype. Particles numbers were normalized to the anterior end and averaged among the indicated number (n) of embryos. Error bars indicate SEM. (B) Tracks of SD MEG-3::Halo molecules in representative embryos of the indicated genotype. Trajectories longer than 250 ms during 10 s acquisitions are shown. (C) Appearance events of SD MEG-3::Halo molecules in embryos of the indicated genotypes. The same embryos were analyzed in B and C. (D) Top, displacement of SD MEG-3::Halo molecules in the anterior and posterior cytoplasm from the embryo in B and C. For each molecule, the appearance position is normalized to the center of the graph and the disappearance position is indicated by a blue dot. Only the displacements of tracks >250 ms are shown. Bottom, frequency of displacements of tracks >250 ms along the A/P axis. Tracks are pooled from 37 embryos (n = total number of tracks analyzed). (E) Average appearance rate of SD MEG-3::Halo particles along the A/P axis. Appearance rate is normalized to the anterior region for each embryo. Note that we cannot directly compare appearance rates between embryos due to variability in Halo labeling and in illumination. The same embryos were analyzed in A, E, and F. n = number of embryos analyzed. Error bars indicate SEM. (F) Cumulative frequency of track durations for the indicated genotypes. Track duration values are pooled from the indicated number embryos in A. n = number of particle tracks analyzed. Note that genotypes within the brackets show similar cumulative frequency distributions.
FIGURE 3:
FIGURE 3:
Brightness analysis of MEG-3::meGFP SD particles. (A) Representative near-TIRF images of MEG-3::meGFP in mex-5/6(RNAi) embryos before and after bleaching. The overall intensity of the embryo is brighter before bleaching because of higher particle density and out-of-focus signal. Scale bar = 5 μm. (B) Relative number of MEG-3::meGFP particles normalized to the average number between 0 and 1 s and plotted over time. After 100 s of photobleaching, the number of detectable MEG-3::meGFP particles dropped by an average of ∼80%. Average of five embryos. Error bars indicate SEM. (C) Brightness analysis of endogenously tagged MEG-3::meGFP particles in mex-5/6(RNAi) embryos before and after bleaching. Frequency of normalized intensity of all detectable MEG-3::meGFP particles pooled from the beginning of movies (0–1 s, the solid line) or from the end of the movies (95–100 s, the dashed line). Intensity is normalized to the peak value of 95–100 s for individual embryos as described in the methods. n = the total number of particle brightness estimates from five embryos. Note that because we did not track individual particles between frames, the brightness of each particle was estimated in each frame in which it was detected.
FIGURE 4:
FIGURE 4:
Quantification of MEG-3::meGFP and PGL-1::GFP concentration. (A) Coomassie-stained SDS–PAGE gel of recombinant meGFP and GFP at the indicated concentrations. BSA was used as a loading standard. (B) PGL-1::GFP (right) and N2 (left, no GFP expression) embryos were bathed in 300 nM recombinant GFP. The top images (Bright) were normalized to show the GFP bath and cytoplasmic GFP and include saturated P granule signals. The bottom images (Dim) are normalized so that there are no saturated pixels. (C) Quantification of estimated PGL-1::GFP concentration in the cytoplasm outside of P granules (16 embryos) and in P granules (325 P granules from 16 embryos). Error bars = SD. Inset, fluorescence intensity of different concentration GFP baths in arbitrary units (AU). R2 value for the trendline is indicated. (D) MEG-3::meGFP (right) and N2 (left, no GFP expression) embryos were bathed in 75 nM recombinant meGFP. (E) Quantification of estimated MEG-3::meGFP concentration in the posterior cytoplasm outside of P granules (16 embryos) and in P granules (378 P granules from 16 embryos). Error bars = SD. Inset, fluorescence intensity of different concentration meGFP baths in arbitrary units (AU). R2 value for the trendline is indicated.
FIGURE 5:
FIGURE 5:
Recruitment of MEG-3::Halo molecules into P granules. (A) Top, trajectories of MEG-3::Halo molecules that appeared within a 3-μm radius from the center of a P granule. Because P granules move, the XY positions of each trajectory were registered to the P granule center for every time point. Black dots represent appearance events, and the dotted gray circle represents the P granule. Bottom, PGL-1::GFP (raw, unsegmented image on the left and segmented image on the right) and MEG-3::Halo from a single representative frame of the movie used for tracking. The dotted circle indicates the region analyzed. (B) Representative trajectories of MEG-3::Halo molecules that associate with P granules. Black dots represent appearance events and gray dots represent disappearance events. XY positions were registered to the P granule center for every time point. Percentage of each subgroup of PG MEG-3::Halo particles is indicated. The corresponding particles are shown in Supplemental Movies S9–S12. (C) Cumulative frequency of track durations for SD and PG MEG-3::Halo from the 23 very sparsely labeled embryos. n = the total numbers of particles analyzed.
FIGURE 6:
FIGURE 6:
PLK-1 regulates P granule segregation. (A) Spinning disk confocal images of MEG-3::meGFP in embryos of different genotypes at NEBD. Images were taken at the cell midplane. Scale bar = 10 μm. (B, D) Quantification of P granule distribution at NEBD. For embryos in which P granules are asymmetrically distributed, the positions of the anterior-most granules are plotted. Only granules >0.7 μm in diameter were counted to exclude small granules that are sometimes present in the anterior of wild-type embryos. The distribution of P granules in plk-1(RNAi) embryos was significantly shifted toward the anterior compared with the Control (p < 0.0001; Student’s t test). n = number of embryo analyzed. Error bars indicate SD. (C) Maximum projections of spinning disk confocal images of PGL-1::GFP at NEBD. Images were taken at the cell midplane. Scale bar = 10 μm.

References

    1. Alberti S, Carra S. (2018). Quality control of membraneless organelles. J Mol Biol , 4711–4729. - PubMed
    1. Andralojc KM, Campbell AC, Kelly AL, Terrey M, Tanner PC, Gans IM, Senter-Zapata MJ, Khokhar ES, Updike DL. (2017). ELLI-1, a novel germline protein, modulates RNAi activity and P-granule accumulation in Caenorhabditis elegans. PLoS Genet , e1006611. - PMC - PubMed
    1. Arribere JA, Bell RT, Fu BX, Artiles KL, Hartman PS, Fire AZ. (2014). Efficient marker-free recovery of custom genetic modifications with CRISPR/Cas9 in Caenorhabditis elegans . Genetics , 837–846. - PMC - PubMed
    1. Berg HC, Purcell EM. (1977). Physics of chemoreception. Biophys J , 193–219. - PMC - PubMed
    1. Bolognesi B, Lorenzo Gotor N, Dhar R, Cirillo D, Baldrighi M, Tartaglia GG, Lehner B. (2016). A concentration-dependent liquid phase separation can cause toxicity upon increased protein expression. Cell Rep , 222–231. - PMC - PubMed

Publication types

MeSH terms

Substances

LinkOut - more resources