

Low 25-hydroxyvitamin D levels are more prevalent in Canadians of South Asian than European ancestry inhabiting the National Capital Region of Canada
- PMID: 30540776
- PMCID: PMC6291105
- DOI: 10.1371/journal.pone.0207429
Low 25-hydroxyvitamin D levels are more prevalent in Canadians of South Asian than European ancestry inhabiting the National Capital Region of Canada
Abstract
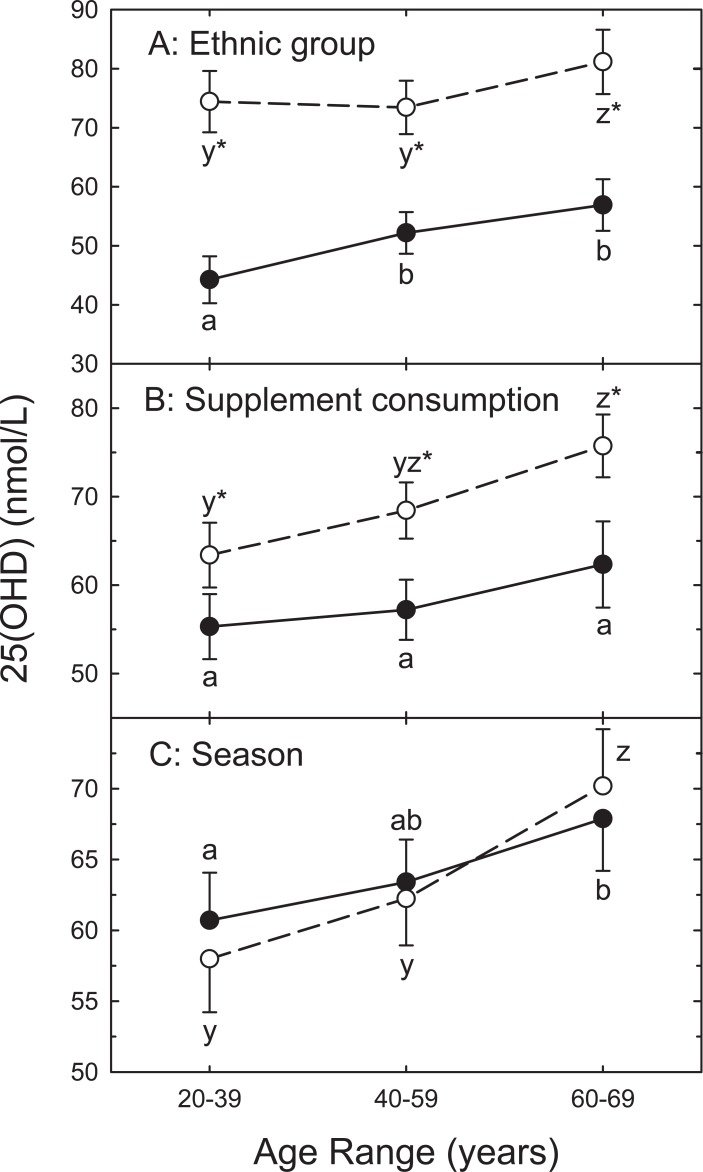
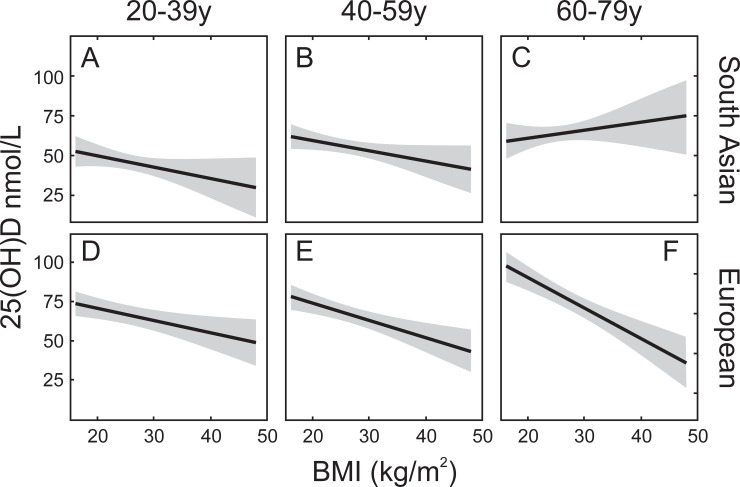
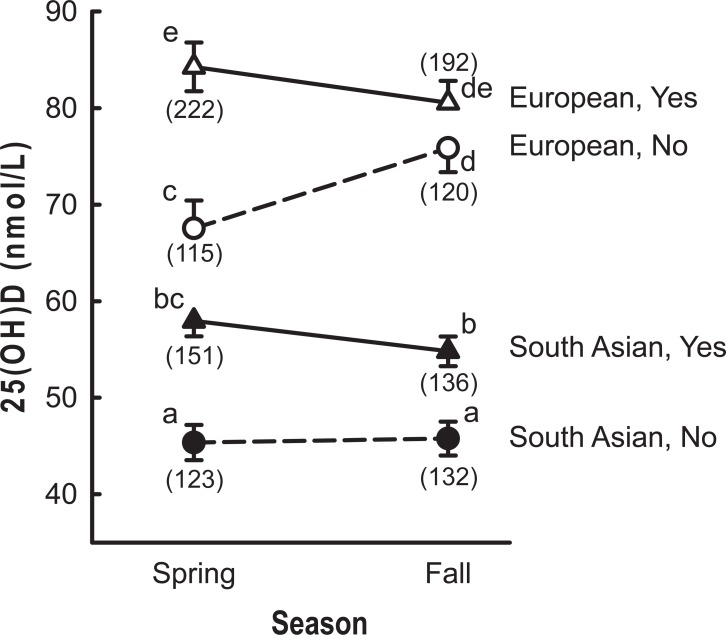
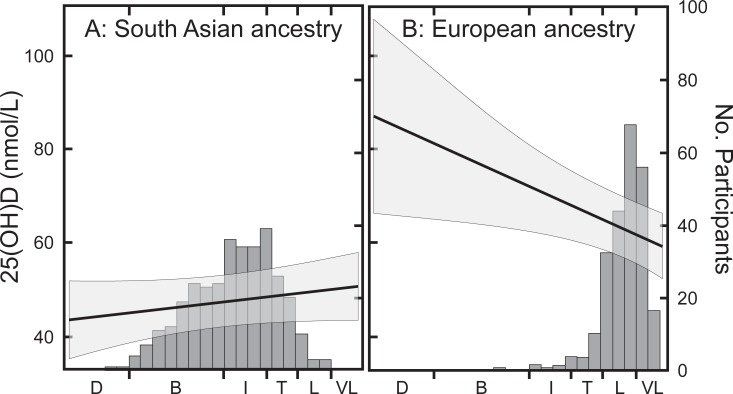
The US Institute of Medicine defined serum 25-hydroxyvitamin D (25OHD) cut point values of 30 nmol/L and 40 nmol/L were used to assess the vitamin D status of South Asian and European Canadians of self-identified ancestry living in the National Capital Region of Canada. Serum 25OHD values were measured in the spring and fall of 2012 to represent status during the winter and summer months, respectively. A total of 1238 measurements were obtained from 669 participants (49% South Asian ancestry): some participants were measured only once (spring or fall). Median 25OHD values were significantly higher in participants of European ancestry: 70.8 nmol/L (68.1, 73.5; 95% CI) versus South Asian ancestry: 42.7 nmol/L (40.5, 45.0; P<0.001). Spring vs. fall differences were small for each ethnic group and significant only for those of European ancestry (2.9, CI: 1.0-4.9 nmol/L; P = 0.01). Among participants of South Asian ancestry, 27.3% (fall) and 29.1% (spring) of females had values <40 nmol/L while the percentages for males were considerably higher (36.5% and 44.2%, respectively). The corresponding values for participants of European ancestry were ≤10%, showing that the South Asian participants were less likely to achieve the 25OHD concentrations established by the IOM for optimum bone health. Investigation of the factors related to serum 25OHD levels showed that supplement intake and ethnic background were associated with the biggest differences. Skin color was not a major factor, suggesting that genetic factors are responsible for the observed differences between participants of different ethnic backgrounds.
Conflict of interest statement
The authors have declared that no competing interests exist.
Figures
References
-
- Institute of Medicine. Dietary reference intakes for calcium and vitamin D. Ross AC, Taylor CL, Yaktine AL, Del Valle HB, editors. Washington, DC.: National Academy Press; 2011. - PubMed
-
- Taylor CL, Carriquiry AL, Bailey RL, Sempos CT, Yetley EA. Appropriateness of the probability approach with a nutrient status biomarker to assess population inadequacy: a study using vitamin D. Am J Clin Nutr. 2013;97(1):72–8. 10.3945/ajcn.112.046094 ; PubMed Central PMCID: PMC3522142. - DOI - PMC - PubMed
-
- Sarafin K, Durazo-Arvizu R, Tian L, Phinney KW, Tai S, Camara JE, et al. Standardizing 25-hydroxyvitamin D values from the Canadian Health Measures Survey. Am J Clin Nutr. 2015;102(5):1044–50. 10.3945/ajcn.114.103689 ; PubMed Central PMCID: PMC4625585. - DOI - PMC - PubMed
-
- Whiting SJ, Langlois KA, Vatanparast H, Greene-Finestone LS. The vitamin D status of Canadians relative to the 2011 Dietary Reference Intakes: an examination in children and adults with and without supplement use. Am J Clin Nutr. 2011;94(1):128–35. 10.3945/ajcn.111.013268 . - DOI - PubMed
-
- Ahn J, Yu K, Stolzenberg-Solomon R, Simon KC, McCullough ML, Gallicchio L, et al. Genome-wide association study of circulating vitamin D levels. Hum Mol Genet. 2010;19(13):2739–45. 10.1093/hmg/ddq155 ; PubMed Central PMCID: PMC2883344. - DOI - PMC - PubMed
Publication types
MeSH terms
Substances
LinkOut - more resources
Full Text Sources
Medical
