. 2019 Feb 20;47(3):1097-1109.
doi: 10.1093/nar/gky1245.

Allosteric DNAzyme-based DNA logic circuit: operations and dynamic analysis

Affiliations

Allosteric DNAzyme-based DNA logic circuit: operations and dynamic analysis

Xuedong Zheng et al. Nucleic Acids Res. .

Abstract

Recently, due to the dual roles of DNA and enzyme, DNAzyme has been widely used in the field of DNA circuit, which has a wide range of applications in bio-engineered system, information processing and biocomputing. In fact, the activity of DNAzymes was regulated by subunits assembly, pH control and metal ions triggers. However, those regulations required to change the sequences of whole DNAzyme, as separating parts and inserting extra DNA sequence. Inspired by the allosteric regulation of proteins in nature, a new allosteric strategy is proposed to regulate the activity of DNAzyme without DNA sequences changes. In this strategy, DNA strand displacement was used to regulate the DNAzyme structure, through which the activity of DNAzyme was well controlled. The strategy was applied to E6-type DNAzymes, and the operations of DNA logic circuit (YES, OR, AND, cascading and feedback) were established and simulated with the dynamic analyses. The allosteric regulation has potential to construct more complicated molecular systems, which can be applied to bio-sensing and detection.


Figures

Figure 1.
Figure 1.
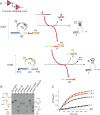
(A) Schematic comparison of allosteric regulation of protein and DNAzyme. (B) Illustration of YES gate. The fluorophore FAM and the quencher BHQ are functionalized at either end of substrate strand R1. And DNAzyme Z1 can cleave substrate R1 to make outputs and trigger fluorescent signals. (C) Native PAGE analysis of YES-gate products. The strands and complex involved were labeled above the lane number. The DNA complex was represented by its elements linked by slashes. Lane 1, gate complex Z1/T1/R1 consisting of strand Z1, T1 and R1; lane 2, DNAzyme complex Z1/T1/L; lane 3, products of DNAzyme digestion ([Z1]:[R1] = 1:3); lane 4, products of DNAzyme Z1 mixed with strand L, ([Z1]:[L] = 1:3); lane 5, products of YES logic operation triggered by input I1; lane 6, duplex I1/T1. (D) Time-dependent normalized fluorescence changes (ΔF/MaxΔF) at different levels of input concentrations. The sample interval was 3 min. Curves (1) to (5) demonstrate the gate responses at different concentrations of I1 as 0, 0.3, 0.4, 0.5 and 0.6μM, respectively. All data represent the average of three replicates. Error bars represent one standard deviation from triplicate analyses. (E) Time-dependent changes of concentrations of reactants during YES logic operation. Curves (1)–(3) denote time-dependent changes of concentrations of input strand I1, output strand O1 and YES gate complex Z1/T1/R1, respectively.
Figure 2.
Figure 2.
(A) Illustration of OR gate. The fluorophore FAM and the quencher BHQ are functionalized at either end of substrate strand R1. (B) Time-dependent normalized fluorescence changes (ΔF/MaxΔF) during 2-h reaction process. The sample interval was 3 min. Curves (1) to (4) demonstrate the gate responses to different inputs. Here, symbol + denotes the addition of strand and symbol—denotes the absence of strand. All data represent the average of three replicates. Error bars represent one standard deviation from triplicate analyses. (C) Illustration of AND gate. The fluorophore FAM and the quencher BHQ are functionalized at either end of substrate strand R1. (D) Time-dependent normalized fluorescence changes (ΔF/MaxΔF) during 2-h reaction process. The sample interval was 3 min. Curves (1) to (4) demonstrate the gate responses to different inputs. Here, symbol + denotes addition of the strand and symbol − denotes absence of the strand. All data represent the average of three replicates. Error bars represent one standard deviation from triplicate analyses. (E) Time-dependent changes of concentrations of reactants during OR logic operation triggered by only one input I2. Curves (1)–(3) denote time-dependent changes of concentrations of input strand I2, output O1 and OR gate complex Z1/T2/R1, respectively. (F) Time-dependent changes of concentration of reactants during OR logic operation triggered by both inputs I2 and I3. Curves (1)–(3) denote time-dependent changes of concentrations of input strands I2 and I3, output strand O1 and OR gate complex Z1/T2/R1, respectively. (G) Time-dependent changes of concentrations of reactants during AND logic operation triggered by both inputs I4 and I5. Curves (1)–(4) denote time-dependent changes of concentrations of input strands I4, I5, output strand O1 and AND gate complex Z2/T3/T4/R1, respectively.
Figure 3.
Figure 3.
(A) Illustration of two-level cascading circuit. The fluorophore FAM and the quencher BHQ are functionalized at either end of substrate strand R1. (B) Native PAGE analysis of two-level cascading circuit products. Lane 1, DNA complex Z3/T5/R2; lane 2, Unit1 complex Z3/T5/R1/P1; lane 3, products of Unit1 triggered by input I6; lane 4, Unit2 complex Z1/T1/R1; lane 5, products of Unit2 in presence of input I6; lane 6, products of Unit2 triggered by input I1; lane 7, mixture of Unit1 complex and Unit2 complex; lane 8, products of two-level cascading circuit consisting of Unit1 and Unit2 triggered by input I6. (C) Time-dependent normalized fluorescence changes (ΔF/MaxΔF) at different levels of input concentrations. The sample interval was 6 min. Curves (1) to (4) demonstrate the cascading circuit responses at different concentrations of I6 as 0, 0.3, 0.5, 0.7 μM, respectively. All data represent the average of three replicates. Error bars represent one standard deviation from triplicate analyses.
Figure 4.
Figure 4.
Simulative analysis for two-level cascading circuit. The symbol V with subscript denotes the reaction rate of reactant. (A) Illustration of stage evolution of circuit. (B) Time-dependent changes of concentrations of reactants: Unit1 and Unit2. (C) Time-dependent changes of concentrations of reactants: input strand I6, linker strand P1/I1′ and output strand O1. Reaction stage was labeled on the top of the figure. (D) Time-dependent changes of reaction rates of reactants: Unit1 and Unit2. (E) Time-dependent changes of reaction rates of reactants: input strand I6, linker strand P1/I1′ and output strand O1.
Figure 5.
Figure 5.
(A) Illustration of feedback circuit. The fluorophore FAM and the quencher BHQ are functionalized at either end of substrate strand R2. (B) Native PAGE analysis of feedback-circuit products. Lane 1, DNA complex Z3/T5/R2; lane 2, Unit1 complex Z3/T5/R2/P1; lane 3, products of Unit1 triggered by input I6; lane 4, Unit2 complex Z4/T1/R4; lane 5, products of Unit2 in presence of input I6; lane 6, products of Unit2 triggered by input I1; lane 7, mixture of Unit1 complex and Unit2 complex; lane 8, products of feedback circuit consisting of Unit1 and Unit2 triggered by input I6. (C) Time-dependent normalized fluorescence changes (ΔF/MaxΔF) during 10-h reaction process. The sample interval was 6 min. As baselines, curve (1) demonstrates the leakage level of Unit1 and curve (2) demonstrates the leakage level of feedback circuit in absence of trigger I6. Curve (1′)-(3′) demonstrate the Unit1 responses at different concentrations of I6 as 0.05, 0.1 and 0.15 μM, respectively. All data represent the average of three replicates. Error bars represent one standard deviation from triplicate analyses. (D) Time-dependent normalized fluorescence changes (ΔF/MaxΔF) during 10-h reaction process. The sample interval was 6 min. Curves (1)–(3) demonstrate the feedback-circuit responses at different concentrations of I6 as 0.05, 0.01, 0.15 μM, respectively. Curves (1′)–(3) demonstrate the Unit1 responses at different concentrations of I6 as 0.05, 0.1 and 0.15 μM, respectively. All data represent the average of three replicates. Error bars were not plotted to avoid curves overwriting each other. (E) Fluorescence signal analysis in form of bars. The columns 1–3 correspond to the normalized fluorescence changes (ΔF/MaxΔF) of the Unit1 triggered by input I6 at 0.05, 0.1, 0.15 μM, respectively, after 10 h. The columns 4–6 correspond to the normalized fluorescence changes (ΔF/MaxΔF) of feedback circuit triggered by I6 at 0.05, 0.1, 0.15 μM, respectively, after 10 h. And the relative fluorescence increase percentage (F2/F1%) was labeled at the top of bars in columns 4–6.
Figure 6.
Figure 6.
Simulative analysis for feedback circuit. (A) Illustration of stage evolution of circuit. (B) Time-dependent changes of concentrations of reactants, Unit1 and Unit2, during 10-h reaction process. (C) Time-dependent changes of concentrations of reactants, input strand I6, linker strand P1/I1′ and output complex Z3/L, during 10-h reaction process. Reaction stage was labeled on the top of the figure. The shaded area demonstrates the feedback effect of Unit2 to Unti1 in 10-h reaction process. (D) Time-dependent changes of reaction rates of reactants, logic units Unit1 and Unit2, during 10-h reaction process. (E) Time-dependent changes of reaction rates of reactants, input strand I6, linker strand P1/I1′ and output strand Z3/L, during 10-h reaction process. (F)–(I) present asymptotic analysis for the feedback circuit. (F) Time-dependent changes of concentrations of reactants, Unit1 and Unit2, during 400-h reaction process. (G) Time-dependent changes of concentrations of reactants, input strand I6, linker strand P1/I1′ and output complex Z3/L, during 400-h reaction process. The shaded area demonstrates the feedback effect of Unit2 to Unti1 in 400-h reaction process. (H) Time-dependent changes of reaction rates of reactants, Unit1 and Unit2, during 400-h reaction process. (I) Time-dependent changes of reaction rates of reactants, input strand I6, linker strand P1/I1′ and output strand Z3/L, during 400-h reaction process.

Similar articles

Cited by

References

    1. Abendroth J.M., Bushuyev O.S., Weiss P.S., Barrett C.J.. Controlling motion at the nanoscale: rise of the molecular machines. ACS Nano. 2015; 9:7746–7768. - PubMed
    1. Qian L., Winfree E., Bruck J.. Neural network computation with DNA strand displacement cascades. Nature. 2011; 475:368–372. - PubMed
    1. Li B., Ellington A.D., Chen X.. Rational, modular adaptation of enzyme-free DNA circuits to multiple detection methods. Nucleic Acids Res. 2011; 39:e110. - PMC - PubMed
    1. Ang Y.S., Tong R., Yung L.Y.L.. Engineering a robust DNA split proximity circuit with minimized circuit leakage. Nucleic Acids Res. 2016; 44:e121. - PMC - PubMed
    1. Chandrasekaran A.R., Levchenko O., Patel D.S., Macisaac M., Halvorsen K.. Addressable configurations of DNA nanostructures for rewritable memory. Nucleic Acids Res. 2017; 45:11459–11465. - PMC - PubMed

Publication types