. 2019 Sep 13;29(10):4277-4290.
doi: 10.1093/cercor/bhy310.

Roles of Ventromedial Prefrontal Cortex and Anterior Cingulate in Subjective Valuation of Prospective Effort

Affiliations

Roles of Ventromedial Prefrontal Cortex and Anterior Cingulate in Subjective Valuation of Prospective Effort

Patrick S Hogan et al. Cereb Cortex. .

Abstract

The perceived effort level of an action shapes everyday decisions. Despite the importance of these perceptions for decision-making, the behavioral and neural representations of the subjective cost of effort are not well understood. While a number of studies have implicated anterior cingulate cortex (ACC) in decisions about effort/reward trade-offs, none have experimentally isolated effort valuation from reward and choice difficulty, a function that is commonly ascribed to this region. We used functional magnetic resonance imaging to monitor brain activity while human participants engaged in uncertain choices for prospective physical effort. Our task was designed to examine effort-based decision-making in the absence of reward and separated from choice difficulty-allowing us to investigate the brain's role in effort valuation, independent of these other factors. Participants exhibited subjectivity in their decision-making, displaying increased sensitivity to changes in subjective effort as objective effort levels increased. Analysis of blood-oxygenation-level dependent activity revealed that the ventromedial prefrontal cortex (vmPFC) encoded the subjective valuation of prospective effort, and ACC activity was best described by choice difficulty. These results provide insight into the processes responsible for decision-making regarding effort, partly dissociating the roles of vmPFC and ACC in prospective valuation of effort and choice difficulty.

Keywords: anterior cingulate cortex; choice difficulty; effort; fMRI; ventromedial prefrontal cortex.


Figures

Figure 1.
Figure 1.
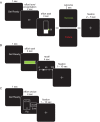
Experimental paradigm. (A) Association phase; participants were trained to associate numeric effort levels with force exerted on a hand clench dynamometer. Effort levels ranged from 0 (no force) to 100 (80% of maximum grip force). A training block consisted of 5 trials each at a series of target effort levels. Each trial began with presentation of the target, followed by an effortful grip with real-time visual feedback of the exerted force represented as a bar that increased in height with increased exertion. A green visual cue was also displayed, within which participants were instructed to maintain their exerted effort. Feedback of success or failure was provided at the end of each trial. (B) Recall phase; participants were instructed to fill a horizontal bar by gripping the transducer. On each trial, the full bar corresponded to a different target effort level that was unknown to participants. Successfully achieving the effort target resulted in the bar turning from red to green. Following exertion, participants used push buttons to move a cursor along a 0–100 number line to select the effort level they believed they had squeezed. No feedback was provided as to the accuracy of participants’ reported effort levels. (C) Choice phase; participants were presented a series of risky gambles which involved choosing between 2 options: exerting a low amount of effort with certainty (“sure”), or taking a gamble that could result in either a higher level of exertion or no exertion with equal probability (“flip”). Gambles were not realized following a choice. At the end of the choice phase, to ensure participants revealed their true preferences for effort, 10 choices were randomly selected and played out such that any effort required would need to be exerted before they completed the experiment.
Figure 2.
Figure 2.
Behavioral representations of subjective effort cost. (A) Results from the recall phase of the experiment, showing the mean and standard error across all participants for the effort levels reported plotted against the those tested. The dashed line is included to indicate perfect recall of exerted effort. (B) The function used to model the subjective cost of effort in a choice. This function has the form V(e)=(e)ρ. Each curve represents an individual’s cost function for effort. The dashed line is included to indicate an objective valuation of effort (ρ=1), with curves above this line representing that an incremental change in the effort level results in a greater subjective cost of that effort for higher effort levels. (C) Estimated ρ parameters at the participant level. Asterisks indicate a significant difference (P < 0.05) from the null hypothesis of objective valuation (ρ=1) using a likelihood ratio test statistic. (D) Propensity to accept the sure option as a function of RVsure. RVsure was partitioned into 8 bins and the mean and standard error of the acceptance rate within each bin is displayed.
Figure 3.
Figure 3.
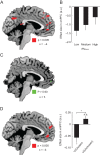
vmPFC encodes subjective effort valuation. (A) A region of vmPFC in which BOLD activity was positively correlated with the relative value of the sure option at the time of choice, with peak activity at Montreal Neurological Institute (MNI) coordinates (x, y, z) = [−4, 46, −2]. The contrast shown in red was obtained at P < 0.005 (uncorrected) with a 10-voxel extent threshold. This contrast is significant at P < 0.05, small volume corrected in an independent vmPFC ROI. (B) BOLD effect size within a 5-mm sphere centered at peak activity in vmPFC was positively correlated with the difference in utility between the 2 options (RVsure). This plot is not used for statistical inference (which was performed using an independent ROI analysis); it is shown solely to illustrate the trend of the BOLD signal in vmPFC. (C) Exceedance probability map (EPM) resulting from the Bayesian model comparison of objective and subjective effort valuation models. Voxels shown in green (n = 16) indicate locations in the brain where the probability that subjective effort describes the BOLD activity is greater than 0.90, supporting the finding that subjective effort cost best describes activity in vmPFC. (D) A region of vmPFC in which BOLD activity was negatively correlated with increasing subjective effort value of the chosen option (V(x)), with peak activity at MNI coordinates (x, y,z) = [−6, 46, −6]. The contrast shown in red was obtained at P < 0.005 (uncorrected) with a 10-voxel extent threshold. This contrast is significant at P < 0.05, small volume corrected in an independent vmPFC ROI. (E) BOLD effect size within our a priori vmPFC ROI for chosen V(chosen) and unchosen V(unchosen) effort value (*P < 0.05).
Figure 4.
Figure 4.
Model comparison for competing value models in vmPFC. Average exceedance probabilities across all voxels within our a priori vmPFC ROI showed that V(Chosen) was favored over RVsure and V(Chosen) - V(Unchosen). This indicates a higher likelihood of V(Chosen) describing vmPFC activity than these alternative models.
Figure 5.
Figure 5.
ACC encodes choice difficulty. (A) Regions of the brain in which BOLD activity was positively correlated with choice difficulty at the time of choice with peak activity at MNI coordinates (x, y, z) = [8, 12, 50]. The contrast shown in blue was obtained at P < 0.005 (uncorrected) with a 10-voxel extent threshold. This contrast is significant at P < 0.05, small volume corrected in an independent ACC ROI. (B) BOLD effect size within a 5 mm sphere centered at peak activity in was positively correlated choice difficulty. This plot is not used for statistical inference (which was performed using an independent ROI analysis); it is shown solely to illustrate the trend of the BOLD signal in ACC. (C) BOLD effect size within our a priori ACC ROI for choice difficulty and RVsure (***P < 0.001). (D) Average exceedance probabilities across all voxels within our a priori ACC ROI showed that choice difficulty was favored over RVsure. This indicates a higher likelihood of ACC activity describing choice difficulty than RVsure.
Figure 6.
Figure 6.
Model-based measures of choice difficulty in ACC. (A) ACC BOLD signal is associated with a stakes-normalized choice difficulty measure. This measure is estimated as the negative absolute difference between the gamble and sure options, normalized by the effort stakes (|RVobj|/(0.5(0.5F+S))). This metric accounts for the possibility that choice difficulty could be influenced by the magnitude of the effort options presented (analogous to the experimental increase in effort cost with increasing effort, captured by the effort utility function). The contrast shown in blue was obtained at P < 0.005 (uncorrected) with a 10-voxel extent threshold. (B) ACC BOLD signal is associated with −|RVsure|. Choice difficulty is estimated as the negative absolute difference between the gamble and sure options (−|RVsure|). This model also included log(RT) to account for behavioral noise captured by response time. The contrast shown in blue was obtained at P < 0.005 (uncorrected) with a 10-voxel extent threshold.

Similar articles

Cited by

References

    1. Abeler J, Falk A, Goette L, Huffman D. 2011. Reference points and effort provision. Am Econ Rev. 101:470–492.
    1. Augenblick N, Niederle M, Sprenger C. 2015. Working over time: dynamic inconsistency in real effort tasks. Q J Econ. 130(3):1067–1115.
    1. Ballard K, Knutson B. 2009. Dissociable neural representations of future reward magnitude and delay during temporal discounting. Neuroimage. 45:143–150. - PMC - PubMed
    1. Bartra O, McGuire JT, Kable JW. 2013. The valuation system: a coordinate-based meta-analysis of BOLD fMRI experiments examining neural correlates of subjective value. Neuroimage. 76:412–427. - PMC - PubMed
    1. Basten U, Biele G, Heekeren HR, Fiebach CJ. 2010. How the brain integrates costs and benefits during decision making. Proc Natl Acad Sci U S A. 107:21767–21772. - PMC - PubMed

Publication types