

Altered sleep architecture, rapid eye movement sleep, and neural oscillation in a mouse model of human chromosome 16p11.2 microdeletion
- PMID: 30541142
- PMCID: PMC7850008
- DOI: 10.1093/sleep/zsy253
Altered sleep architecture, rapid eye movement sleep, and neural oscillation in a mouse model of human chromosome 16p11.2 microdeletion
Abstract
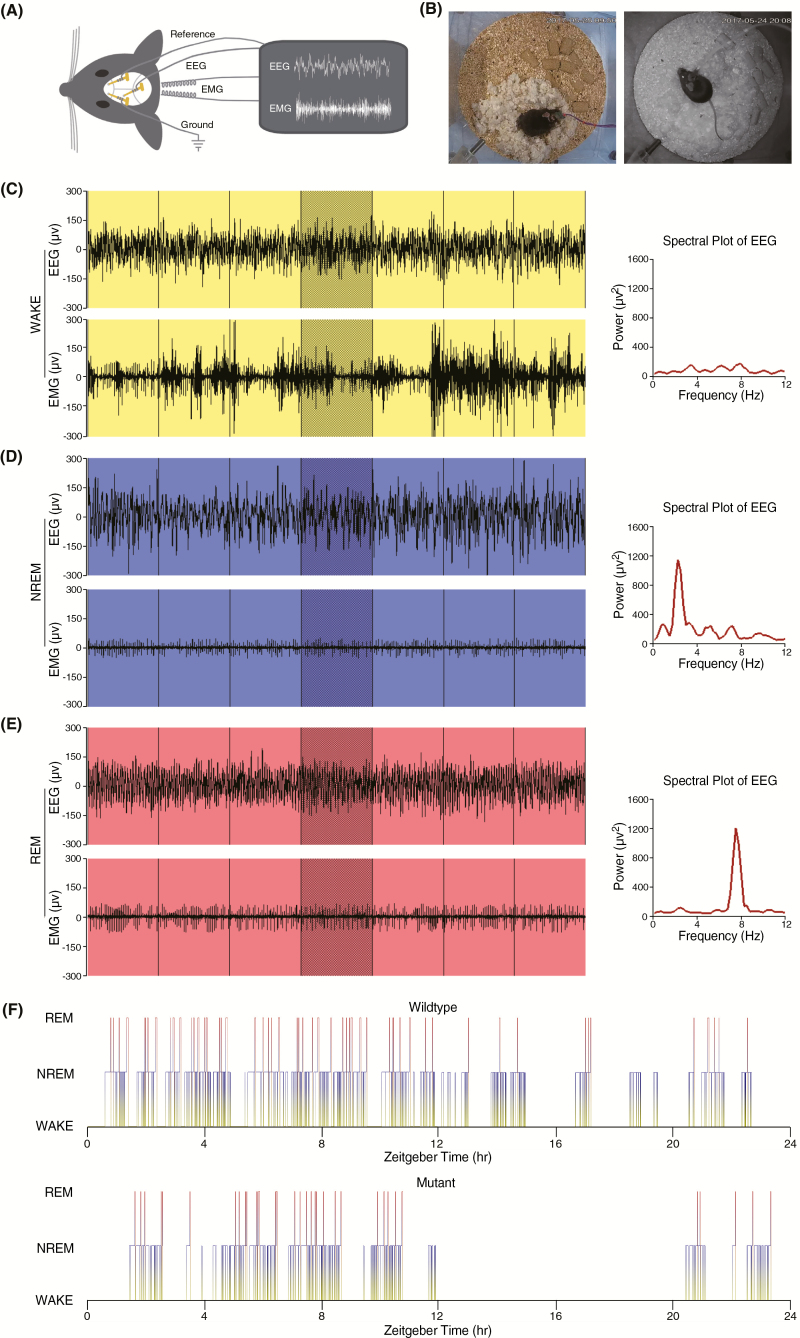
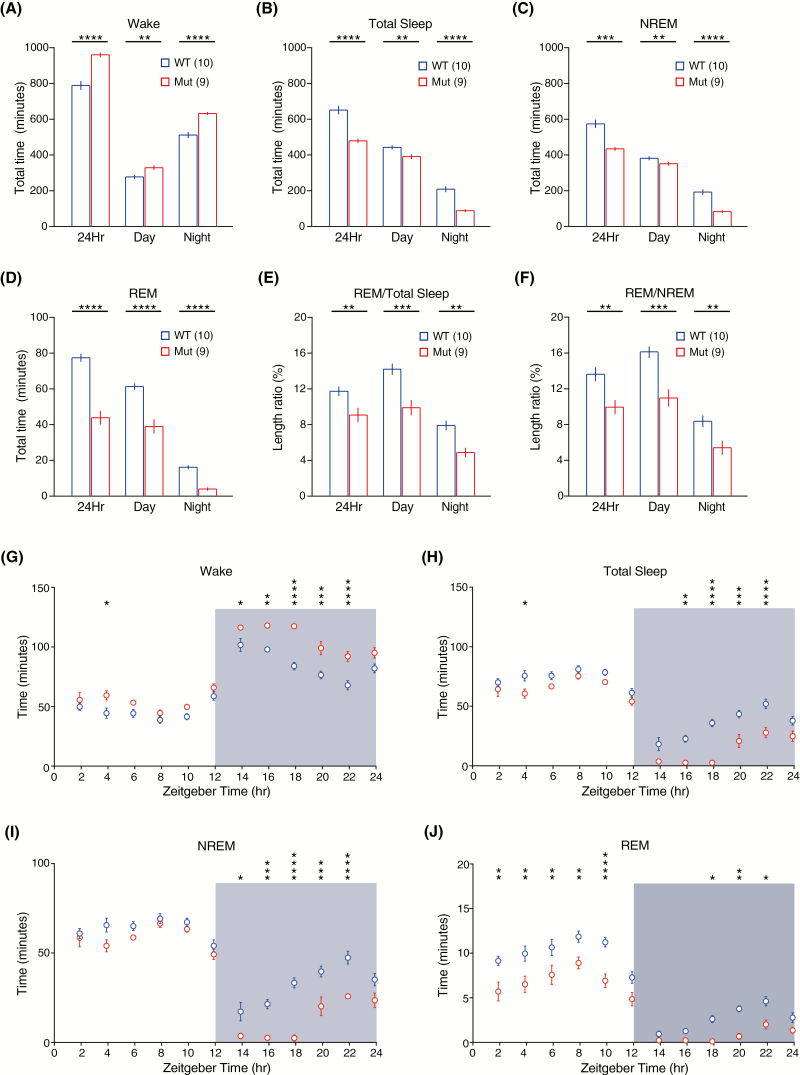
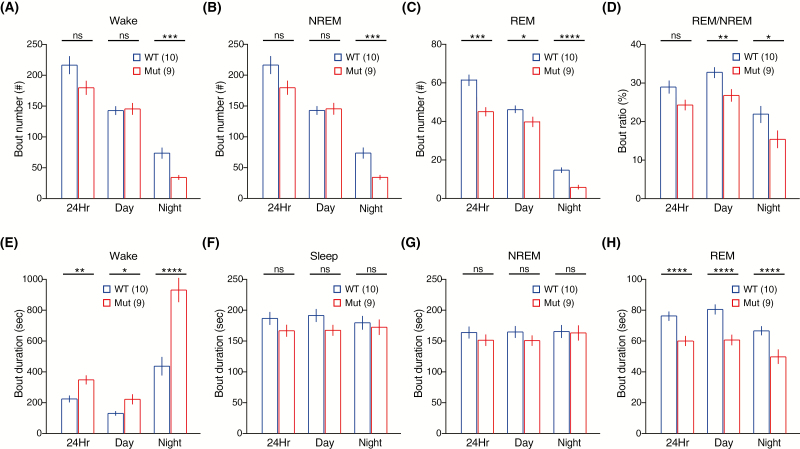
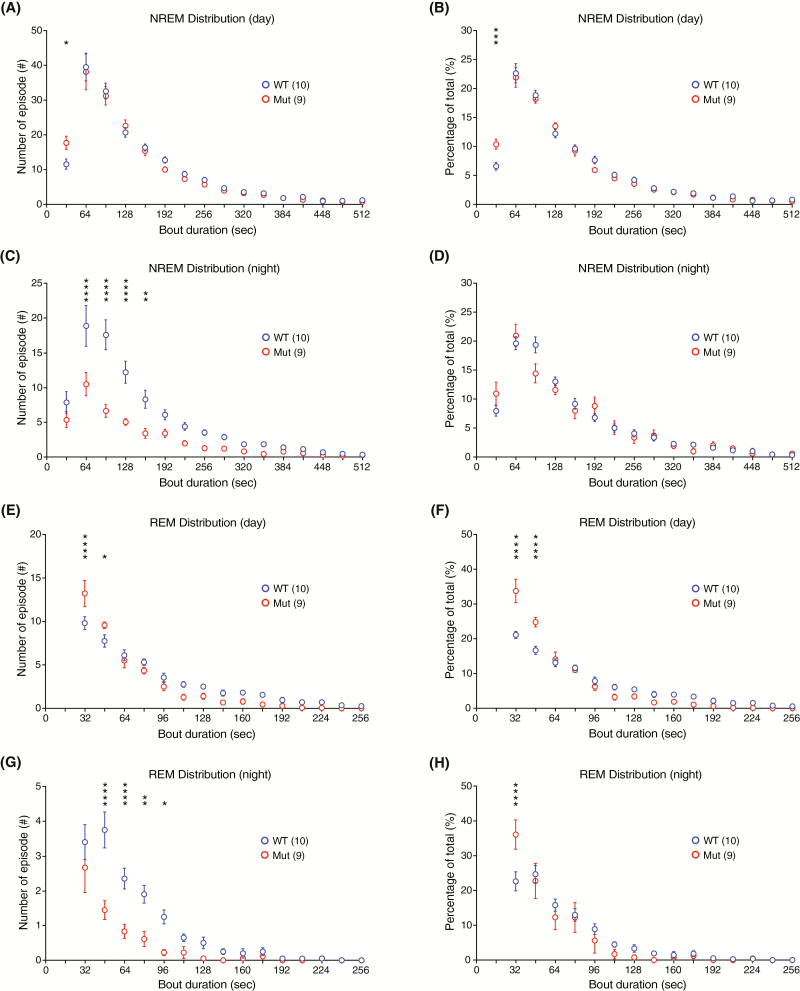
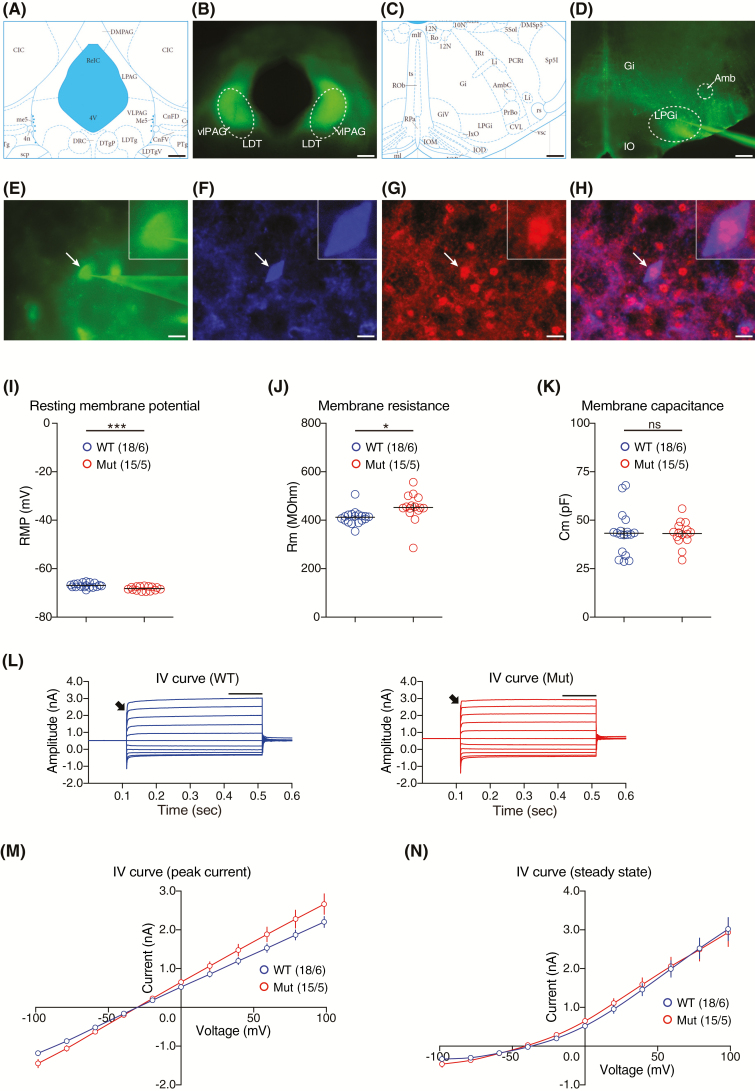
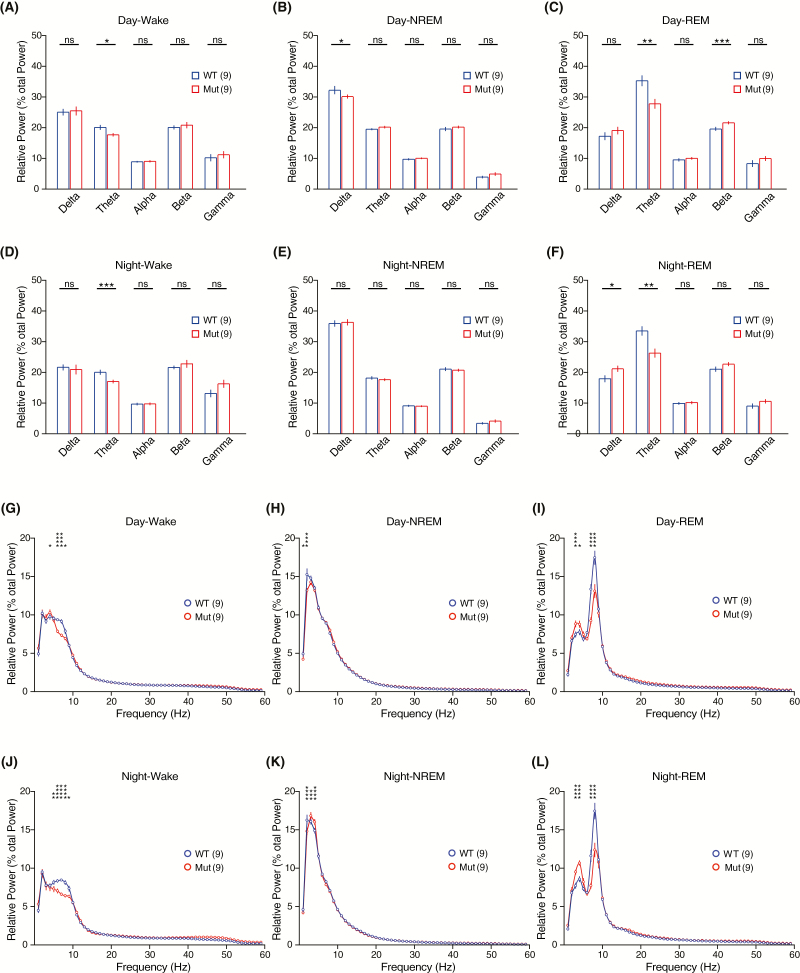
Sleep abnormalities are common among children with neurodevelopmental disorders. The human chr16p11.2 microdeletion is associated with a range of neurological and neurobehavioral abnormalities. Previous studies of a mouse model of human chr16p11.2 microdeletion (chr16p11.2df/+) have demonstrated pathophysiological changes at the synapses in the hippocampus and striatum; however, the impact of this genetic abnormality on system level brain functions, such as sleep and neural oscillation, has not been adequately investigated. Here, we show that chr16p11.2df/+ mice have altered sleep architecture, with increased wake time and reduced time in rapid eye movement (REM) and non-REM (NREM) sleep. Importantly, several measurements of REM sleep are significantly changed in deletion mice. The REM bout number and the bout number ratio of REM to NREM are decreased in mutant mice, suggesting a deficit in REM-NREM transition. The average REM bout duration is shorter in mutant mice, indicating a defect in REM maintenance. In addition, whole-cell patch clamp recording of the ventrolateral periaqueductal gray (vlPAG)-projecting gamma-aminobutyric acid (GABA)ergic neurons in the lateral paragigantocellular nucleus of ventral medulla of mutant mice reveal that these neurons, which are important for NREM-REM transition and REM maintenance, have hyperpolarized resting membrane potential and increased membrane resistance. These changes in intrinsic membrane properties suggest that these projection-specific neurons of mutant mice are less excitable, and thereby may play a role in deficient NREM-REM transition and REM maintenance. Furthermore, mutant mice exhibit changes in neural oscillation involving multiple frequency classes in several vigilance states. The most significant alterations occur in the theta frequency during wake and REM sleep.
Keywords: GABAergic neurons; LPGi; REM sleep; chr16p11.2 microdeletion; neural oscillation; theta rhythm; vlPAG.
© Sleep Research Society 2018. Published by Oxford University Press on behalf of the Sleep Research Society. All rights reserved. For permissions, please e-mail journals.permissions@oup.com.
Figures
Similar articles
-
Regulation of REM and Non-REM Sleep by Periaqueductal GABAergic Neurons.Nat Commun. 2018 Jan 24;9(1):354. doi: 10.1038/s41467-017-02765-w. Nat Commun. 2018. PMID: 29367602 Free PMC article.
-
Altered synaptic transmission and maturation of hippocampal CA1 neurons in a mouse model of human chr16p11.2 microdeletion.J Neurophysiol. 2018 Mar 1;119(3):1005-1018. doi: 10.1152/jn.00306.2017. Epub 2017 Dec 6. J Neurophysiol. 2018. PMID: 29212915 Free PMC article.
-
Contribution of mGluR5 to pathophysiology in a mouse model of human chromosome 16p11.2 microdeletion.Nat Neurosci. 2015 Feb;18(2):182-4. doi: 10.1038/nn.3911. Epub 2015 Jan 12. Nat Neurosci. 2015. PMID: 25581360 Free PMC article.
-
Not a single but multiple populations of GABAergic neurons control sleep.Sleep Med Rev. 2017 Apr;32:85-94. doi: 10.1016/j.smrv.2016.03.002. Epub 2016 Mar 12. Sleep Med Rev. 2017. PMID: 27083772 Review.
-
[Neurochemical mechanisms of sleep regulation].Glas Srp Akad Nauka Med. 2009;(50):97-109. Glas Srp Akad Nauka Med. 2009. PMID: 20666118 Review. Serbian.
Cited by
-
Sleep disorders in Alzheimer's disease: the predictive roles and potential mechanisms.Neural Regen Res. 2021 Oct;16(10):1965-1972. doi: 10.4103/1673-5374.308071. Neural Regen Res. 2021. PMID: 33642368 Free PMC article. Review.
-
Daily oscillation of the excitation/inhibition ratio is disrupted in two mouse models of autism.iScience. 2024 Dec 5;28(1):111494. doi: 10.1016/j.isci.2024.111494. eCollection 2025 Jan 17. iScience. 2024. PMID: 39850357 Free PMC article.
-
Circuit mechanism underlying fragmented sleep and memory deficits in 16p11.2 deletion mouse model of autism.iScience. 2024 Oct 28;27(12):111285. doi: 10.1016/j.isci.2024.111285. eCollection 2024 Dec 20. iScience. 2024. PMID: 39628570 Free PMC article.
-
Circuit mechanism underlying fragmented sleep and memory deficits in 16p11.2 deletion mouse model of autism.bioRxiv [Preprint]. 2024 May 21:2023.12.26.573156. doi: 10.1101/2023.12.26.573156. bioRxiv. 2024. Update in: iScience. 2024 Oct 28;27(12):111285. doi: 10.1016/j.isci.2024.111285. PMID: 38234815 Free PMC article. Updated. Preprint.
-
Investigating the contributions of circadian pathway and insomnia risk genes to autism and sleep disturbances.Transl Psychiatry. 2022 Oct 3;12(1):424. doi: 10.1038/s41398-022-02188-2. Transl Psychiatry. 2022. PMID: 36192372 Free PMC article.
References
-
- Wiggs L, et al. . Sleep patterns and sleep disorders in children with autistic spectrum disorders: insights using parent report and actigraphy. Dev Med Child Neurol. 2004;46(6):372–380. - PubMed
-
- Godbout R, et al. . A laboratory study of sleep in Asperger’s syndrome. Neuroreport. 2000;11(1):127–130. - PubMed
-
- Allik H, et al. . Sleep patterns of school-age children with Asperger syndrome or high-functioning autism. J Autism Dev Disord. 2006;36(5):585–595. - PubMed
