. 2019 Feb 28;47(4):1706-1724.
doi: 10.1093/nar/gky1238.

Factor cooperation for chromosome discrimination in Drosophila

Affiliations

Factor cooperation for chromosome discrimination in Drosophila

Christian Albig et al. Nucleic Acids Res. .

Abstract

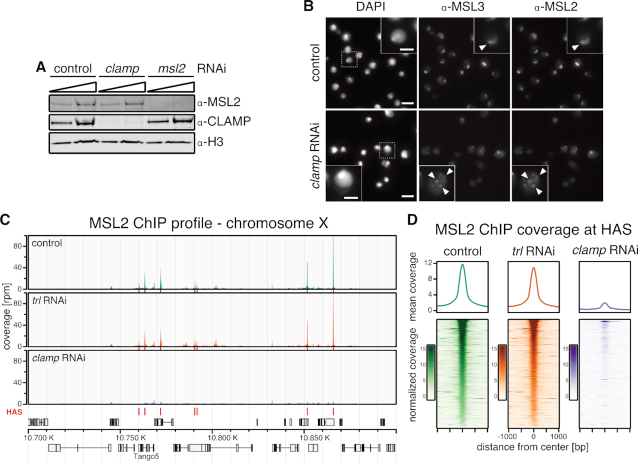
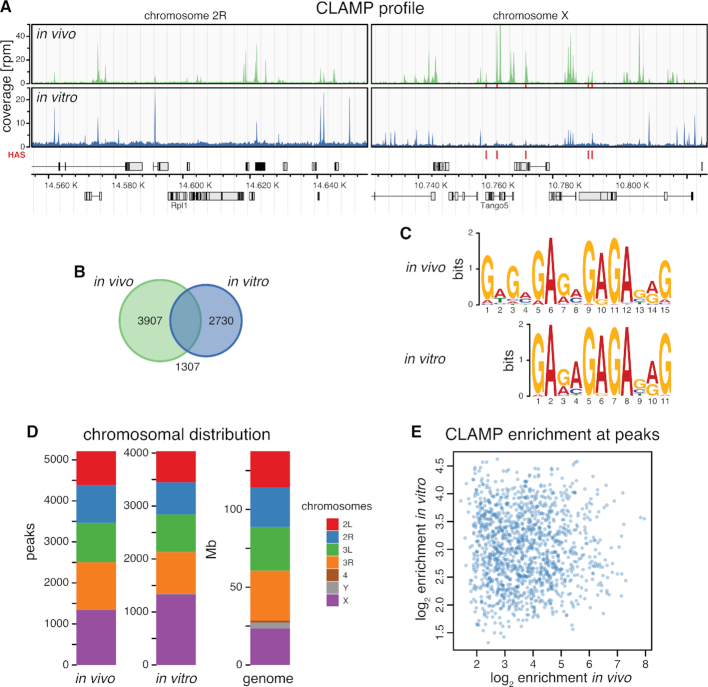
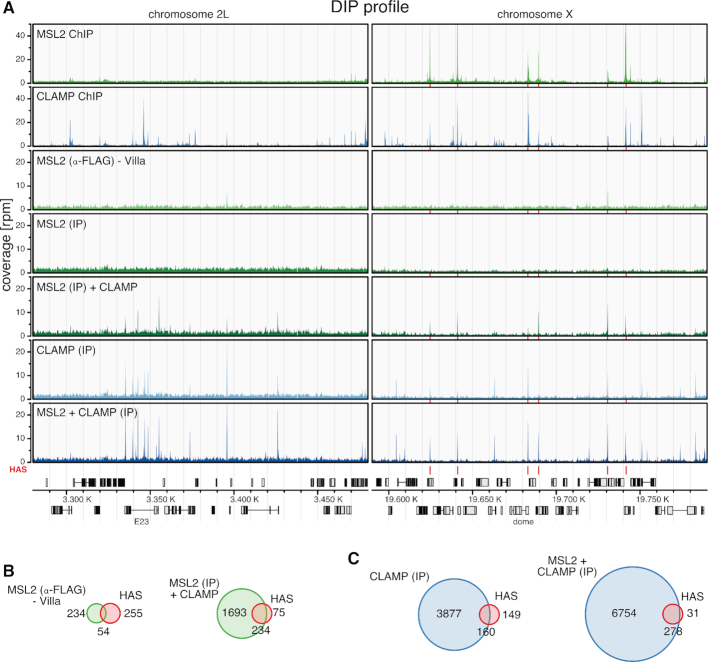
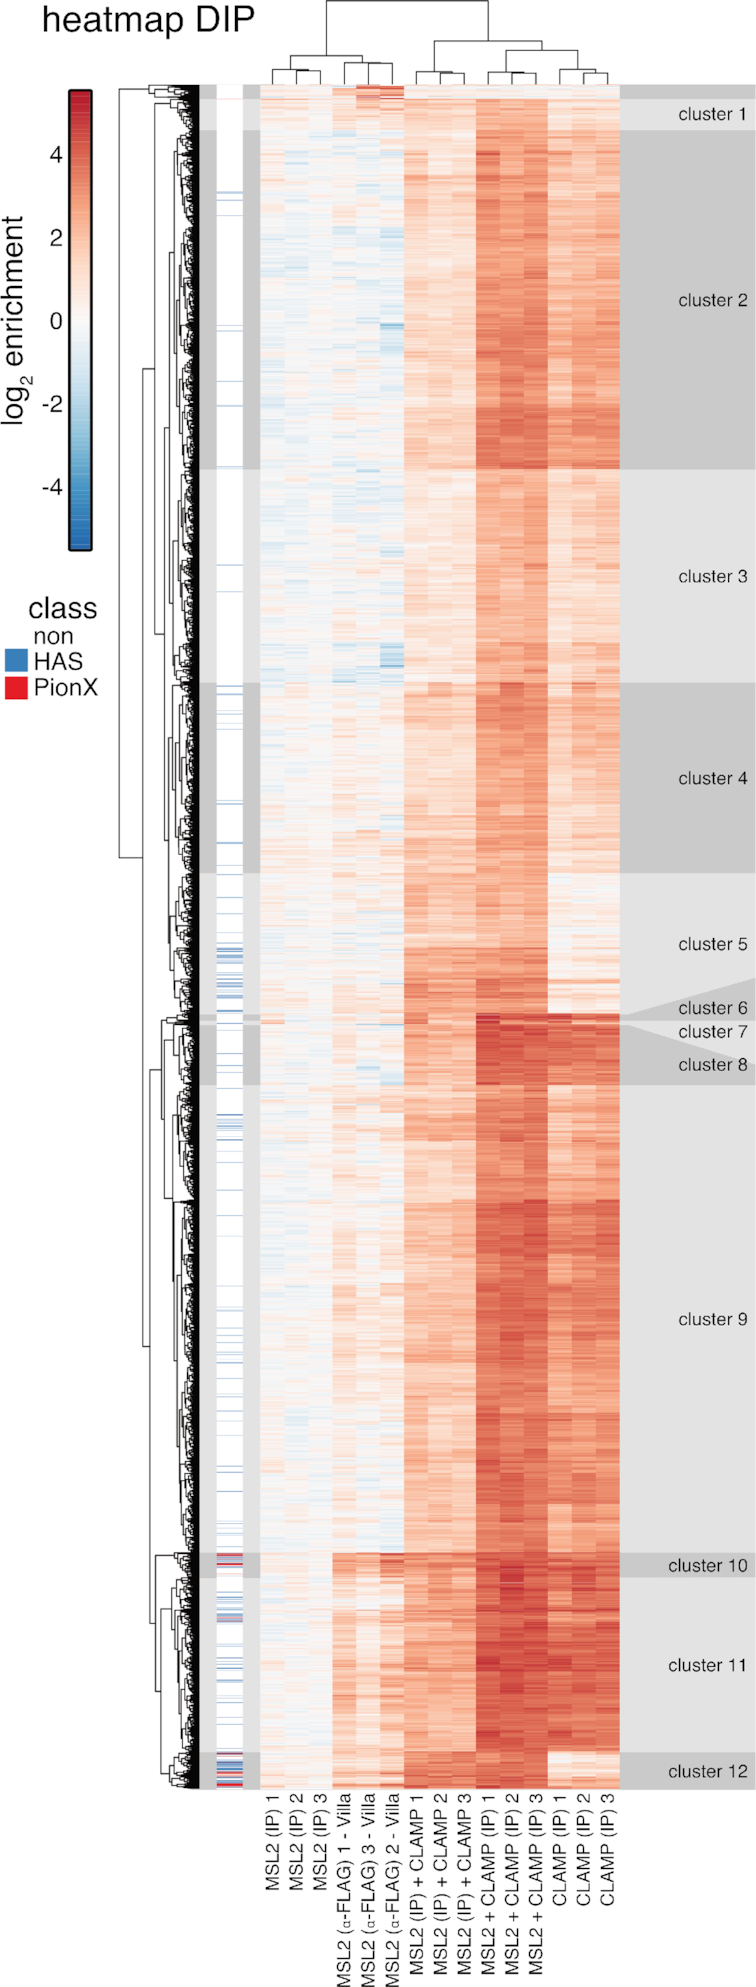
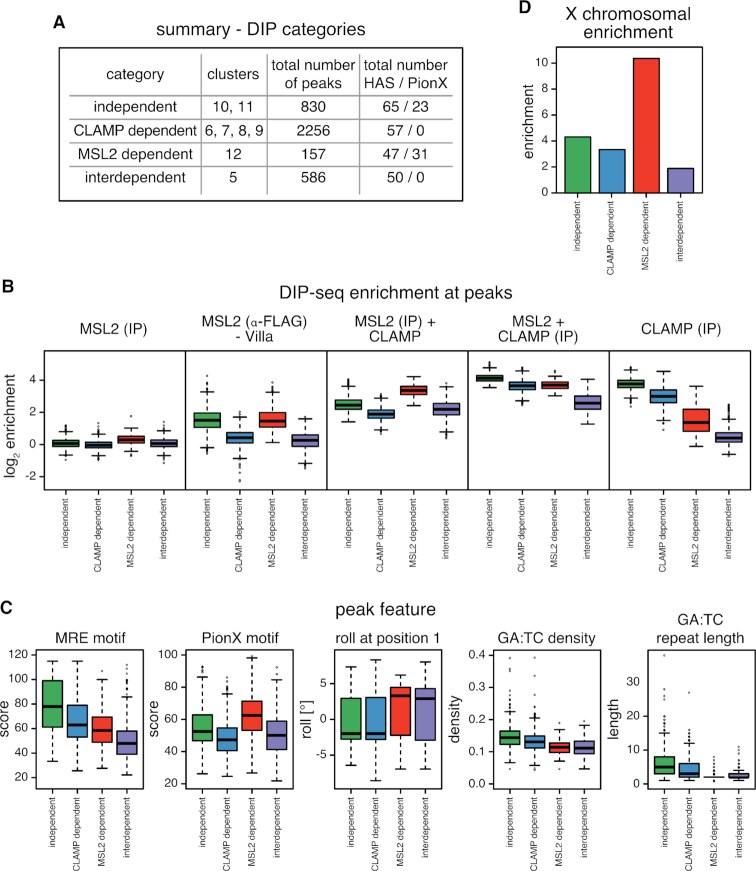
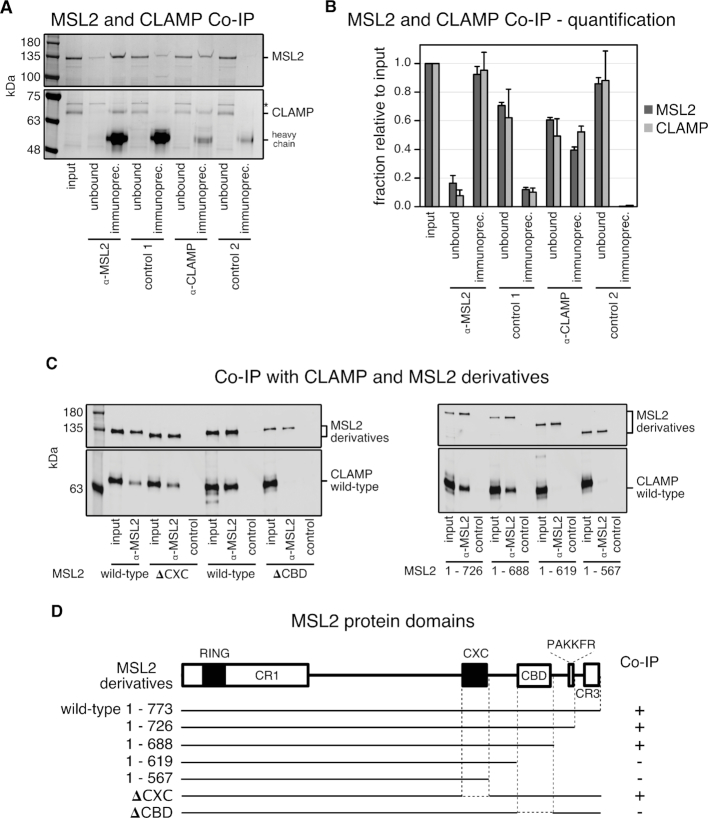
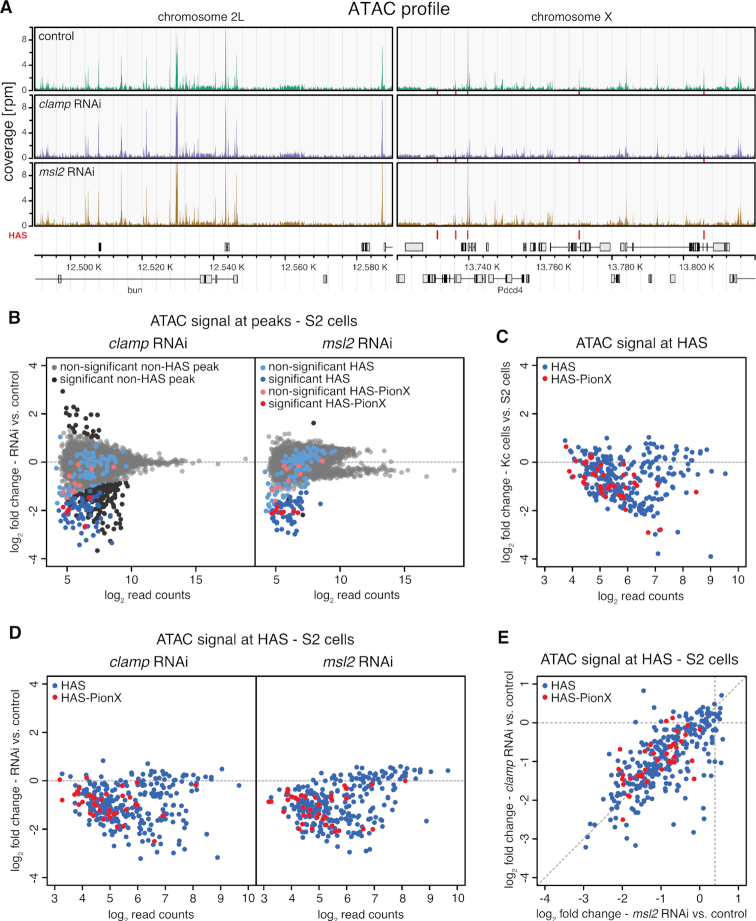
Transcription regulators select their genomic binding sites from a large pool of similar, non-functional sequences. Although general principles that allow such discrimination are known, the complexity of DNA elements often precludes a prediction of functional sites. The process of dosage compensation in Drosophila allows exploring the rules underlying binding site selectivity. The male-specific-lethal (MSL) Dosage Compensation Complex (DCC) selectively binds to some 300 X chromosomal 'High Affinity Sites' (HAS) containing GA-rich 'MSL recognition elements' (MREs), but disregards thousands of other MRE sequences in the genome. The DNA-binding subunit MSL2 alone identifies a subset of MREs, but fails to recognize most MREs within HAS. The 'Chromatin-linked adaptor for MSL proteins' (CLAMP) also interacts with many MREs genome-wide and promotes DCC binding to HAS. Using genome-wide DNA-immunoprecipitation we describe extensive cooperativity between both factors, depending on the nature of the binding sites. These are explained by physical interaction between MSL2 and CLAMP. In vivo, both factors cooperate to compete with nucleosome formation at HAS. The male-specific MSL2 thus synergises with a ubiquitous GA-repeat binding protein for refined X/autosome discrimination.


Figures

Figure 1.
Figure 1.
Binding of MSL2 to HAS in male S2 cells depends on CLAMP. (A) Western blot detection of MSL2, CLAMP and H3 in whole cell extracts from S2 cells after msl2 or clamp RNAi. An irrelevant RNAi directed against green fluorescent protein (gfp) or Schistosoma japonicum glutathione-S-transferase (gst) sequences serve as control for these and further experiments. (B) Immunofluorescence microscopy of MSL2 and MSL3 in control cells and upon clamp RNAi. A region of zoom-in is marked by dashed rectangle. Scale bar: 10 μm (5 μm in inset). White arrow heads indicate the X chromosomal territory in control cells and speckles of MSL2 and MSL3 co-localization in clamp RNAi. (C) Genome browser profile of MSL2 ChIP-seq showing mean coverage (control cells n = 3, trl RNAi: n = 3, clamp RNAi: n = 4) along a representative 200 kb window on the X chromosome. Red bars above the gene models indicate location of HAS. (D) Average profile and heat map of mean MSL2 ChIP-seq coverage (control cells n = 3, trl RNAi: n = 3, clamp RNAi: n = 4) in a 2 kb window centered on 309 HAS as indicated. Heat maps are sorted by decreasing MSL2 enrichment in peak region in the control data.
Figure 2.
Figure 2.
CLAMP selects GA-rich consensus sequence motifs in vitro. (A) Genome browser profile of in vivo CLAMP ChIP-seq (upper panel) and in vitro CLAMP DIP-seq (lower panel) (mean coverages, n = 3 each) along representative 200 kb windows on chromosome 2R and X. Red bars above the gene models indicate positions of HAS. (B) Venn diagram of robust peak sets from in vivo CLAMP ChIP-seq (n = 5214) and in vitro CLAMP DIP-seq (n = 4037). (C) De novo discovered motifs from robust peak sets as in (B). (D) Bar chart of chromosomal distribution of robust peak sets as in (B). The chromosome sizes serve as reference for uniform distribution (genome). (E) Scatterplot of in vitro CLAMP DIP-seq mean log2 enrichment (n = 3) against in vivo CLAMP ChIP-seq mean log2 enrichment (n = 3) at 1307 overlapping peak regions displayed on (B).
Figure 3.
Figure 3.
Intrinsic DNA binding cooperativity between CLAMP and MSL2 in vitro. (A) Genome browser profile showing genomic MSL2 and CLAMP binding profiles as indicated. The MSL2 and CLAMP in vivo ChIP-seq (top 2 profiles) and in vitro DIP-seq profiles (bottom five profiles) represent mean coverages (n = 3) along representative 200 kb windows on chromosome 2L and X. In vitro DIP-seq panels depict the following conditions from top to bottom: MSL2 with α-FLAG IP from Villa et al. (22) as proxy for MSL2 in vitro binding, MSL2 with α-MSL2 IP, MSL2 plus CLAMP with α-MSL2 IP, CLAMP with α-CLAMP IP and MSL2 plus CLAMP with α-CLAMP IP. Red bars above the gene model and between the panels indicate positions of HAS. (B) Venn diagrams relating robust peak sets from in vitro DIP-seq (green) to HAS (red, n = 309). Left panel: MSL2 with α-FLAG IP from Villa et al. (22) as proxy for MSL2 in vitro binding (n = 288, overlapping n = 54). Right panel: MSL2 plus CLAMP with α-MSL2 IP (n = 1972, overlapping n = 234). (C) Venn diagrams relating robust peak sets from in vitro DIP-seq (blue) to HAS (red, n = 309). Left panel: CLAMP with α-CLAMP IP (n = 4037, overlapping n = 160). Right panel: MSL2 plus CLAMP with α-CLAMP IP (n = 7032, overlapping n = 278).
Figure 4.
Figure 4.
Genome-wide DNA binding of CLAMP and MSL2 in vitro. Clustered heat map of in vitro DIP-seq signal enrichment from reactions containing either MSL2 or CLAMP alone, or both proteins, as follows—the target of immunoprecipitation (IP) is indicated in brackets: MSL2 (IP α-FLAG) from Villa et al. (22) as proxy for MSL2 in vitro binding; MSL2 (IP α-MSL2), MSL2 and CLAMP (IP α-MSL2); CLAMP (IP α-CLAMP); MSL2 and CLAMP (IP α-CLAMP) at all combined robust peaks (n = 7119). For each reaction three independent replicates are shown. Hierarchical clustering revealed 18 clusters. Clusters 1–12 had distinct MSL2 and CLAMP binding properties, the remaining six clusters at top of the heat map are small and show inconsistent enrichment between MSL2 with α-FLAG IP replicates.
Figure 5.
Figure 5.
Cooperation between CLAMP and MSL2 in genome-wide DNA binding in vitro. (A) Summary of distinct binding properties discovered in the heat map (Figure 4). Clusters were assigned into four categories: independent, CLAMP-dependent, MSL2-dependent and interdependent. (B) Boxplot of mean log2 enrichment (n = 3) of in vitro DIP-seq at peaks grouped by the four categories described in (A) for MSL2 (IP α-MSL2), MSL2 (IP α-FLAG) from Villa et al., MSL2 and CLAMP (IP α-MSL2); CLAMP (IP α-CLAMP); MSL2 and CLAMP (IP α-CLAMP). (C) Boxplot of peak features grouped by the four categories described in (A). Panels from left to right show: score for the best matching MRE motif; score for the best matching PionX motif; the roll at position 1 of the best matching PionX motif; the density of GA:TC dinucleotides and the length of GA:TC repeats. (D) Bar chart of X chromosomal enrichment of peaks grouped by the four categories described in (A).
Figure 6.
Figure 6.
A conserved C-terminal region in MSL2 is responsible for CLAMP binding. (A) SDS-PAGE analysis with Coomassie staining of co-IP fractions. Purified wild-type recombinant MSL2-FLAG and CLAMP-FLAG were immunoprecipitated with α-MSL2 serum and the corresponding pre-immune serum as control (control 1), and with affinity-purified α-CLAMP antibody mixed into an irrelevant rabbit serum and with the irrelevant rabbit serum only as control 2. The corresponding unbound fractions are loaded next to each IP. A contaminant present in the MSL2 preparation is labeled with asterisk. Molecular weight markers are shown to the left. (B) Bar chart of the quantification from co-IP experiments as in (A), combining data from three independent MSL2-FLAG and CLAMP-FLAG purifications. The amount of each protein in the unbound fractions and IP’s were quantified relative to the input. Error bars represent the standard deviation (n = 3). (C) Quantitative western blot analysis using α-FLAG antibody of co-IP experiments with extracts from Sf21 cells expressing wild-type CLAMP-FLAG and various MSL2-FLAG C-terminal deletion mutants. Co-IP was performed with α-MSL2 serum and the corresponding pre-immune serum as control [control 1 in (A)]. IP fractions were loaded next to each corresponding input. (D) Summary of MSL2 and CLAMP interaction from co-IP experiments presented in (C). Interactions with a CLAMP/MSL2 ratio in α-FLAG western blot analysis between 0.3 and 1.7 are depicted by (+) and no detectable interaction by (−). The MSL2 domain architecture is drawn to scale. White rectangles represent the conserved regions: CR1, CBD [CR2] and CR3 (Supplementary Figures S7B and 10). Black rectangles represent the RING and CXC domains.
Figure 7.
Figure 7.
MSL2 and CLAMP synergize to keep HAS accessible in male cells. (A) Genome browser profile of ATAC-seq showing mean coverages (n = 3) along representative 100 kb windows on chromosome 2L and X. The panels show control S2 cells and cells after clamp RNAi or msl2 RNAi as indicated. Red bars above the gene models and between the panels mark positions of HAS. (B) Scatter plot of mean log2 fold-change (n = 3) of ATAC-seq signal in S2 cells upon clamp RNAi (left panel) and msl2 RNAi versus controls (right panel) against mean log2 read count in control at robust ATAC peaks (n = 8913). HAS non-overlapping with PionX sites (HAS) are marked in blue and HAS overlapping with PionX sites (HAS-PionX) are marked red (the remaining sites are displayed in gray). Sites with statistically significant different ATAC signal between RNAi and control conditions (|lfc| > 0.5 and fdr < 0.1) are marked in darker color. For clamp RNAi, 258 ATAC peaks are statistically significant different between conditions, including 61 HAS and 6 HAS-PionX. For msl2 RNAi, 61 ATAC peaks are statistically significant different between conditions, including 49 HAS and 7 HAS-PionX. (C) Scatter plot of mean log2 fold-change (n = 4) of ATAC-seq signal in Kc cells versus S2 cells against mean log2 read count in S2 cells at HAS (n = 309). HAS non-overlapping with PionX sites (HAS, n = 272) are marked in blue and overlapping with PionX sites (HAS-PionX, n = 37) are marked in red. (D) Scatter plot of mean log2 fold-change (n = 3) of ATAC-seq signal in S2 cells upon clamp RNAi (left panel) and msl2 RNAi versus controls (right panel) against mean log2 read count in control at HAS (n = 309). HAS non-overlapping with PionX sites (HAS, n = 272) are marked in blue and overlapping with PionX sites (HAS-PionX, n = 37) are marked red. (E) Scatter plot of mean log2 fold-change (n = 3) of ATAC-seq signal in S2 cells upon clamp RNAi (left panel) against msl2 RNAi versus controls (right panel) at HAS (n = 309), as shown in (D).

References

    1. Mirny L.A. Nucleosome-mediated cooperativity between transcription factors. Proc. Natl. Acad. Sci. U.S.A. 2010; 107:22534–22539. - PMC - PubMed
    1. Jolma A., Yin Y., Nitta K.R., Dave K., Popov A., Taipale M., Enge M., Kivioja T., Morgunova E., Taipale J.. DNA-dependent formation of transcription factor pairs alters their binding specificity. Nature. 2015; 527:384–388. - PubMed
    1. Watson L.C., Kuchenbecker K.M., Schiller B.J., Gross J.D., Pufall M.A., Yamamoto K.R.. The glucocorticoid receptor dimer interface allosterically transmits sequence-specific DNA signals. Nat. Struct. Mol. Biol. 2013; 20:876–883. - PMC - PubMed
    1. Slattery M., Zhou T., Yang L., Dantas Machado A.C., Gordan R., Rohs R.. Absence of a simple code: how transcription factors read the genome. Trends Biochem. Sci. 2014; 39:381–399. - PMC - PubMed
    1. Dror I., Golan T., Levy C., Rohs R., Mandel-Gutfreund Y.. A widespread role of the motif environment in transcription factor binding across diverse protein families. Genome Res. 2015; 25:1268–1280. - PMC - PubMed

Publication types