

Genetic basis of heterosis for yield and yield components explored by QTL mapping across four genetic populations in upland cotton
- PMID: 30541432
- PMCID: PMC6292039
- DOI: 10.1186/s12864-018-5289-2
Genetic basis of heterosis for yield and yield components explored by QTL mapping across four genetic populations in upland cotton
Abstract
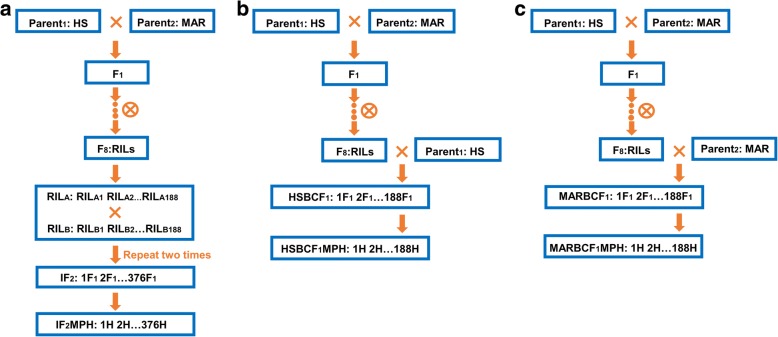
Background: Quantitative trait loci (QTL) mapping provides a powerful tool to unravel the genetic bases of cotton yield and its components, as well as their heterosis. In the present study, the genetic basis underlying inbreeding depression and heterosis for yield and yield components of upland cotton was investigated in recombinant inbred line (RIL), immortalized F2 (IF2), and two backcross (BCF1) populations based on a high-density SNP linkage map across four environments.
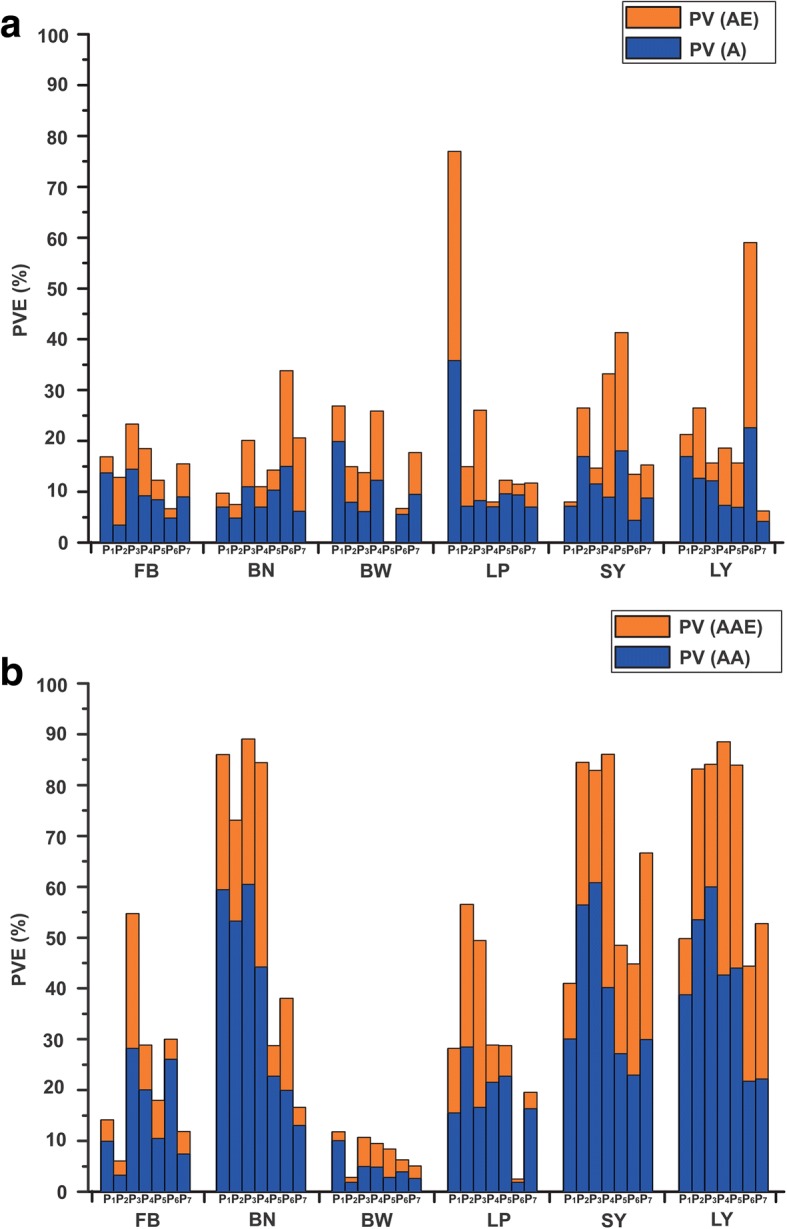
Results: Significant inbreeding depression of fruit branches per plant (FB), boll numbers per plant (BN), seed cotton yield (SY), and lint yield (LY) in RIL population and high levels of heterosis for SY, LY, and boll weight (BW) in IF2 and two BCF1 populations were observed. A total of 285 QTLs were identified in the four related populations using a composite interval mapping approach. In the IF2 population, 26.60% partially dominant (PD) QTLs and 71.28% over-dominant (OD) QTLs were identified. In two BCF1 populations, 42.41% additive QTLs, 4.19% PD QTLs, and 53.40% OD QTLs were detected. For multi-environment analysis, phenotypic variances (PV) explained by e-QTLs were higher than those by m-QTLs in each of the populations, and the average PV of m-QTLs and e-QTLs explained by QTL × environment interactions occupied a considerable proportion of total PV in all seven datasets.
Conclusions: At the single-locus level, the genetic bases of heterosis varied in different populations. Partial dominance and over-dominance were the main cause of heterosis in the IF2 population, while additive effects and over-dominance were the main genetic bases of heterosis in two BCF1 populations. In addition, the various genetic components to heterosis presented trait specificity. In the multi-environment model analysis, epistasis was a common feature of most loci associated with inbreeding depression and heterosis. Furthermore, the environment was a critical factor in the expression of these m-QTLs and e-QTLs. Altogether, additive effects, over-dominance, epistasis and environmental interactions all contributed to the heterosis of yield and its components in upland cotton, with over-dominance and epistasis more important than the others.
Keywords: Backcross population; Epistasis; Hybrid; Immortalized F2 population; Inbreeding depression; Over-dominance.
Conflict of interest statement
Ethics approval and consent to participate
Not applicable.
Consent for publication
Not applicable.
Competing interests
The authors declare that they have no competing interests.
Publisher’s Note
Springer Nature remains neutral with regard to jurisdictional claims in published maps and institutional affiliations.
Figures
Similar articles
-
Partial Dominance, Overdominance, Epistasis and QTL by Environment Interactions Contribute to Heterosis in Two Upland Cotton Hybrids.G3 (Bethesda). 2015 Dec 29;6(3):499-507. doi: 10.1534/g3.115.025809. G3 (Bethesda). 2015. PMID: 26715091 Free PMC article.
-
Epistasis together with partial dominance, over-dominance and QTL by environment interactions contribute to yield heterosis in upland cotton.Theor Appl Genet. 2016 Jul;129(7):1429-1446. doi: 10.1007/s00122-016-2714-2. Epub 2016 May 2. Theor Appl Genet. 2016. PMID: 27138784
-
QTL Mapping and Heterosis Analysis for Fiber Quality Traits Across Multiple Genetic Populations and Environments in Upland Cotton.Front Plant Sci. 2018 Oct 15;9:1364. doi: 10.3389/fpls.2018.01364. eCollection 2018. Front Plant Sci. 2018. PMID: 30374360 Free PMC article.
-
Genome-wide association study reveals novel quantitative trait loci and candidate genes of lint percentage in upland cotton based on the CottonSNP80K array.Theor Appl Genet. 2022 Jul;135(7):2279-2295. doi: 10.1007/s00122-022-04111-1. Epub 2022 May 16. Theor Appl Genet. 2022. PMID: 35570221 Review.
-
Heterosis: revisiting the magic.Trends Genet. 2007 Feb;23(2):60-6. doi: 10.1016/j.tig.2006.12.006. Epub 2006 Dec 22. Trends Genet. 2007. PMID: 17188398 Review.
Cited by
-
Association between HMGB1 genetic variants and ischemic stroke susceptibility, onset age, and recurrence risk among Chinese Han individuals.Am J Transl Res. 2023 May 15;15(5):3326-3341. eCollection 2023. Am J Transl Res. 2023. PMID: 37303653 Free PMC article.
-
Dissecting the genetic architecture of seed-cotton and lint yields in Upland cotton using genome-wide association mapping.Breed Sci. 2019 Dec;69(4):611-620. doi: 10.1270/jsbbs.19057. Epub 2019 Sep 14. Breed Sci. 2019. PMID: 31988625 Free PMC article.
-
Molecular basis of heterosis and related breeding strategies reveal its importance in vegetable breeding.Hortic Res. 2021 Jun 1;8(1):120. doi: 10.1038/s41438-021-00552-9. Hortic Res. 2021. PMID: 34059656 Free PMC article. Review.
-
GWAS Mediated Elucidation of Heterosis for Metric Traits in Cotton (Gossypium hirsutum L.) Across Multiple Environments.Front Plant Sci. 2021 May 20;12:565552. doi: 10.3389/fpls.2021.565552. eCollection 2021. Front Plant Sci. 2021. PMID: 34093598 Free PMC article.
-
Genetic Analysis of Heterosis for Yield Influencing Traits in Brassica juncea Using a Doubled Haploid Population and Its Backcross Progenies.Front Plant Sci. 2021 Sep 16;12:721631. doi: 10.3389/fpls.2021.721631. eCollection 2021. Front Plant Sci. 2021. PMID: 34603351 Free PMC article.
References
-
- Wright S. Evolution and the genetics of populations. Chicago: University of Chicago Press; 1977.
-
- Shull GH. Duplicate genes for capsule-form in Bursa bursa-pastoris. Z I A V. 1914;12(1):97–149.
-
- Allard RW. Principles of plant breeding. New York: Wiley; 1960. Inbreeding depression and heterosis; pp. 213–223.
-
- Simmonds NW. Principles of crop improvement. London and New York: Longman Group; 1979.
MeSH terms
Grants and funding
LinkOut - more resources
Full Text Sources
Miscellaneous
