

High density genetic maps of St. Augustinegrass and applications to comparative genomic analysis and QTL mapping for turf quality traits
- PMID: 30541451
- PMCID: PMC6292074
- DOI: 10.1186/s12870-018-1554-4
High density genetic maps of St. Augustinegrass and applications to comparative genomic analysis and QTL mapping for turf quality traits
Abstract
Background: St. Augustinegrass [Stenotaphrum secundatum (Walt.) Kuntze] is a warm-season, perennial turfgrass species well adapted for home lawns and commercial landscapes with economic and ecological value. However, a lack of genomic resources in St. Augustinegrass has hindered the full utilization of genetic variance for maximizing genetic gain and limited our understanding of the species' evolution.
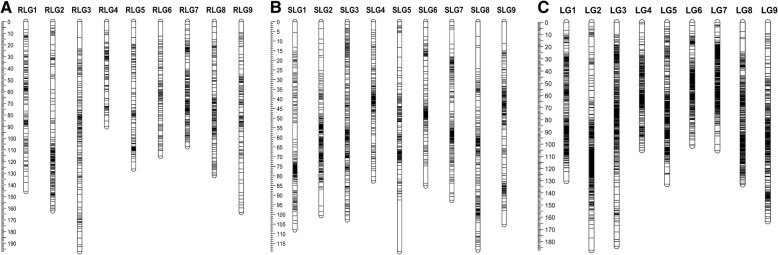
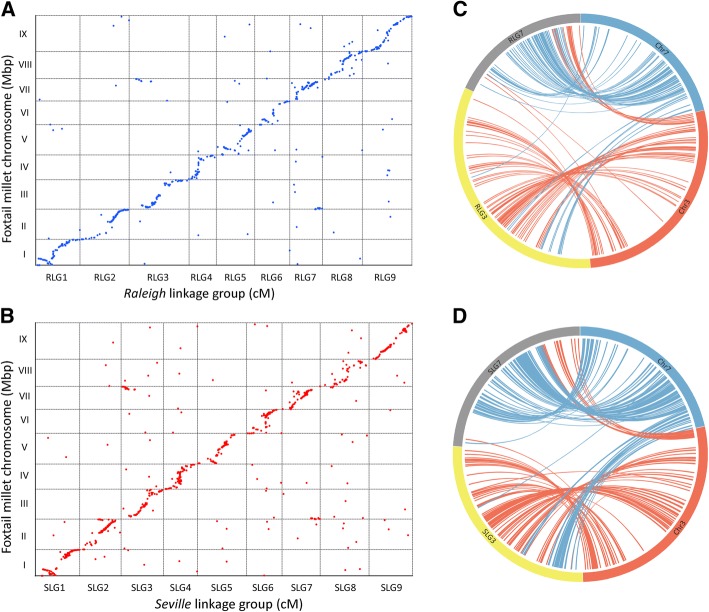
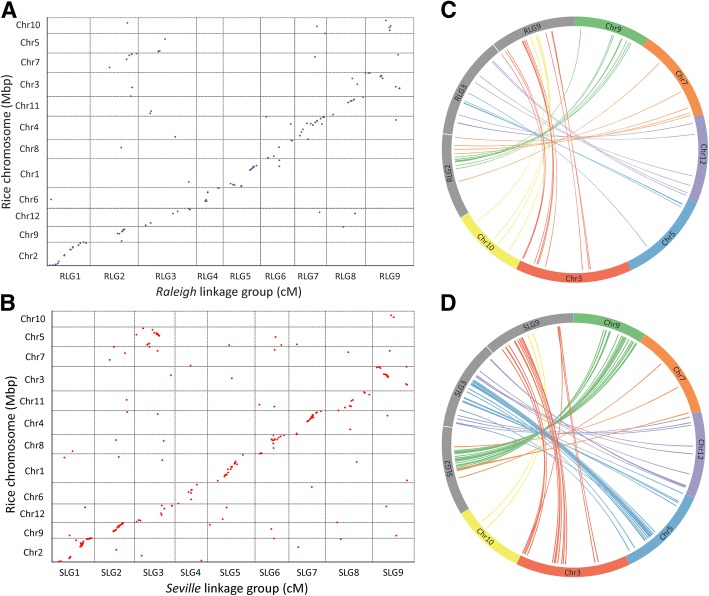
Results: In this study, we constructed the first high-density linkage map for St. Augustinegrass using a genotyping by sequencing (GBS) approach. The integrated linkage map consists of 2871 single nucleotide polymorphism (SNP) and 81 simple sequence repeat (SSR) markers, spanning 1241.7 cM, with an average distance of 0.4 cM between markers, and thus represents the densest genetic map for St. Augustinegrass to date. Comparative genomic analysis revealed inter-chromosome arrangements and independent nested chromosome fusion events that occurred after St. Augustinegrass, foxtail millet, sorghum, and rice diverged from a common ancestor. Forty-eight candidate quantitative trait loci (QTL) were detected for turf quality-related traits, including overall turf quality, leaf texture, genetic color, and turf density. Three hot spot regions were identified on linkage groups LG3 and LG8, where multi-QTL for different traits overlapped. Several leaf development related genes were contained within these identified QTL regions.
Conclusions: This study developed the first high-density genetic map and identified putative QTL related to turf quality, which provide valuable genetic resources for marker-assisted selection (MAS) in St. Augustinegrass.
Keywords: Comparative genomic analysis; Linkage map; QTL; St. Augustinegrass.
Conflict of interest statement
Ethics approval and consent to participate
Not applicable.
Consent for publication
Not applicable.
Competing interests
The authors declare that they have no competing interests.
Publisher’s Note
Springer Nature remains neutral with regard to jurisdictional claims in published maps and institutional affiliations.
Figures

Similar articles
-
Detection of quantitative trait loci associated with drought tolerance in St. Augustinegrass.PLoS One. 2019 Oct 31;14(10):e0224620. doi: 10.1371/journal.pone.0224620. eCollection 2019. PLoS One. 2019. PMID: 31671135 Free PMC article.
-
The integration of quantitative trait locus mapping and transcriptome studies reveals candidate genes for water stress response in St. Augustinegrass.BMC Plant Biol. 2025 May 19;25(1):662. doi: 10.1186/s12870-025-06692-7. BMC Plant Biol. 2025. PMID: 40389851 Free PMC article.
-
Quantitative Trait Loci Associated with Gray Leaf Spot Resistance in St. Augustinegrass.Plant Dis. 2020 Nov;104(11):2799-2806. doi: 10.1094/PDIS-04-20-0905-RE. Epub 2020 Sep 28. Plant Dis. 2020. PMID: 32986536
-
Advances in QTL mapping in pigs.Int J Biol Sci. 2007 Feb 10;3(3):192-7. doi: 10.7150/ijbs.3.192. Int J Biol Sci. 2007. PMID: 17384738 Free PMC article. Review.
-
Advanced technologies for genomic analysis in farm animals and its application for QTL mapping.Genetica. 2009 Jun;136(2):371-86. doi: 10.1007/s10709-008-9338-7. Epub 2008 Dec 18. Genetica. 2009. PMID: 19093212 Review.
Cited by
-
QTL mapping of morphological characteristics that correlated to drought tolerance in St. Augustinegrass.PLoS One. 2022 May 2;17(5):e0268004. doi: 10.1371/journal.pone.0268004. eCollection 2022. PLoS One. 2022. PMID: 35500017 Free PMC article.
-
Detection of quantitative trait loci associated with drought tolerance in St. Augustinegrass.PLoS One. 2019 Oct 31;14(10):e0224620. doi: 10.1371/journal.pone.0224620. eCollection 2019. PLoS One. 2019. PMID: 31671135 Free PMC article.
-
The integration of quantitative trait locus mapping and transcriptome studies reveals candidate genes for water stress response in St. Augustinegrass.BMC Plant Biol. 2025 May 19;25(1):662. doi: 10.1186/s12870-025-06692-7. BMC Plant Biol. 2025. PMID: 40389851 Free PMC article.
References
-
- Sauer JD. Revision of Stenotaphrum (Gramineae: Paniceae) with attention to its historical geography. Brittonia. 1972;24:202–222. doi: 10.2307/2805871. - DOI
-
- Busey P, Davis EH. Turfgrass in the shade environment. Proc Fla State Hort Soc. 1991;104:353–358.
-
- Milla-Lewis SR, Zuleta MC, Van Esbroeck GA, Quesenberry KH, Kenworthy KE. Cytological and molecular characterization of genetic diversity in Stenotaphrum. Crop Sci. 2013;53(1):296–308. doi: 10.2135/cropsci2012.04.0234. - DOI
-
- Kellogg EA. Flowering Plants. Monocots: Poaceae (Vol. 13) New York: Springer; 2015.
-
- Parrish DJ, Fike JH. The biology and agronomy of switchgrass for biofuels. Crit Rev Plant Sci. 2005;24(5–6):423–459. doi: 10.1080/07352680500316433. - DOI
MeSH terms
Substances
Grants and funding
LinkOut - more resources
Full Text Sources
