

Effect of ultrafiltration during hemodialysis on hepatic and total-body water: an observational study
- PMID: 30541478
- PMCID: PMC6292051
- DOI: 10.1186/s12882-018-1150-8
Effect of ultrafiltration during hemodialysis on hepatic and total-body water: an observational study
Abstract
Background: The hepatic circulation is involved in adaptive systemic responses to circulatory stress. However, it is vulnerable to both chronic hypervolemia and cardiac dysfunction. The influence of hemodialysis (HD) and ultrafiltration (UF) upon liver water content has been understudied. We conducted a detailed pilot study to characterize the effects of HD upon liver water content and stiffness, referenced to peripheral fluid mobilization and total body water.
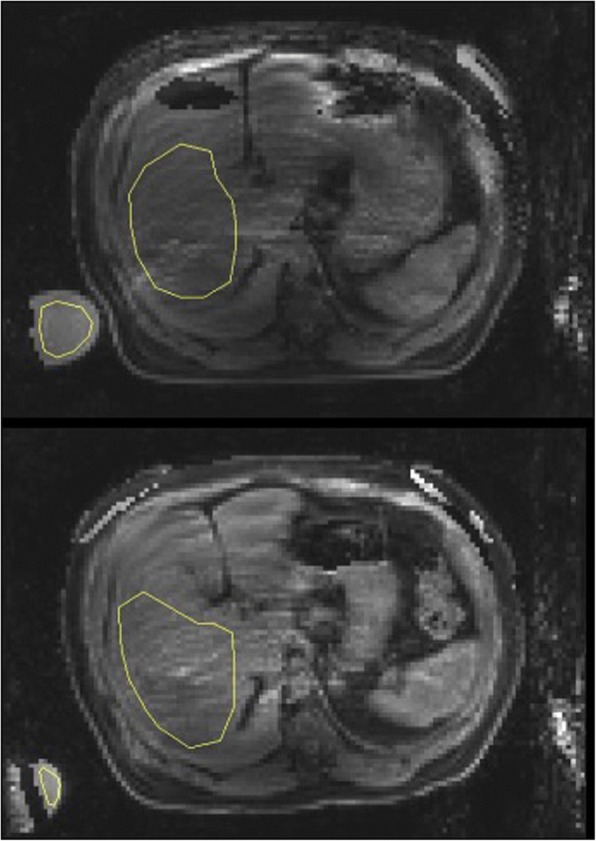
Methods: We studied 14 established HD patients without liver disease. Magnetic resonance imaging (MRI) together with ultrasound-based elastography and bioimpedance assessment were employed to measure hepatic water content and stiffness, body composition, and water content in the calf pre- and post-HD.
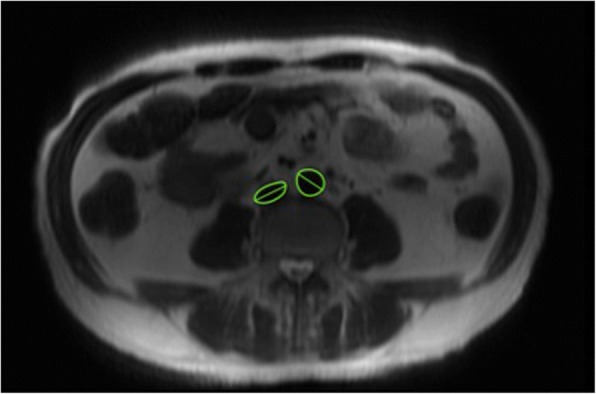
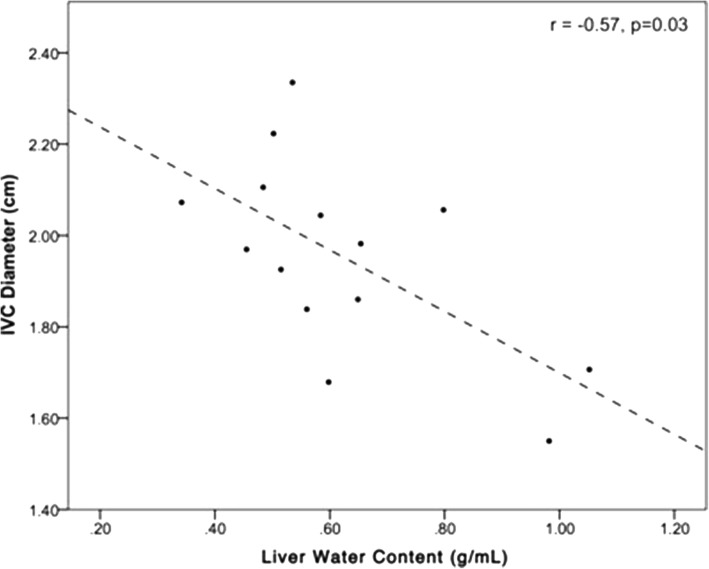
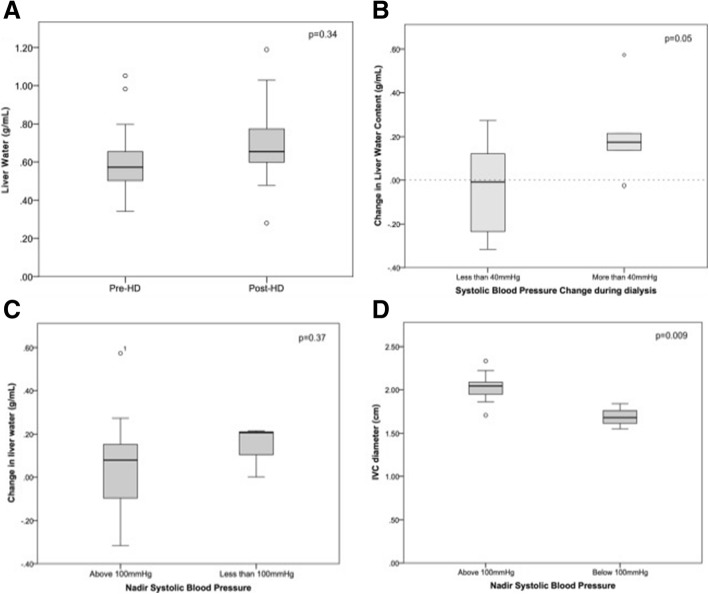
Results: Mean UF volume was 8.13 ± 4.4 mL/kg/hr. Fluid removal was accompanied with effective mobilization of peripheral water (measured with MRI within the thigh) from 0.85 ± 0.21 g/mL to 0.83 ± 0.18 g/mL, and reduction in total body water (38.9 ± 9.4 L to 37.4 ± 8.6 L). However, directly-measured liver water content did not decrease (0.57 ± 0.1 mL/g to 0.79 ± 0.3 m L/g). Liver water content and IVC diameter were inversely proportional (r = - 0.57, p = 0.03), a relationship which persisted after dialysis.
Conclusions: In contrast to the reduced total body water content, liver water content did not decrease post-HD, consistent with a diversion of blood to the hepatic circulation, in those with signs of greater circulatory stress. This novel observation suggests that there is a unique hepatic response to HD with UF and that the liver may play a more important role in intradialytic hypotension and fluid shifts than currently appreciated.
Keywords: Chronic hemodialysis; Fluid overload; Intradilyatic hypotension; Magnetic resonance imaging; Ultrafiltration.
Conflict of interest statement
Authors’ information
CJG has complated her MD and is pursing her PhD in Medicine. The result of this study will form part of her thesis. SSH is a mid-career scientist, who completed her MD in 2005 and PhD in medical biophysics in 2015. Her research expertise is in the areas of extracorporeal therapies. She has received several grants to conduct novol imaging studies in patients with renal disease. She is a co-supervisor for CJG.
Ethics approval and consent to participate
This observational study was approved by the Health Sciences Research Ethics Board at the University of Western Ontario (HSREB106868). Written consent was obtained from all patients who took part in this study.
Consent for publication
Not applicable.
Competing interests
CAM reports grants from General Electric outside the submitted work.
Publisher’s Note
Springer Nature remains neutral with regard to jurisdictional claims in published maps and institutional affiliations.
Figures
Similar articles
-
Changes in cardiac output with hemodialysis relate to net volume balance and to inferior vena cava ultrasound collapsibility in critically ill patients.Ren Fail. 2020 Nov;42(1):179-192. doi: 10.1080/0886022X.2020.1726384. Ren Fail. 2020. PMID: 32050836 Free PMC article.
-
Hemodialysis patients with less extracellular water overload and smaller cardiac atrial chamber sizes are at greater risk of a fall in blood pressure during dialysis.Ther Apher Dial. 2021 Feb;25(1):16-23. doi: 10.1111/1744-9987.13490. Epub 2020 Apr 13. Ther Apher Dial. 2021. PMID: 32216122
-
Central, peripheral, and other blood volume changes during hemodialysis.ASAIO J. 2002 Jul-Aug;48(4):379-82. doi: 10.1097/00002480-200207000-00009. ASAIO J. 2002. PMID: 12141467
-
Use of segmental multifrequency bioimpedance spectroscopy in hemodialysis.Contrib Nephrol. 2005;149:162-167. doi: 10.1159/000085482. Contrib Nephrol. 2005. PMID: 15876840 Review.
-
Does the presence of an arteriovenous fistula alter changes in body water following hemodialysis as determined by multifrequency bioelectrical impedance assessment?Hemodial Int. 2015 Oct;19(4):484-9. doi: 10.1111/hdi.12282. Epub 2015 Mar 6. Hemodial Int. 2015. PMID: 25752625 Review.
Cited by
-
Intradialytic Hypotension: Mechanisms and Outcome.Blood Purif. 2020;49(1-2):158-167. doi: 10.1159/000503776. Epub 2019 Dec 18. Blood Purif. 2020. PMID: 31851975 Free PMC article. Review.
-
Multitargeted interventions to reduce dialysis-induced systemic stress.Clin Kidney J. 2021 Dec 27;14(Suppl 4):i72-i84. doi: 10.1093/ckj/sfab192. eCollection 2021 Dec. Clin Kidney J. 2021. PMID: 34987787 Free PMC article. Review.
-
Dynamic changes in liver stiffness measurements using transient elastography in hemodialysis patients.Hepatol Forum. 2025 Feb 18;6(2):57-61. doi: 10.14744/hf.2024.2024.0044. eCollection 2025. Hepatol Forum. 2025. PMID: 40248674 Free PMC article.
-
Exploring the Link Between Hepatic Perfusion and Endotoxemia in Hemodialysis.Kidney Int Rep. 2021 Feb 9;6(5):1336-1345. doi: 10.1016/j.ekir.2021.02.008. eCollection 2021 May. Kidney Int Rep. 2021. PMID: 34013112 Free PMC article.
References
Publication types
MeSH terms
LinkOut - more resources
Full Text Sources
Medical
