

Data and tools to integrate climate and environmental information into public health
- PMID: 30541601
- PMCID: PMC6292116
- DOI: 10.1186/s40249-018-0501-9
Data and tools to integrate climate and environmental information into public health
Abstract
Background: During the last 30 years, the development of geographical information systems and satellites for Earth observation has made important progress in the monitoring of the weather, climate, environmental and anthropogenic factors that influence the reduction or the reemergence of vector-borne diseases. Analyses resulting from the combination of geographical information systems (GIS) and remote sensing have improved knowledge of climatic, environmental, and biodiversity factors influencing vector-borne diseases (VBDs) such as malaria, visceral leishmaniasis, dengue, Rift Valley fever, schistosomiasis, Chagas disease and leptospirosis. These knowledge and products developed using remotely sensed data helped and continue to help decision makers to better allocate limited resources in the fight against VBDs.
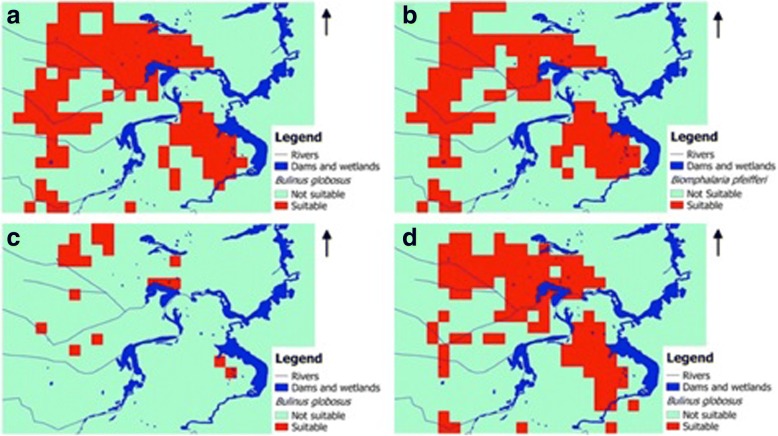
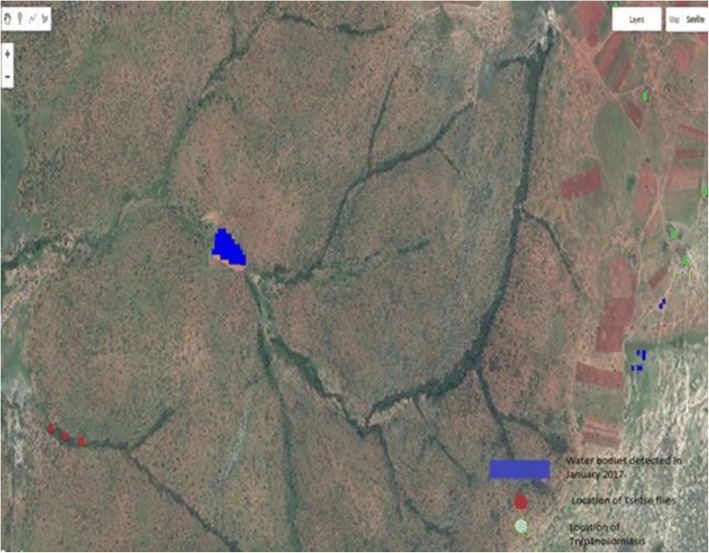
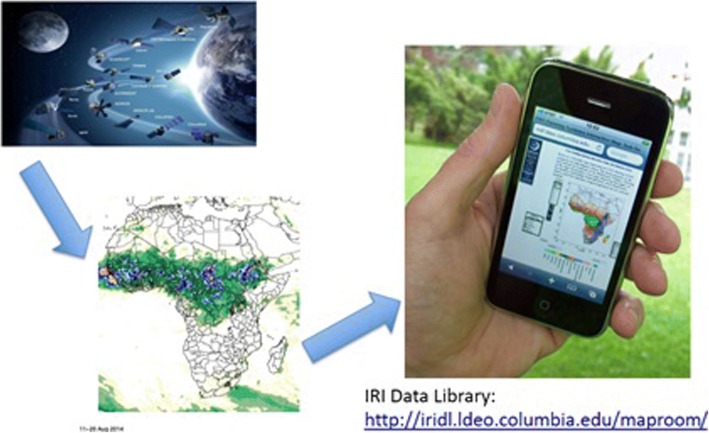
Main body: Because VBDs are linked to climate and environment, we present here our experience during the last four years working with the projects under the, World Health Organization (WHO)/ The Special Programme for Research and Training in Tropical Diseases (TDR)-International Development Research Centre (IDRC) Research Initiative on VBDs and Climate Change to integrate climate and environmental information into research and decision-making processes. The following sections present the methodology we have developed, which uses remote sensing to monitor climate variability, environmental conditions, and their impacts on the dynamics of infectious diseases. We then show how remotely sensed data can be accessed and evaluated and how they can be integrated into research and decision-making processes for mapping risks, and creating Early Warning Systems, using two examples from the WHO TDR projects based on schistosomiasis analysis in South Africa and Trypanosomiasis in Tanzania.
Conclusions: The tools presented in this article have been successfully used by the projects under the WHO/TDR-IDRC Research Initiative on VBDs and Climate Change. Combined with capacity building, they are an important piece of work which can significantly contribute to the goals of WHO Global Vector Control Response and to the Sustainable Development Goals especially those on health and climate action.
Keywords: Access; Climate and environmental information; Data; Geographical information system; Malaria; Schistosomiasis; Tools; Trypanosomiasis.
Conflict of interest statement
Ethics approval and consent to participate
Not applicable.
Consent for publication
Not applicable.
Competing interests
The authors declare that they have no competing interests.
Figures

Similar articles
-
Support for research towards understanding the population health vulnerabilities to vector-borne diseases: increasing resilience under climate change conditions in Africa.Infect Dis Poverty. 2017 Dec 12;6(1):164. doi: 10.1186/s40249-017-0378-z. Infect Dis Poverty. 2017. PMID: 29228976 Free PMC article.
-
Climate changes, environment and infection: facts, scenarios and growing awareness from the public health community within Europe.Anaerobe. 2011 Dec;17(6):337-40. doi: 10.1016/j.anaerobe.2011.05.016. Epub 2011 Jun 2. Anaerobe. 2011. PMID: 21664978
-
Vectorborne diseases in West Africa: geographic distribution and geospatial characteristics.Trans R Soc Trop Med Hyg. 2013 May;107(5):273-84. doi: 10.1093/trstmh/trt020. Epub 2013 Mar 10. Trans R Soc Trop Med Hyg. 2013. PMID: 23479360 Review.
-
Impact of past and on-going changes on climate and weather on vector-borne diseases transmission: a look at the evidence.Infect Dis Poverty. 2019 Jun 13;8(1):51. doi: 10.1186/s40249-019-0565-1. Infect Dis Poverty. 2019. PMID: 31196187 Free PMC article. Review.
-
Addressing vulnerability, building resilience: community-based adaptation to vector-borne diseases in the context of global change.Infect Dis Poverty. 2017 Dec 11;6(1):166. doi: 10.1186/s40249-017-0375-2. Infect Dis Poverty. 2017. PMID: 29228986 Free PMC article. Review.
Cited by
-
Science Policy to Advance a Climate Change and Health Research Agenda in the United States.Int J Environ Res Public Health. 2021 Jul 25;18(15):7868. doi: 10.3390/ijerph18157868. Int J Environ Res Public Health. 2021. PMID: 34360159 Free PMC article.
-
Transdisciplinary Research Priorities for Human and Planetary Health in the Context of the 2030 Agenda for Sustainable Development.Int J Environ Res Public Health. 2020 Nov 30;17(23):8890. doi: 10.3390/ijerph17238890. Int J Environ Res Public Health. 2020. PMID: 33265908 Free PMC article. Review.
-
Spatial Landscape Structure Influences Cross-Species Transmission in a Rabies-like Virus Model.Microorganisms. 2025 Feb 14;13(2):416. doi: 10.3390/microorganisms13020416. Microorganisms. 2025. PMID: 40005781 Free PMC article.
-
Spatial and Temporal Variability of Visceral Leishmaniasis in Colombia, 2007 to 2018.Am J Trop Med Hyg. 2021 Jul 7;105(1):144-155. doi: 10.4269/ajtmh.21-0103. Am J Trop Med Hyg. 2021. PMID: 34232908 Free PMC article.
-
Integrating artificial intelligence with mechanistic epidemiological modeling: a scoping review of opportunities and challenges.Nat Commun. 2025 Jan 10;16(1):581. doi: 10.1038/s41467-024-55461-x. Nat Commun. 2025. PMID: 39794317 Free PMC article.
References
-
- Ceccato P, Connor SJ, Jeanne I, Thomson MC. Application of Geographical Information System and Remote Sensing Technologies for assessing and monitoring malaria risk. Parassitologia. 2005;47:81–96. - PubMed
-
- Bhunia GS, Kumar V, Kumar AJ, Das P, Kesari S. The use of remote sensing in the identification of the eco-environmental factors associated with the risk of human visceral leishmaniasis (kala-azar) on the Gangetic plain, in North-Eastern India. Ann Trop Med Parasitol. 2010;104(1):35–53. - PubMed
Publication types
MeSH terms
Grants and funding
LinkOut - more resources
Full Text Sources
Medical
