. 2019 Feb 4;218(2):445-454.
doi: 10.1083/jcb.201806075. Epub 2018 Dec 12.

Time-resolved ultrastructure of the cortical actin cytoskeleton in dynamic membrane blebs

Affiliations

Time-resolved ultrastructure of the cortical actin cytoskeleton in dynamic membrane blebs

Aleksandra S Chikina et al. J Cell Biol. .

Abstract

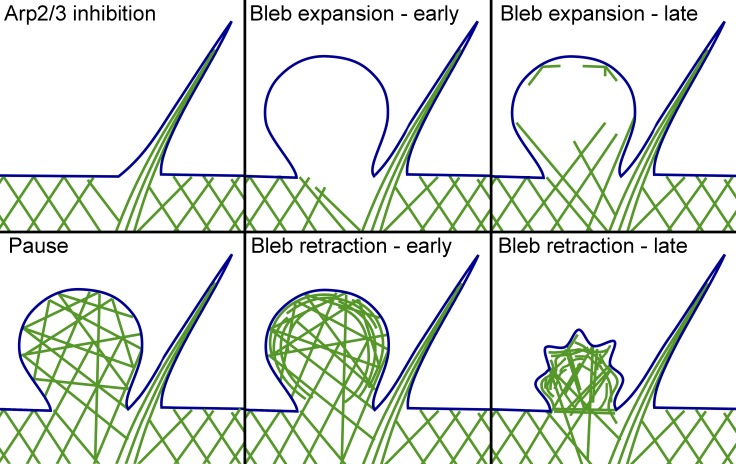
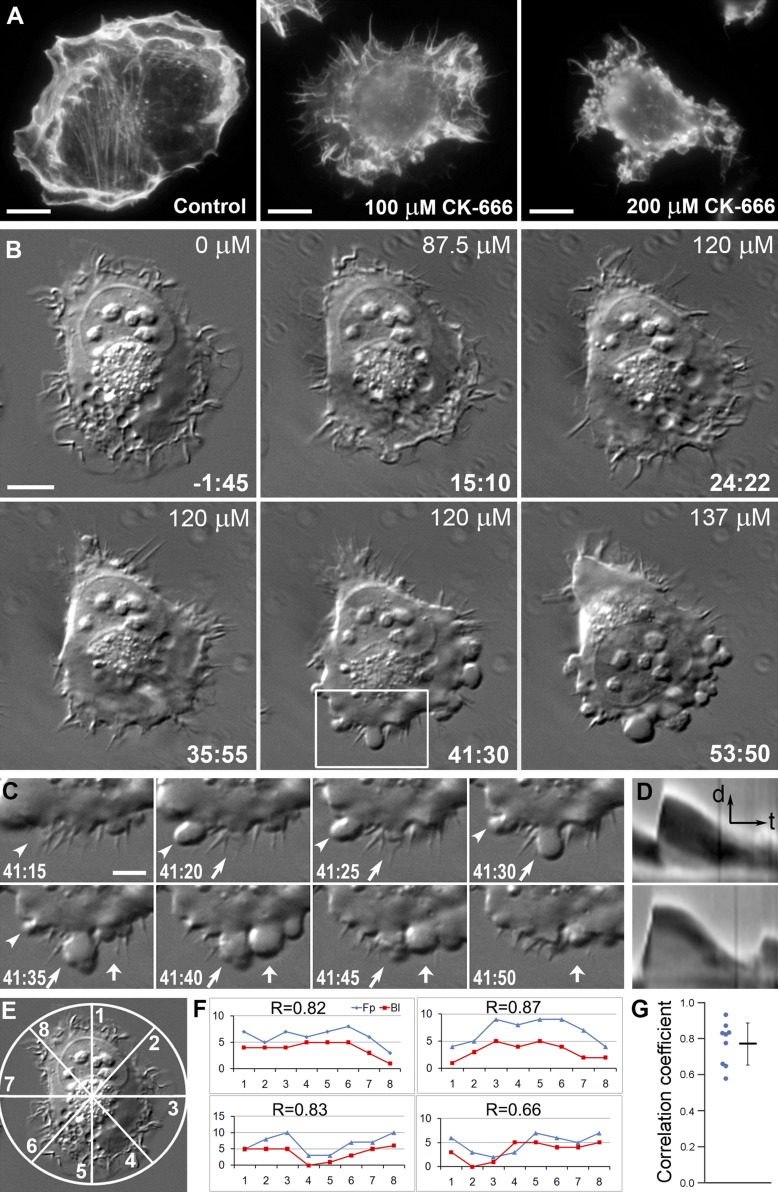
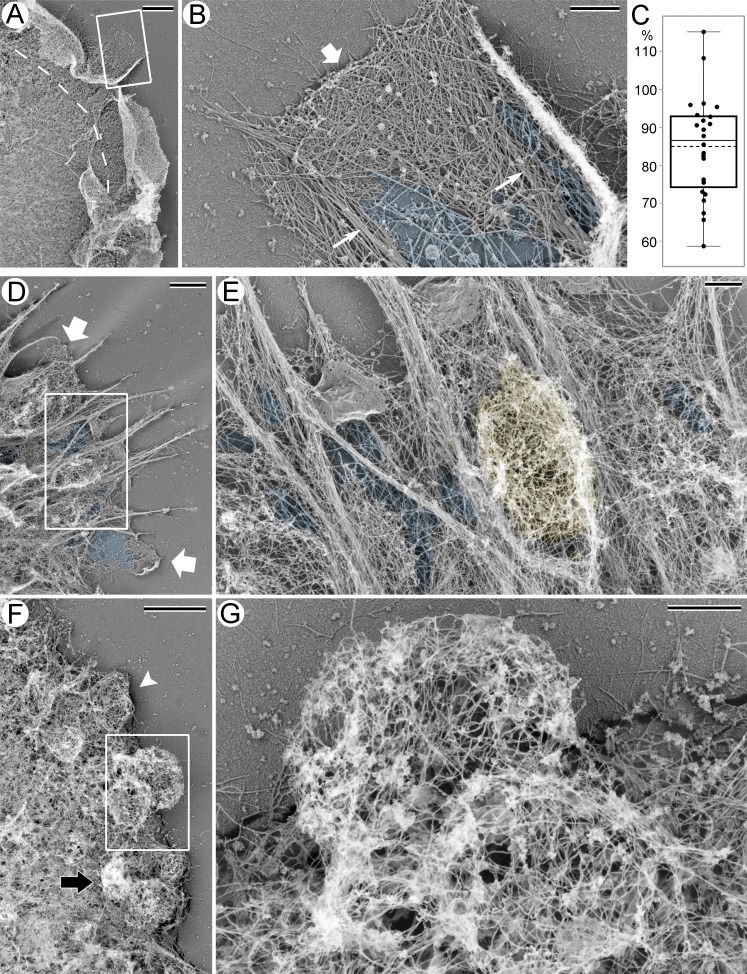
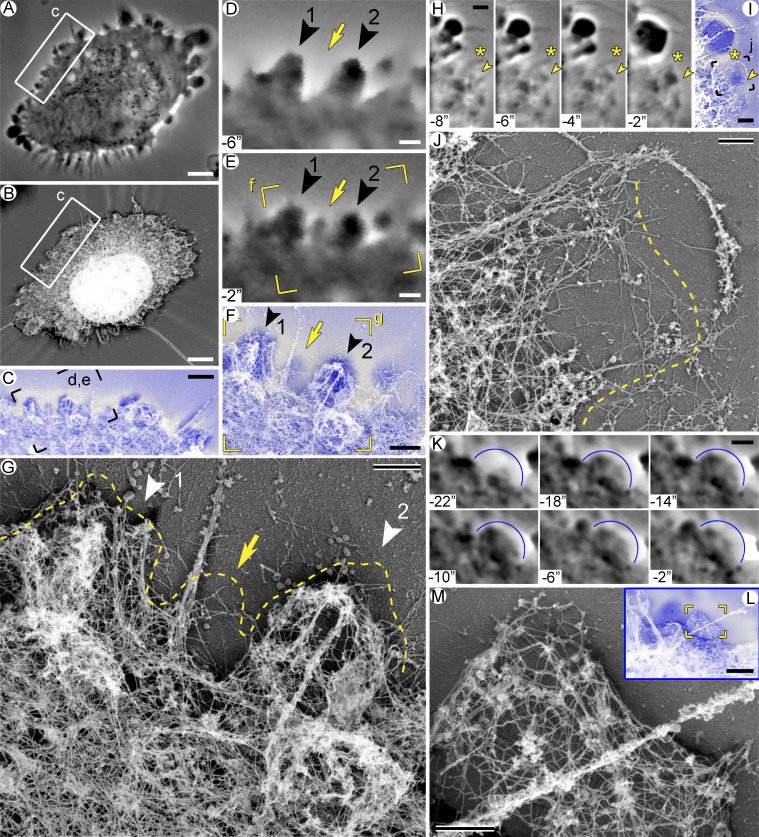
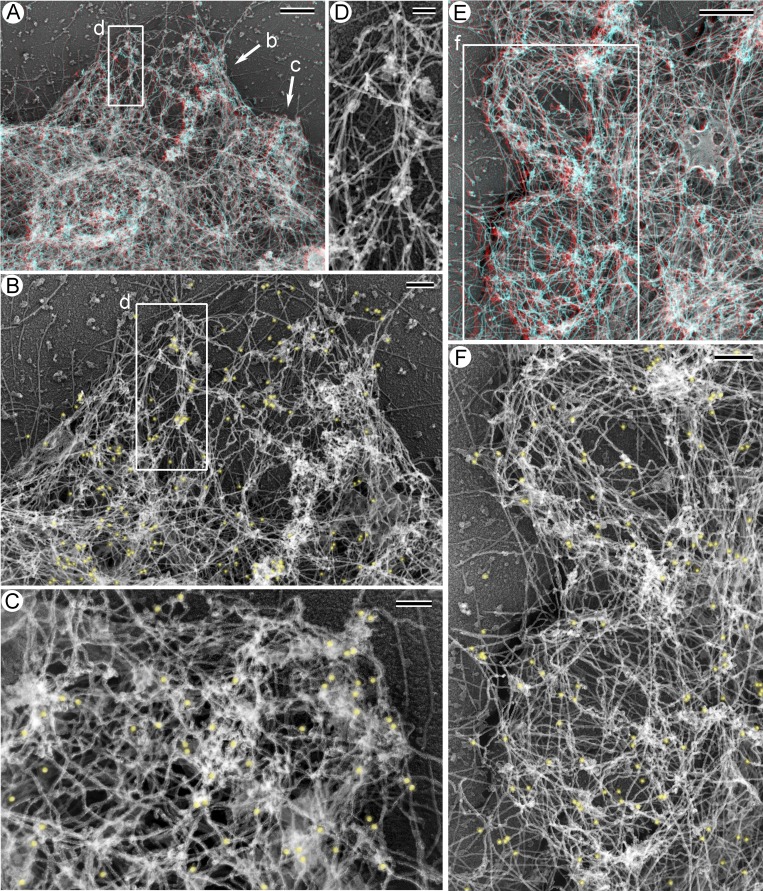
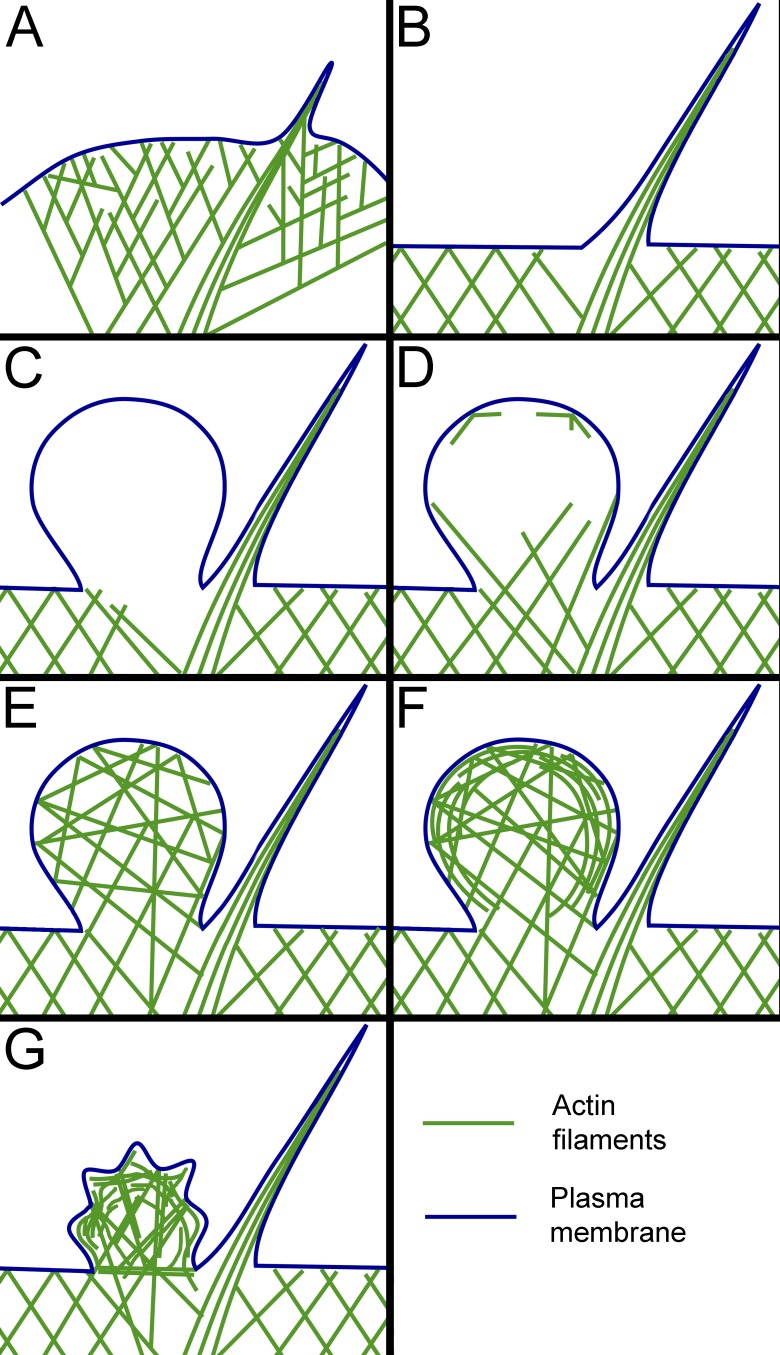
Membrane blebbing accompanies various cellular processes, including cytokinesis, apoptosis, and cell migration, especially invasive migration of cancer cells. Blebs are extruded by intracellular pressure and are initially cytoskeleton-free, but they subsequently assemble the cytoskeleton, which can drive bleb retraction. Despite increasing appreciation of physiological significance of blebbing, the molecular and, especially, structural mechanisms controlling bleb dynamics are incompletely understood. We induced membrane blebbing in human HT1080 fibrosarcoma cells by inhibiting the Arp2/3 complex. Using correlative platinum replica electron microscopy, we characterize cytoskeletal architecture of the actin cortex in cells during initiation of blebbing and in blebs at different stages of their expansion-retraction cycle. The transition to blebbing in these conditions occurred through an intermediate filopodial stage, whereas bleb initiation was biased toward filopodial bases, where the cytoskeleton exhibited local weaknesses. Different stages of the bleb life cycle (expansion, pausing, and retraction) are characterized by specific features of cytoskeleton organization that provide implications about mechanisms of cytoskeleton assembly and bleb retraction.


Figures

None
Graphical abstract
Figure 1.
Figure 1.
Transition from lamellipodia to blebbing in CK-666–treated HT1080 cells includes a filopodial stage. (A) Phalloidin staining in indicated conditions. (B) Time-lapse DIC imaging of an HT1080 cell exposed to increasing CK-666 concentrations. Time is in minutes:seconds relative to the first addition of CK-666 at 87.5 µM. The CK-666 concentration was increased to 120 µM at t = 24:22 and to 137 µM at t = 51:44. (C) Bleb dynamics from the boxed region in B at higher time resolution. Individual blebs are marked by arrows and arrowheads. CK-666 concentration during this time period was 120 µM. (D) Representative kymographs of bleb dynamics with (bottom) and without (top) a stationary phase. Arrows indicate time (t) and protrusion direction (d). Scale bars: 10 µm (A and B), 5 µm (C), 2 µm (D, d arrow), and 30 s (D, t arrow). See also Video 1. (E) Diagram illustrating a method to quantify distribution of protrusion. Numbers of blebs and filopodia were determined in each of the eight sectors of the cell perimeter. (F) Representative four graphs showing the numbers of blebs (Bl) or filopodia (Fp; y axis) versus the sector number (x axis). Pearson correlation coefficient (r) is shown for each graph. Upper left graph corresponds to the cell shown in B. (G) Distribution of individual r values (left) with mean ± SD (right) for n = 9 cells; P <0.0001 relative to r = 0 (two-tailed t test).
Figure 2.
Figure 2.
PREM of HT1080 cells with and without CK-666 treatment. (A) Peripheral region of a control cell; dashed line marks the approximate boundary between protrusions containing branched actin networks and the cell body associated with other types of actin filament arrays. Boxed region is enlarged and rotated counterclockwise in B. (B) Lamellipodium (wide arrow) with embedded filopodia (thin arrows). Sparse cytoskeleton near filopodial bundles is highlighted in blue. (C) Relative cytoskeleton densities around filopodial roots expressed as percentage of the cytoskeleton density in adjacent lamellipodial regions in the same image (85 ± 13%; mean ± SD; P <0.0001; paired two-tailed t test; distribution normality was confirmed by Kolmogorov–Smirnov test; n = 24 region pairs). Box and whiskers encompass 50% and 100% of data, respectively. Thin line in the box indicates median, dashed line indicates mean. (D–G) Peripheral regions of cells treated with 200 µM CK-666 with filopodial (D and E) or blebbing (F and G) phenotype. (D) Wide arrows mark remaining lamellipodia. Boxed region is enlarged and rotated counterclockwise in E. (E) Yellow color marks a bleb formed between filopodial roots, as confirmed by 3D views of this region (not shown). Blue shade in D and E marks sparse cytoskeleton. (F) White arrowhead marks a bleb filled with a relatively uniform network. Stereo view of this bleb is shown in Fig. S1 D. Black arrow marks a crumpled bleb. Boxed region is enlarged and rotated counterclockwise in G. (G) Rounded blebs with a dense cortical cytoskeleton and a sparser internal network. An animated tilt series of this bleb is shown in Video 2. Scale bars: 2 µm (A, D, and F) and 500 nm (B, E, and G). See also Fig. S2.
Figure 3.
Figure 3.
Actin cytoskeleton at different stages of the bleb life cycle. Correlative video and PREM of blebbing HT1080 cells treated with 200 µM CK-666. (A–G) Cell #1. (A) Last phase-contrast image before extraction at t = 0. (B) PREM of the same cell. (C) Overlay of boxed regions from A (blue) and B (gray). (D and E) Time-lapse images from the framed region in C showing formation of a nascent bleb (arrow) and two retracting blebs (arrowheads). Both retracting blebs emerged at t = −64 s and finished expansion at t = −20 s, but bleb 1 began retracting earlier (at t = −12 s) than bleb 2 (at t = −4 s). (F) Overlay of the framed region in E (blue) and corresponding PREM image (gray). (G) PREM of the framed region in F; dashed line marks the cell contour from the phase-contrast image. (H–J) Cell #2. (H) Time-lapse images showing an expanding bleb (arrowheads); asterisks mark an adjacent filopodium. (I) Overlay of the last video frame (blue) and the corresponding PREM image (gray). (J) PREM of the framed region in I. Dashed line indicates the contour of the bleb labeled in H and I. (K–M) Cell #3. (K) Time-lapse images of a bleb (blue arc) fixed at a stationary/early retraction phase. The bleb emerged at t = −22 s, reached maximal size at t = −18 s, and underwent minor retraction between t = −6 and −2 s. (L) Overlay of the last video frame (blue) and the corresponding PREM image (gray). (M) PREM of the framed region in L. Scale bars: 5 µm (A and B), 2 µm (C, H, I, K, and L), 1 µm (D–F), and 500 nm (G, J, and M). Time in seconds before extraction. See also Fig. S3 and Video 3.
Figure 4.
Figure 4.
NMII is associated with the bleb cytoskeleton in different types of blebs. Immunogold PREM of blebbing HT1080 cells treated with 200 µM CK-666. (A and E) Anaglyph stereo images of blebs at the cell periphery. (B and C) Enlarged 2D images of an early-stage bleb (B) and a late-stage bleb (C) from A. Immunogold particles are pseudocolored yellow. (D) A small actin filament bundle in the bleb interior from the boxed region in A and B shown in 2D without pseudocolor. As can be appreciated from A, this NMII-associated bundle ascends from its tip (at the top of the image) toward the base (at the bottom of the image), while NMII immunogold particles associated with the bundle are located inside the bleb. (F) Two middle-stage blebs with cortical enrichment of the cytoskeleton enlarged from E shown as a 2D image with NMII immunogold pseudolcolored yellow. Scale bars: 500 nm (A and E), 200 nm (B and F), and 100 nm (C and D).
Figure 5.
Figure 5.
Cytoskeleton assembly and remodeling during bleb’s life cycle. (A) Branched actin network in lamellipodia with an embedded filopodial bundle. Cytoskeletal network is sparser around the filopodial root. (B) Transitional filopodial stage that precedes the initiation of blebbing. Branched network is suppressed and juxtafilopodial gaps are more prominent. (C) Nascent bleb formed at the filopodial base lacks detectable cytoskeletal filaments. (D) Expanding bleb contains actin filaments invading through the neck from the cell body. Some filaments are also nucleated at the bleb margins. (E) Fully expanded bleb at the stationary/slow retraction phase. Actin filaments form a relatively isotropic network within the bleb. (F) A bleb at the beginning of fast retraction contains cortically enriched cytoskeleton integrated with the sparser internal network. (G) A crumpled bleb during advanced retraction. Membrane folds can be produced by radially oriented pulling force from end-on anchored actin filaments, whereas overall shrinkage could result from contractile activity of tangentially oriented cortical filaments.

Similar articles

Cited by

References

    1. Aoki K., Maeda F., Nagasako T., Mochizuki Y., Uchida S., and Ikenouchi J.. 2016. A RhoA and Rnd3 cycle regulates actin reassembly during membrane blebbing. Proc. Natl. Acad. Sci. USA. 113:E1863–E1871. 10.1073/pnas.1600968113 - DOI - PMC - PubMed
    1. Beckham Y., Vasquez R.J., Stricker J., Sayegh K., Campillo C., and Gardel M.L.. 2014. Arp2/3 inhibition induces amoeboid-like protrusions in MCF10A epithelial cells by reduced cytoskeletal-membrane coupling and focal adhesion assembly. PLoS One. 9:e100943 10.1371/journal.pone.0100943 - DOI - PMC - PubMed
    1. Bergert M., Chandradoss S.D., Desai R.A., and Paluch E.. 2012. Cell mechanics control rapid transitions between blebs and lamellipodia during migration. Proc. Natl. Acad. Sci. USA. 109:14434–14439. 10.1073/pnas.1207968109 - DOI - PMC - PubMed
    1. Bergert M., Erzberger A., Desai R.A., Aspalter I.M., Oates A.C., Charras G., Salbreux G., and Paluch E.K.. 2015. Force transmission during adhesion-independent migration. Nat. Cell Biol. 17:524–529. 10.1038/ncb3134 - DOI - PMC - PubMed
    1. Bovellan M., Romeo Y., Biro M., Boden A., Chugh P., Yonis A., Vaghela M., Fritzsche M., Moulding D., Thorogate R., et al. . 2014. Cellular control of cortical actin nucleation. Curr. Biol. 24:1628–1635. 10.1016/j.cub.2014.05.069 - DOI - PMC - PubMed

Publication types

MeSH terms

Substances