

Phosphorylation of the ryanodine receptor 2 at serine 2030 is required for a complete β-adrenergic response
- PMID: 30541771
- PMCID: PMC6363414
- DOI: 10.1085/jgp.201812155
Phosphorylation of the ryanodine receptor 2 at serine 2030 is required for a complete β-adrenergic response
Abstract
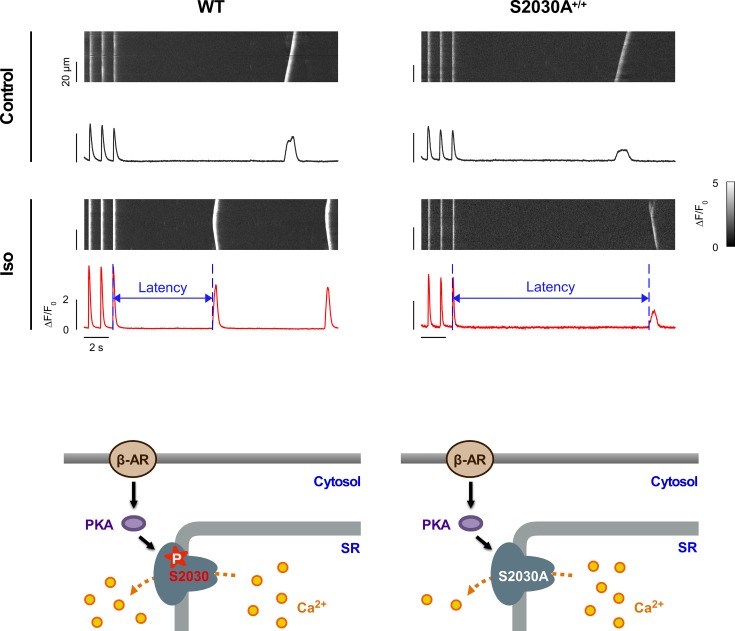
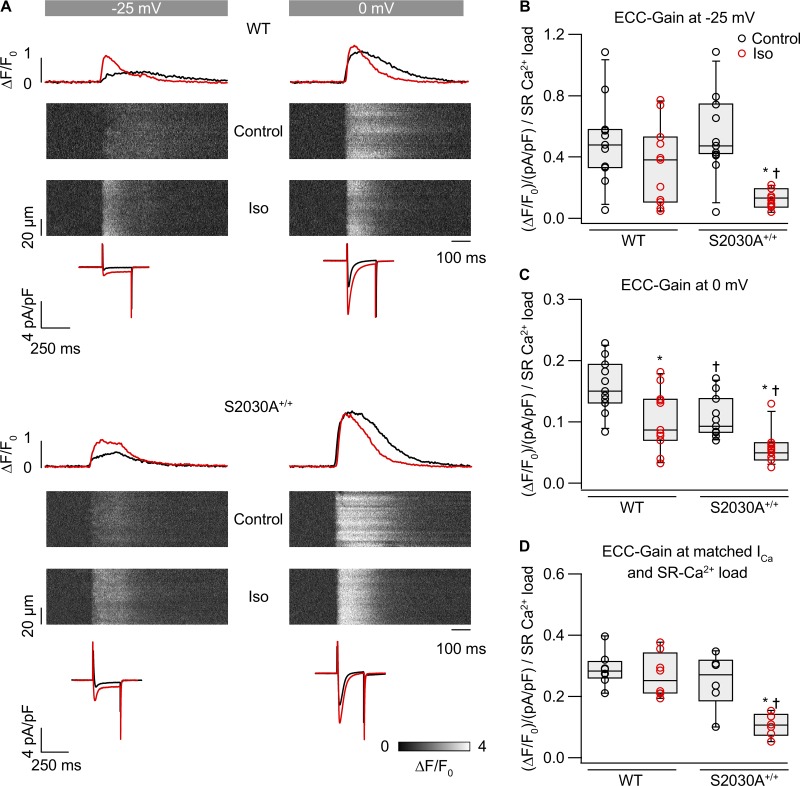
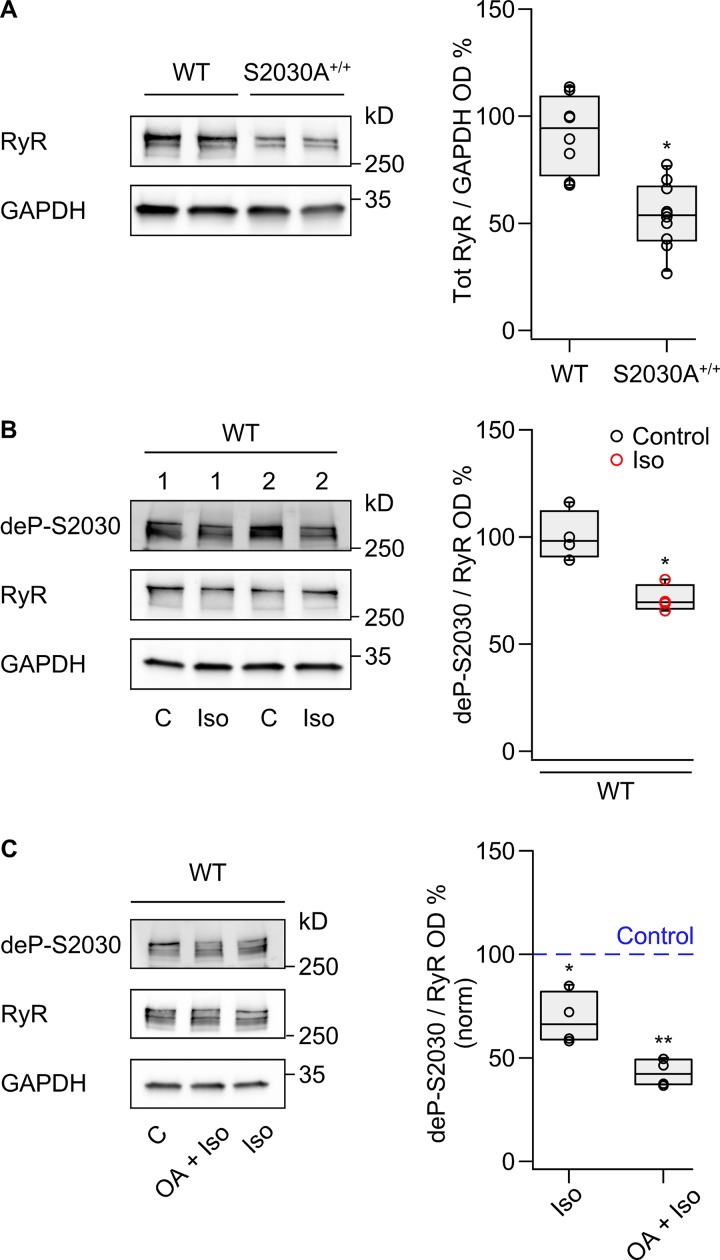
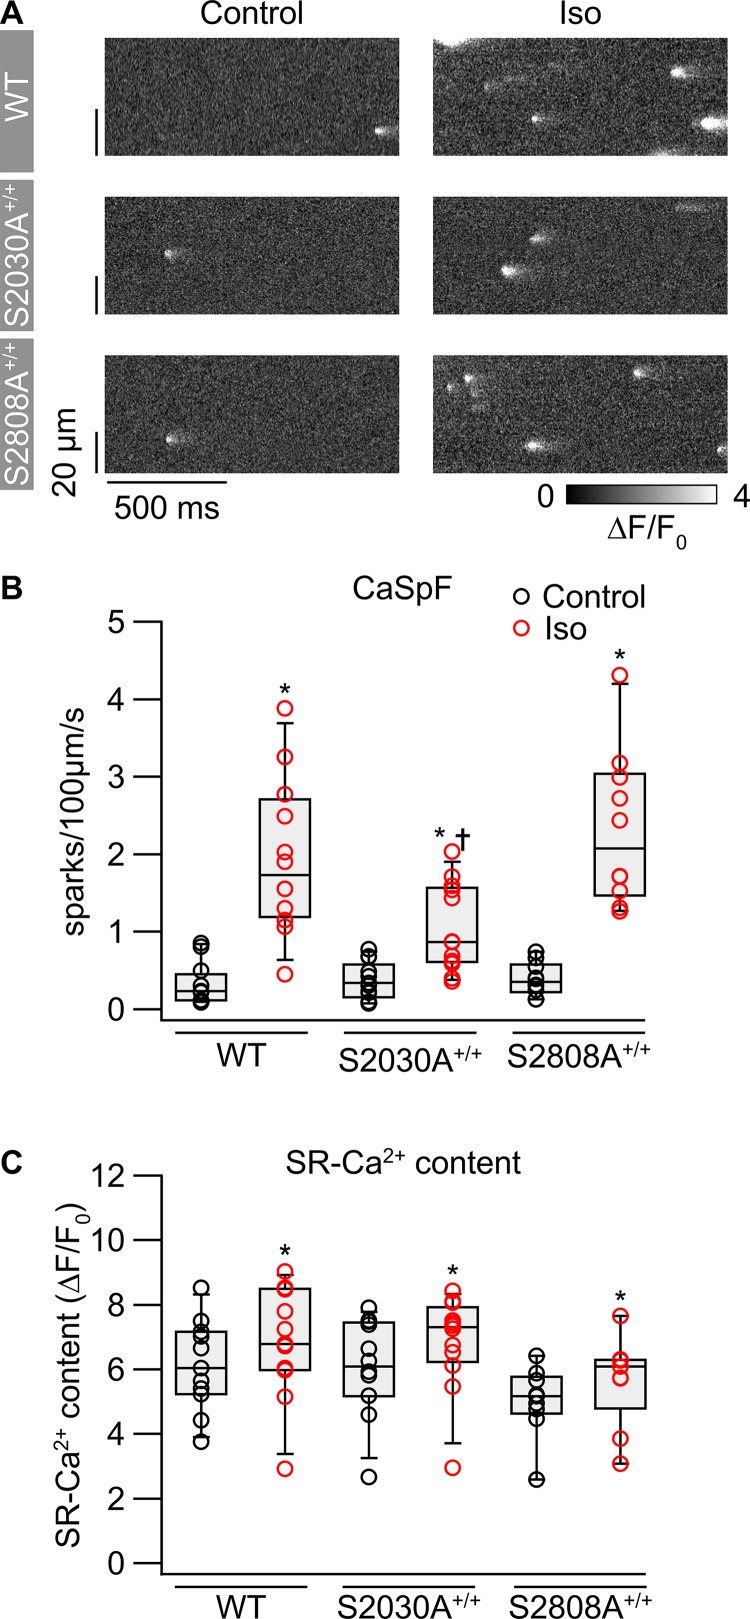
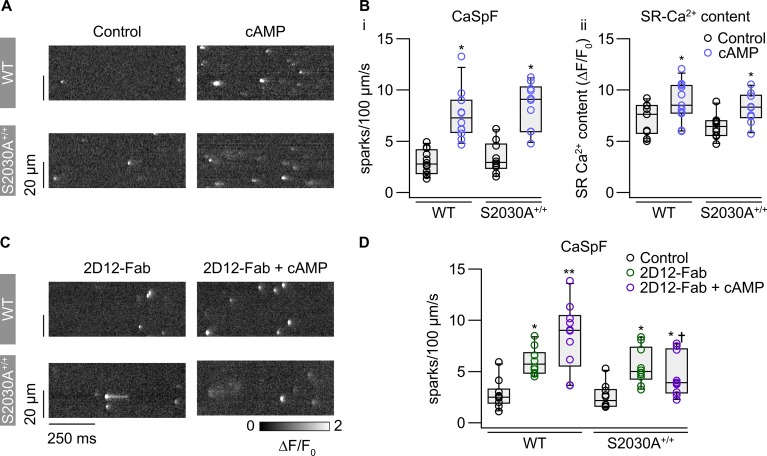
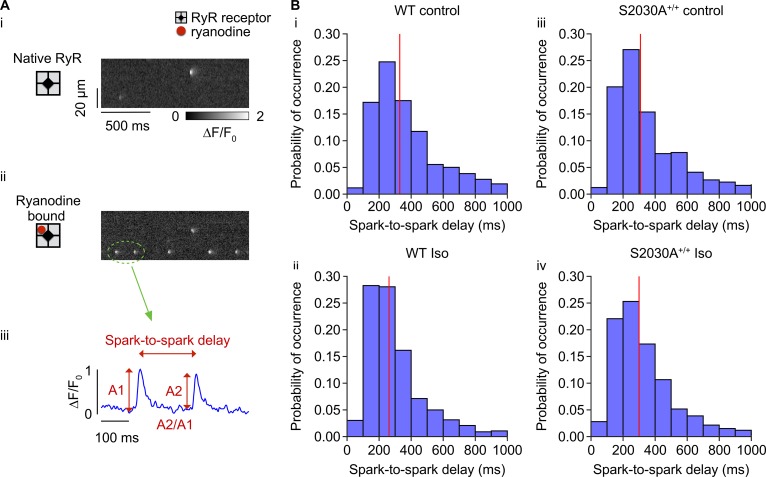
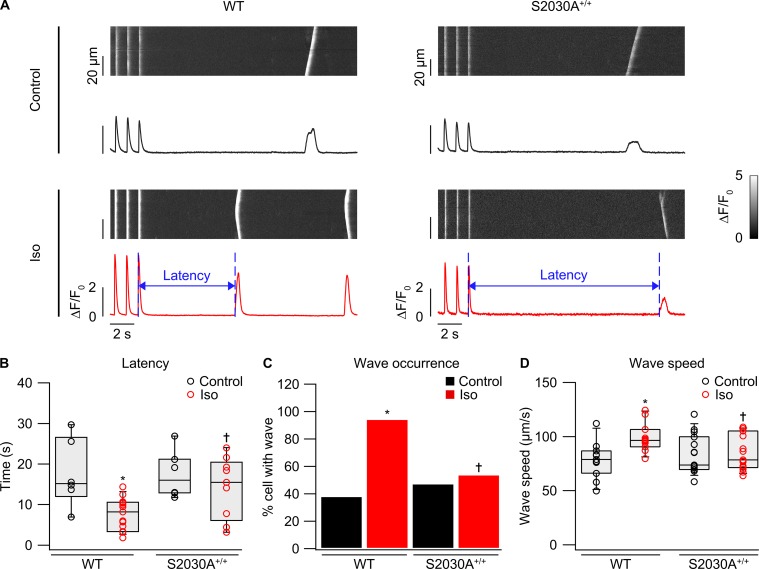
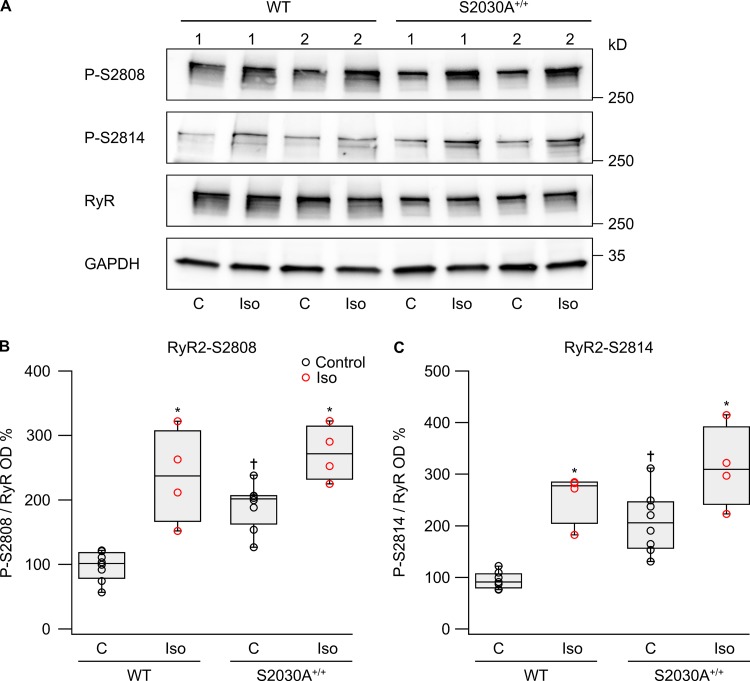
During physical exercise or stress, the sympathetic system stimulates cardiac contractility via β-adrenergic receptor (β-AR) activation, resulting in protein kinase A (PKA)-mediated phosphorylation of the cardiac ryanodine receptor RyR2. PKA-dependent "hyperphosphorylation" of the RyR2 channel has been proposed as a major impairment that contributes to progression of heart failure. However, the sites of PKA phosphorylation and their phosphorylation status in cardiac diseases are not well defined. Among the known RyR2 phosphorylation sites, serine 2030 (S2030) remains highly controversial as a site of functional impact. We examined the contribution of RyR2-S2030 to Ca2+ signaling and excitation-contraction coupling (ECC) in a transgenic mouse with an ablated RyR2-S2030 phosphorylation site (RyR2-S2030A+/+). We assessed ECC gain by using whole-cell patch-clamp recordings and confocal Ca2+ imaging during β-ARs stimulation with isoproterenol (Iso) and consistent SR Ca2+ loading and L-type Ca2+ current (I Ca) triggering. Under these conditions, ECC gain is diminished in mutant compared with WT cardiomyocytes. Resting Ca2+ spark frequency (CaSpF) with Iso is also reduced by mutation of S2030. In permeabilized cells, when SR Ca2+ pump activity is kept constant (using 2D12 antibody against phospholamban), cAMP does not change CaSpF in S2030A+/+ myocytes. Using Ca2+ spark recovery analysis, we found that mutant RyR Ca2+ sensitivity is not enhanced by Iso application, contrary to WT RyRs. Furthermore, ablation of RyR2-S2030 prevents acceleration of Ca2+ waves and increases latency to the first spontaneous Ca2+ release after a train of stimulations during Iso treatment. Together, these results suggest that phosphorylation at S2030 may represent an important step in the modulation of RyR2 activity during β-adrenergic stimulation and a potential target for the development of new antiarrhythmic drugs.
© 2019 Potenza et al.
Figures
Similar articles
-
Dual ablation of the RyR2-Ser2808 and RyR2-Ser2814 sites increases propensity for pro-arrhythmic spontaneous Ca2+ releases.J Physiol. 2024 Oct;602(20):5179-5201. doi: 10.1113/JP286453. Epub 2024 Sep 24. J Physiol. 2024. PMID: 39316734
-
PKA phosphorylation of cardiac ryanodine receptor modulates SR luminal Ca2+ sensitivity.J Mol Cell Cardiol. 2012 Jul;53(1):33-42. doi: 10.1016/j.yjmcc.2012.03.015. Epub 2012 Apr 1. J Mol Cell Cardiol. 2012. PMID: 22487381 Free PMC article.
-
Maximal acceleration of Ca2+ release refractoriness by β-adrenergic stimulation requires dual activation of kinases PKA and CaMKII in mouse ventricular myocytes.J Physiol. 2015 Mar 15;593(6):1495-507. doi: 10.1113/jphysiol.2014.278051. Epub 2014 Oct 7. J Physiol. 2015. PMID: 25772298 Free PMC article.
-
Role of RyR2 phosphorylation in heart failure and arrhythmias: protein kinase A-mediated hyperphosphorylation of the ryanodine receptor at serine 2808 does not alter cardiac contractility or cause heart failure and arrhythmias.Circ Res. 2014 Apr 11;114(8):1320-7; discussion 1327. doi: 10.1161/CIRCRESAHA.114.300569. Circ Res. 2014. PMID: 24723657 Free PMC article. Review.
-
Ryanodine receptors, FKBP12, and heart failure.Front Biosci. 2002 Apr 1;7:d970-7. doi: 10.2741/A822. Front Biosci. 2002. PMID: 11897558 Review.
Cited by
-
Adrenergic Regulation of Calcium Channels in the Heart.Annu Rev Physiol. 2022 Feb 10;84:285-306. doi: 10.1146/annurev-physiol-060121-041653. Epub 2021 Nov 9. Annu Rev Physiol. 2022. PMID: 34752709 Free PMC article. Review.
-
Desmosome-Dyad Crosstalk: An Arrhythmogenic Axis in Arrhythmogenic Right Ventricular Cardiomyopathy.Circulation. 2020 May 5;141(18):1494-1497. doi: 10.1161/CIRCULATIONAHA.120.046020. Epub 2020 May 4. Circulation. 2020. PMID: 32364772 Free PMC article. No abstract available.
-
Changes of calcium cycling in HFrEF and HFpEF.Mechanobiol Med. 2023 Jul 5;1(1):100001. doi: 10.1016/j.mbm.2023.100001. eCollection 2023 Sep. Mechanobiol Med. 2023. PMID: 40395872 Free PMC article. Review.
-
Role of Ca2+ in healthy and pathologic cardiac function: from normal excitation-contraction coupling to mutations that cause inherited arrhythmia.Arch Toxicol. 2023 Jan;97(1):73-92. doi: 10.1007/s00204-022-03385-0. Epub 2022 Oct 10. Arch Toxicol. 2023. PMID: 36214829 Free PMC article. Review.
-
Dual ablation of the RyR2-Ser2808 and RyR2-Ser2814 sites increases propensity for pro-arrhythmic spontaneous Ca2+ releases.J Physiol. 2024 Oct;602(20):5179-5201. doi: 10.1113/JP286453. Epub 2024 Sep 24. J Physiol. 2024. PMID: 39316734
References
-
- Asghari P., Scriven D.R.L., Zhao Y., Ramos Mondragón R., Valdivia H., Wehrens X., and Moore E.D.W.. 2017. RyR2 tetramer distributions in ventricular myocytes from phosphomutant mice. Biophys. J. 112:161a 10.1016/j.bpj.2016.11.886 - DOI
-
- Benkusky N.A., Weber C.S., Scherman J.A., Farrell E.F., Hacker T.A., John M.C., Powers P.A., and Valdivia H.H.. 2007. Intact beta-adrenergic response and unmodified progression toward heart failure in mice with genetic ablation of a major protein kinase A phosphorylation site in the cardiac ryanodine receptor. Circ. Res. 101:819–829. 10.1161/CIRCRESAHA.107.153007 - DOI - PubMed
Publication types
MeSH terms
Substances
Grants and funding
LinkOut - more resources
Full Text Sources
Molecular Biology Databases
Research Materials
Miscellaneous
