. 2018 Dec 12;3(6):e00592-18.
doi: 10.1128/mSphere.00592-18.

Protein Microarray Analysis of the Specificity and Cross-Reactivity of Influenza Virus Hemagglutinin-Specific Antibodies

Affiliations

Protein Microarray Analysis of the Specificity and Cross-Reactivity of Influenza Virus Hemagglutinin-Specific Antibodies

Rie Nakajima et al. mSphere. .

Abstract

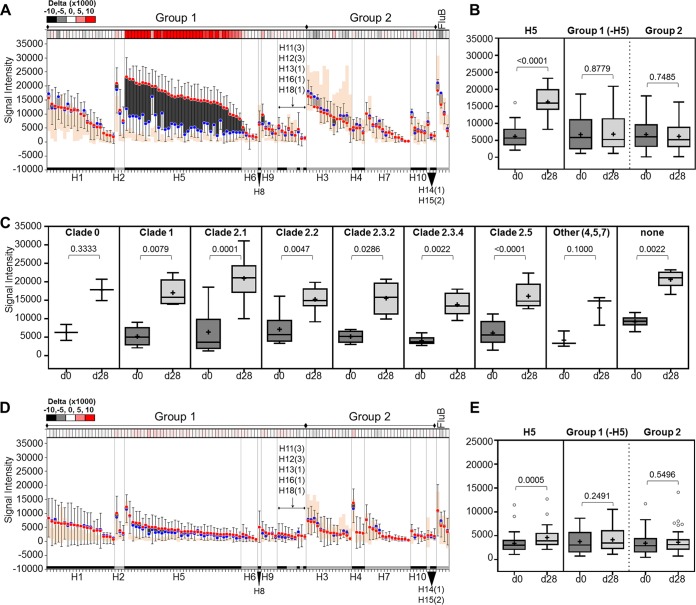
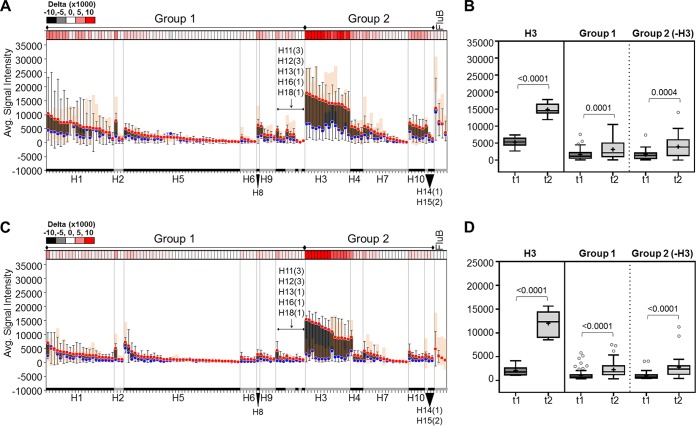
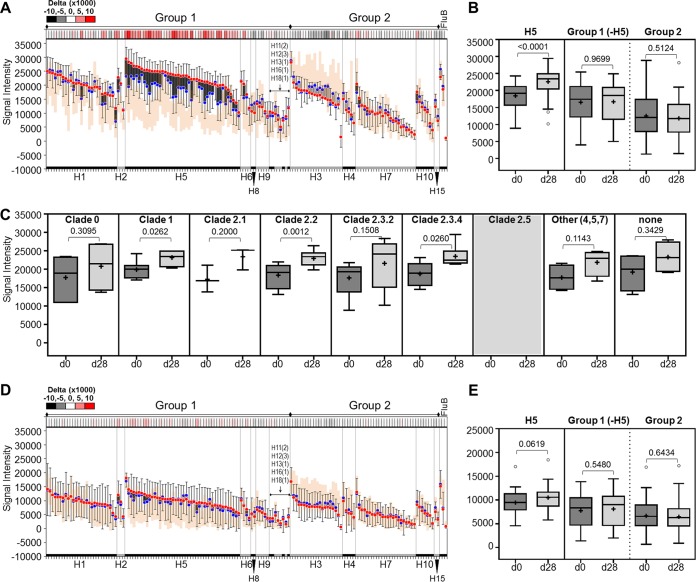
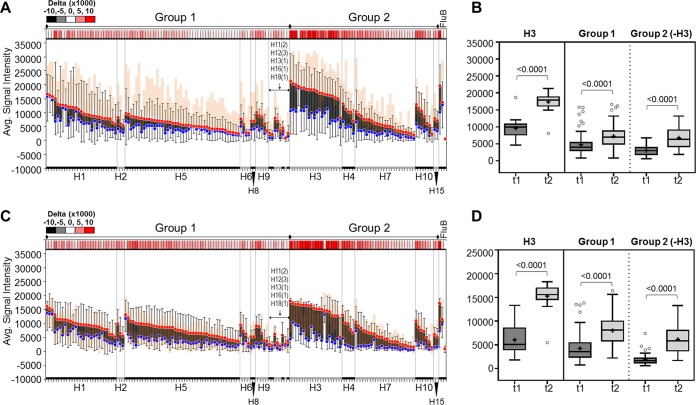
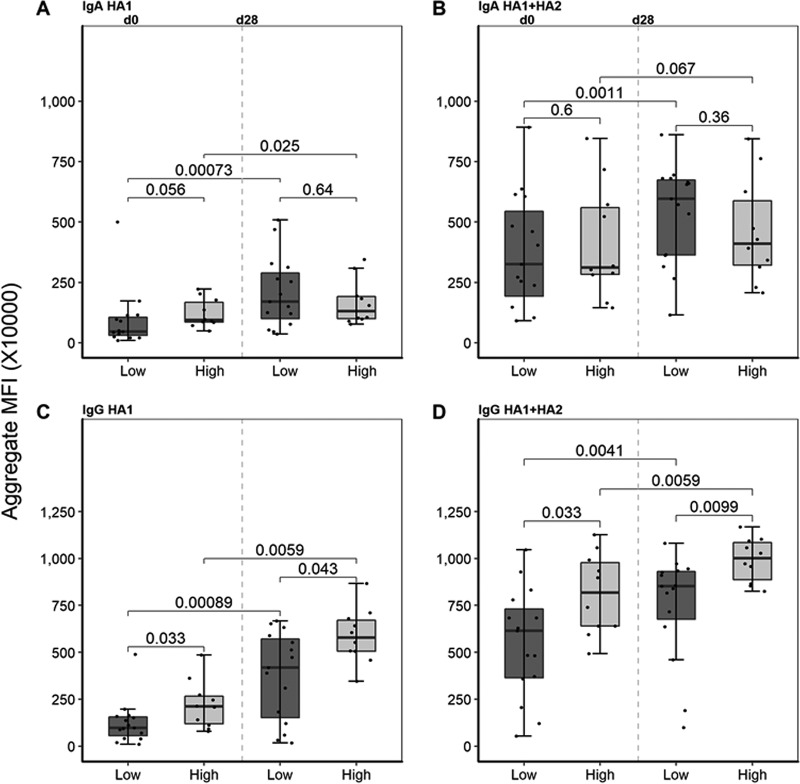
Current seasonal influenza virus vaccines engender antibody-mediated protection that is hemagglutinin (HA) subtype specific and relatively short-lived. Coverage for other subtypes or even variants within a subtype could be improved from a better understanding of the factors that promote HA-specific antibody cross-reactivity. Current assays to evaluate cross-reactivity, such as the ELISA, require a separate test for each antigen and are neither high-throughput nor sample-sparing. To address this need, we produced an array of 283 purified HA proteins from influenza A virus subtypes H1 to H16 and H18 and influenza B virus. To evaluate performance, arrays were probed with sera from individuals before and after a booster dose of inactivated heterologous H5N1 vaccine and naturally infected cases at presentation and follow-up during the 2010 to 2011 influenza season, when H3N2 was prevalent. The response to the H5 vaccine boost was IgG only and confined to H5 variants. The response to natural H3N2 infection consisted of IgG and IgA and was reactive with all H3 variants displayed, as well as against other group 2 HA subtypes. In both groups, responses to HA1 proteins were subtype specific. In contrast, baseline signals were higher, and responses broader, against full-length HA proteins (HA1+HA2) compared to HA1 alone. We propose that these elevated baseline signals and breadth come from the recognition of conserved epitopes in the stalk domain by cross-reactive antibodies accumulated from previous exposure(s) to seasonal influenza virus. This array is a valuable high-throughput alternative to the ELISA for monitoring specificity and cross-reactivity of HA antibodies and has many applications in vaccine development.IMPORTANCE Seasonal influenza is a serious public health problem because the viral infection spreads easily from person to person and because of antigenic drift in neutralizing epitopes. Influenza vaccination is the most effective way to prevent the disease, although challenging because of the constant evolution of influenza virus subtypes. Our high-throughput protein microarrays allow for interrogation of subunit-specific IgG and IgA responses to 283 different HA proteins comprised of HA1 and HA2 domains as well as full-length HA proteins. This provides a tool that allows for novel insights into the response to exposure to influenza virus antigens. Data generated with our technology will enhance our understanding of the factors that improve the strength, breadth, and durability of vaccine-mediated immune responses and develop more effective vaccines.

Keywords: hemagglutinin; influenza; protein microarrays.


Figures

FIG 1
FIG 1
Antibody reactivity against HA1 proteins after vaccination. Anti-IgG (A, B, and C) and anti-IgA (D and E) antibody responses after boosting with H5 vaccine are depicted as floating bar graphs or as Tukey box plots. Bar graphs are sorted by subtype and decreasing signal intensity (SI) at d28. Each bar represents the difference between the average signal intensities of two time points for a strain (blue dots, d0 SI; red dots, d28 SI; error bars, standard deviations [SD], n = 10). Dark bars indicate a positive difference between the two time points (d28 > d0), while light bars indicate a negative difference (d0 > d28). A heat map of delta values (d28 − d0) is shown above each graph. The orange area represents the signal intensity distribution (average ± 1 SD, n = 11) of a reference group (GCRC) with no active influenza virus infection or history of H5 vaccination. The Tukey box plots in panels B and E show H5 alone and pooled group 1 or group 2 subtype signal intensities. Panel C shows average signal intensities at the two time points among the various H5 clades. Means are indicated by “+.” The two-tailed Mann-Whitney test for unpaired data was used to calculate statistical significance between the two time points, where P < 0.05 defines statistical significance. HA1, hemagglutinin head domain; d0, day 0; d28, day 28; GCRC, General Clinical Research Center (UC Irvine).
FIG 2
FIG 2
Antibody reactivity against HA1 proteins during natural exposure. Anti-IgG (A and B) and anti-IgA (C and D) antibody responses during H3-confirmed natural exposure are depicted as floating bar graphs or as Tukey box plots. Bar graphs are sorted by subtype and decreasing signal intensity (SI) at t2. Each bar represents the difference between the average signal intensities of two time points for a strain (blue dots, t1 SI; red dots, t2 SI; error bars = SD, n = 5). Dark bars indicate a positive difference between the two time points (t2 > t1), while light bars indicate a negative difference (t1 > t2). A heat map of delta values (t2 − t1) is shown above each graph. The orange area represents the signal intensity distribution (average ± 1 SD, n = 11) of a reference group (GCRC) with no active influenza virus infection or history of H5 vaccination. The Tukey box plots show H3 alone and pooled group 1 or group 2 subtype signal intensities. Means are indicated by “+.” The two-tailed Mann-Whitney test for unpaired data was used to calculate statistical significance between the two time points, where P < 0.05 defines statistical significance. HA1, hemagglutinin head domain; t1, time point 1; t2, time point 2; GCRC, General Clinical Research Center (UC Irvine).
FIG 3
FIG 3
Antibody reactivity against whole HA (HA1+HA2) proteins after vaccination. Anti-IgG (A, B, and C) and anti-IgA (D and E) antibody responses after boosting with H5 vaccine are depicted as floating bar graphs or as Tukey box plots. Bar graphs are sorted by subtype and decreasing signal intensity (SI) at d28. Each bar represents the difference between the average signal intensities of two time points for a strain (blue dots, d0 SI; red dots, d28 SI; error bars, SD, n = 10). Dark bars indicate a positive difference between the two time points (d28 > d0), while light bars indicate a negative difference (d0 > d28). A heat map of delta values (d28 − d0) is shown above each graph. The orange area represents the signal intensity distribution (average ± 1 SD, n = 11) of a reference group (GCRC) with no active influenza virus infection or history of H5 vaccination. The Tukey box plots in panels B and E show H5 alone and pooled group 1 or group 2 subtype signal intensities. Panel C shows average signal intensities at the two time points among the various H5 clades; clade 2.5 is not represented in this data set. Means are indicated by “+.” The two-tailed Mann-Whitney test for unpaired data was used to calculate statistical significance between the two time points, where P < 0.05 defines statistical significance. HA1, hemagglutinin head domain; d0, day 0; d28, day 28; GCRC, General Clinical Research Center (UC Irvine).
FIG 4
FIG 4
Antibody reactivity against whole HA (HA1+HA2) proteins during natural exposure. Anti-IgG (A and B) and anti-IgA (C and D) antibody responses during H3-confirmed natural exposure are depicted as floating bar graphs or as Tukey box plots. Bar graphs are sorted by subtype and decreasing signal intensity (SI) at t2. Each bar represents the difference between the average signal intensities of two time points for a strain (blue dots, t1 SI; red dots, t2 SI; error bars, SD, n = 5). Dark bars indicate a positive difference between the two time points (t2 > t1), while light bars indicate a negative difference (t1 > t2). A heat map of delta values (t2 − t1) is shown above each graph. The orange area represents the signal intensity distribution (average ± 1 SD, n = 11) of a reference group (GCRC) with no active influenza virus infection or history of H5 vaccination. The Tukey box plots show H3 alone and pooled group 1 or group 2 subtype signal intensities. Means are indicated by “+.” The two-tailed Mann-Whitney test for unpaired data was used to calculate statistical significance between the two time points, where P < 0.05 defines statistical significance. HA1, hemagglutinin head domain; t1, time point 1; t2, time point 2; GCRC, General Clinical Research Center (UC Irvine).
FIG 5
FIG 5
IgA and IgG aggregated signal intensities in low-dose and high-dose H5 vaccine recipients. H5 vaccine recipients are stratified by the vaccine dose that they received 1 year prior to boost (low, 15 µg; high, 90 µg). Their antibody reactivities against H5 strains at two time points, d0 and d28, are depicted as Tukey box plots, with medians represented by horizontal bars. “d0” refers to 1 year after primary vaccination, and “d28” refers to 28 days after receiving a 90-µg boost. (A and B) IgA antibody responses of low- and high-dose vaccinees, against HA1 only (A) and HA1+HA2 proteins (B) on d0 and d28. (C and D) IgG antibody responses of low- and high-dose vaccinees, against HA1 only (C) and HA1+HA2 proteins (D) on d0 and d28. Differences between high- and low-dose groups were analyzed using the Wilcoxon rank sum test, and those between time points were analyzed using the Wilcoxon signed-rank test where significance was set at P < 0.05.

Similar articles

Cited by

References

    1. Iuliano AD, Roguski KM, Chang HH, Muscatello DJ, Palekar R, Tempia S, Cohen C, Gran JM, Schanzer D, Cowling BJ, Wu P, Kyncl J, Ang LW, Park M, Redlberger-Fritz M, Yu H, Espenhain L, Krishnan A, Emukule G, van Asten L, Pereira da Silva S, Aungkulanon S, Buchholz U, Widdowson M-A, Bresee JS, Azziz-Baumgartner E, Cheng P-Y, Dawood F, Foppa I, Olsen S, Haber M, Jeffers C, MacIntyre CR, for the Global Seasonal Influenza-Associated Mortality Collaborator Network. 2018. Estimates of global seasonal influenza-associated respiratory mortality: a modelling study. Lancet 391:1285–1300. doi:10.1016/S0140-6736(17)33293-2. - DOI - PMC - PubMed
    1. Smith DJ, Lapedes AS, de Jong JC, Bestebroer TM, Rimmelzwaan GF, Osterhaus AD, Fouchier RA. 2004. Mapping the antigenic and genetic evolution of influenza virus. Science 305:371–376. doi:10.1126/science.1097211. - DOI - PubMed
    1. Koel BF, Burke DF, Bestebroer TM, van der Vliet S, Zondag GC, Vervaet G, Skepner E, Lewis NS, Spronken MI, Russell CA, Eropkin MY, Hurt AC, Barr IG, de Jong JC, Rimmelzwaan GF, Osterhaus AD, Fouchier RA, Smith DJ. 2013. Substitutions near the receptor binding site determine major antigenic change during influenza virus evolution. Science 342:976–979. doi:10.1126/science.1244730. - DOI - PubMed
    1. Fantoni A, Arena C, Corrias L, Salez N, de Lamballerie XN, Amoros JP, Blanchon T, Varesi L, Falchi A. 2014. Genetic drift of influenza A(H3N2) viruses during two consecutive seasons in 2011-2013 in Corsica, France. J Med Virol 86:585–591. doi:10.1002/jmv.23745. - DOI - PubMed
    1. World Health Organization. 2010. Pandemic (H1N1) 2009—update 112. www.who.int/csr/don/2010_08_06/en/index.html.

Publication types

MeSH terms