

The Phylogenomic Diversity of Herbivore-Associated Fibrobacter spp. Is Correlated to Lignocellulose-Degrading Potential
- PMID: 30541780
- PMCID: PMC6291624
- DOI: 10.1128/mSphere.00593-18
The Phylogenomic Diversity of Herbivore-Associated Fibrobacter spp. Is Correlated to Lignocellulose-Degrading Potential
Abstract
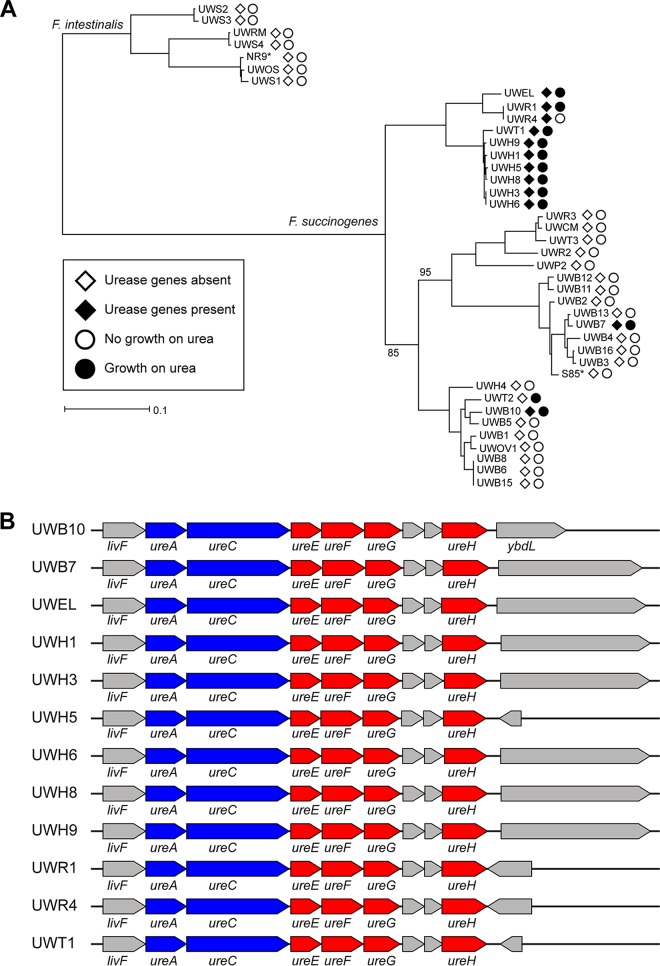
Members of the genus Fibrobacter are cellulose-degrading bacteria and common constituents of the gastrointestinal microbiota of herbivores. Although considerable phylogenetic diversity is observed among members of this group, few functional differences explaining the distinct ecological distributions of specific phylotypes have been described. In this study, we sequenced and performed a comparative analysis of whole genomes from 38 novel Fibrobacter strains against the type strains for the two formally described Fibrobacter species F. succinogenes strain S85 and F. intestinalis strain NR9. Significant differences in the number of genes encoding carbohydrate-active enzyme families involved in plant cell wall polysaccharide degradation were observed among Fibrobacter phylotypes. F. succinogenes genomes were consistently enriched in genes encoding carbohydrate-active enzymes compared to those of F. intestinalis strains. Moreover, genomes of F. succinogenes phylotypes that are dominant in the rumen had significantly more genes annotated to major families involved in hemicellulose degradation (e.g., CE6, GH10, and GH43) than did the genomes of F. succinogenes phylotypes typically observed in the lower gut of large hindgut-fermenting herbivores such as horses. Genes encoding a putative urease were also identified in 12 of the Fibrobacter genomes, which were primarily isolated from hindgut-fermenting hosts. Screening for growth on urea as the sole source of nitrogen provided strong evidence that the urease was active in these strains. These results represent the strongest evidence reported to date for specific functional differences contributing to the ecology of Fibrobacter spp. in the herbivore gut.IMPORTANCE The herbivore gut microbiome is incredibly diverse, and a functional understanding of this diversity is needed to more reliably manipulate this community for specific gain, such as increased production in ruminant livestock. Microbial degraders of plant cell wall polysaccharides in the herbivore gut, particularly Fibrobacter spp., are of fundamental importance to their hosts for digestion of a diet consisting primarily of recalcitrant plant fibers. Considerable phylogenetic diversity exists among members of the genus Fibrobacter, but much of this diversity remains cryptic. Here, we used comparative genomics, applied to a diverse collection of recently isolated Fibrobacter strains, to identify a robust association between carbohydrate-active enzyme gene content and the Fibrobacter phylogeny. Our results provide the strongest evidence reported to date for functional differences among Fibrobacter phylotypes associated with either the rumen or the hindgut and emphasize the general significance of carbohydrate-active enzymes in the evolution of fiber-degrading bacteria.
Keywords: Fibrobacter; carbohydrate-active enzymes; cellulose; fiber; genomics; gut microbiota; herbivores.
Copyright © 2018 Neumann and Suen.
Figures


Similar articles
-
Fibrobacter communities in the gastrointestinal tracts of diverse hindgut-fermenting herbivores are distinct from those of the rumen.Environ Microbiol. 2017 Sep;19(9):3768-3783. doi: 10.1111/1462-2920.13878. Epub 2017 Aug 24. Environ Microbiol. 2017. PMID: 28752955 Free PMC article.
-
The Fibrobacteres: an important phylum of cellulose-degrading bacteria.Microb Ecol. 2012 Feb;63(2):267-81. doi: 10.1007/s00248-011-9998-1. Epub 2012 Jan 3. Microb Ecol. 2012. PMID: 22213055 Review.
-
Fiber-degrading systems of different strains of the genus Fibrobacter.Appl Environ Microbiol. 2004 Apr;70(4):2172-9. doi: 10.1128/AEM.70.4.2172-2179.2004. Appl Environ Microbiol. 2004. PMID: 15066810 Free PMC article.
-
The complete genome sequence of Fibrobacter succinogenes S85 reveals a cellulolytic and metabolic specialist.PLoS One. 2011 Apr 19;6(4):e18814. doi: 10.1371/journal.pone.0018814. PLoS One. 2011. PMID: 21526192 Free PMC article.
-
Ecological and physiological characterization shows that Fibrobacter succinogenes is important in rumen fiber digestion - review.Folia Microbiol (Praha). 2008;53(3):195-200. doi: 10.1007/s12223-008-0024-z. Epub 2008 Jul 27. Folia Microbiol (Praha). 2008. PMID: 18661290 Review.
Cited by
-
Effects of dietary supplementation with Ampelopsis grossedentata extract on production performance and body health of hens.Trop Anim Health Prod. 2022 Jan 11;54(1):45. doi: 10.1007/s11250-022-03044-7. Trop Anim Health Prod. 2022. PMID: 35015154
-
Changes in the faecal microbiota of horses and ponies during a two-year body weight gain programme.PLoS One. 2020 Mar 19;15(3):e0230015. doi: 10.1371/journal.pone.0230015. eCollection 2020. PLoS One. 2020. PMID: 32191712 Free PMC article.
-
Differential Microbial Composition and Fiber Degradation in Two Sloth Species (Bradypus variegatus and Choloepus hoffmanni).Curr Microbiol. 2025 Jun 7;82(7):327. doi: 10.1007/s00284-025-04303-0. Curr Microbiol. 2025. PMID: 40481853
-
Natural Foraging Selection and Gut Microecology of Two Subterranean Rodents from the Eurasian Steppe in China.Animals (Basel). 2024 Aug 13;14(16):2334. doi: 10.3390/ani14162334. Animals (Basel). 2024. PMID: 39199868 Free PMC article.
-
Targeted Screening of Fiber Degrading Bacteria with Probiotic Function in Herbivore Feces.Probiotics Antimicrob Proteins. 2025 Jun;17(3):1473-1497. doi: 10.1007/s12602-024-10215-5. Epub 2024 Feb 1. Probiotics Antimicrob Proteins. 2025. PMID: 38300451
References
Publication types
MeSH terms
Substances
Grants and funding
LinkOut - more resources
Full Text Sources
Miscellaneous
