. 2019 Feb 5;93(4):e01684-18.
doi: 10.1128/JVI.01684-18. Print 2019 Feb 15.

Verdinexor (KPT-335), a Selective Inhibitor of Nuclear Export, Reduces Respiratory Syncytial Virus Replication In Vitro

Affiliations

Verdinexor (KPT-335), a Selective Inhibitor of Nuclear Export, Reduces Respiratory Syncytial Virus Replication In Vitro

Patricia A Jorquera et al. J Virol. .

Abstract

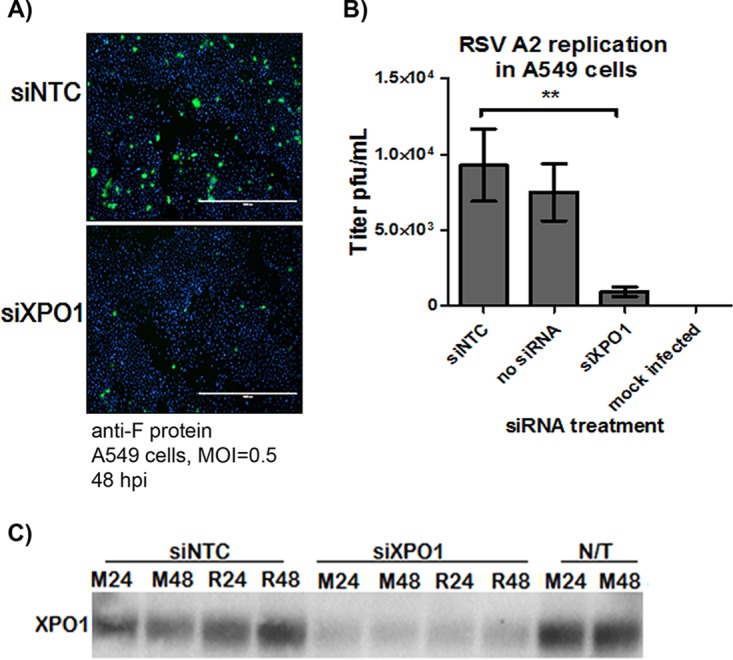
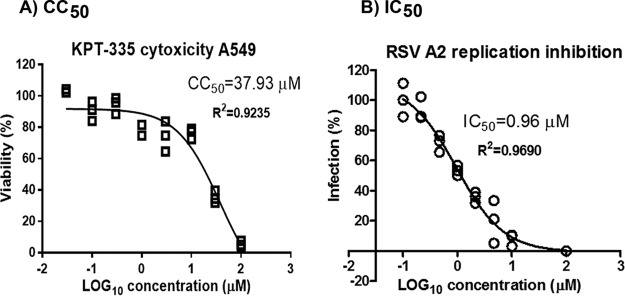
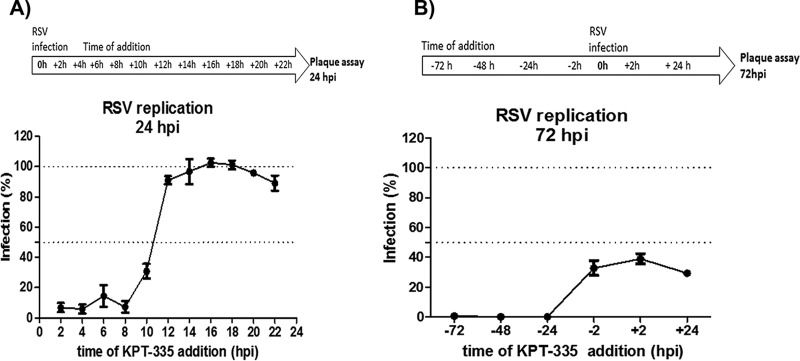
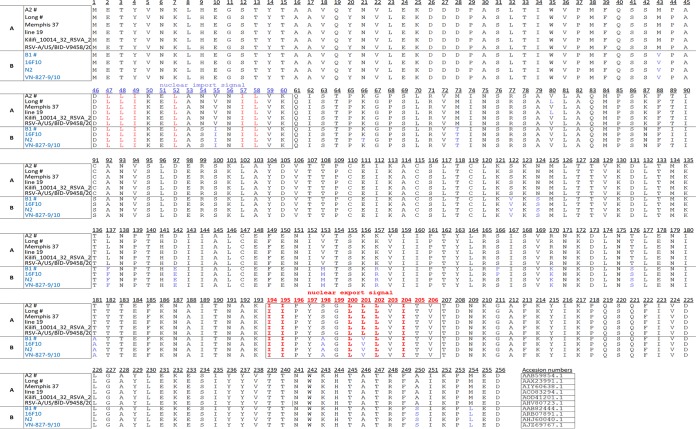
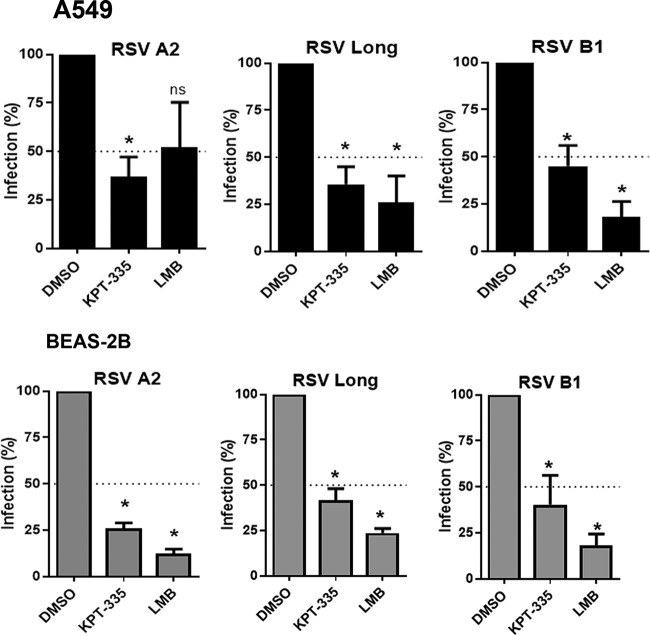
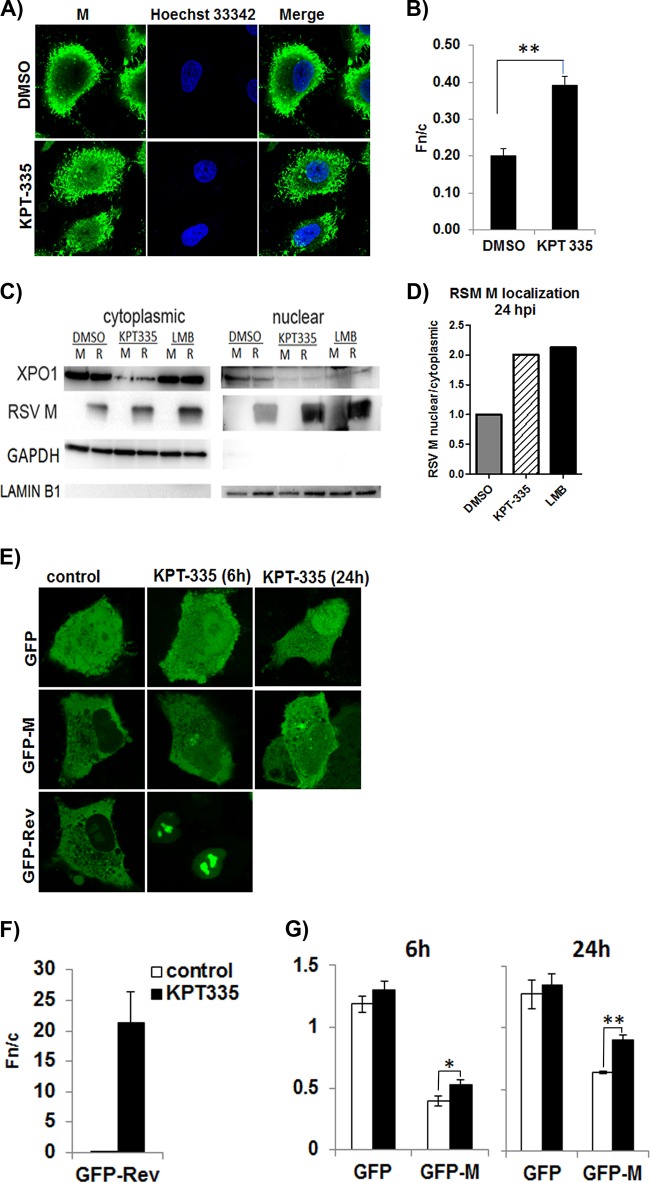
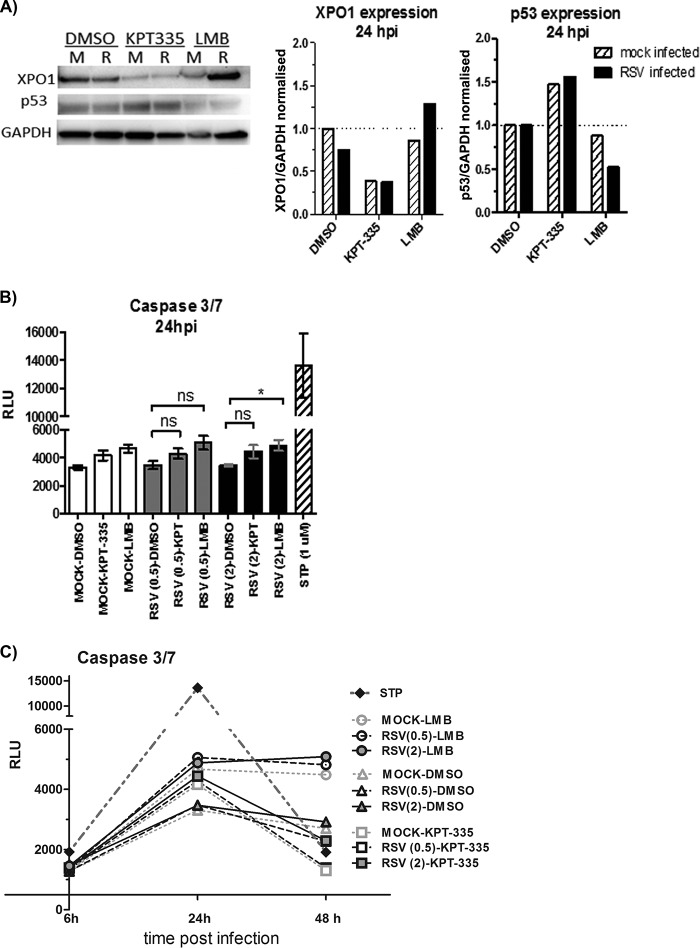
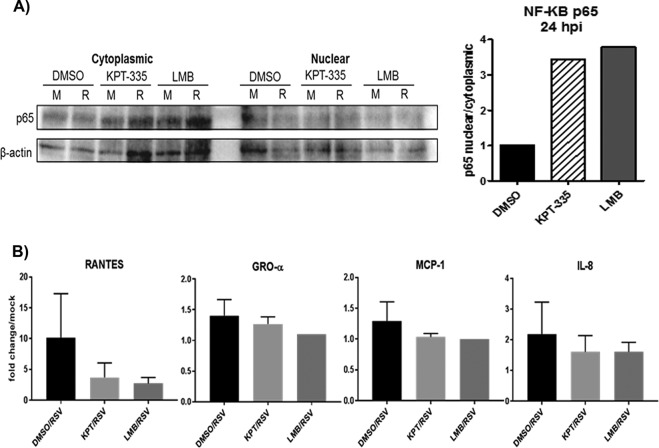
Respiratory syncytial virus (RSV) is a leading cause of hospitalization of infants and young children, causing considerable respiratory disease and repeat infections that may lead to chronic respiratory conditions such as asthma, wheezing, and bronchitis. RSV causes ∼34 million new episodes of lower respiratory tract illness (LRTI) in children younger than 5 years of age, with >3 million hospitalizations due to severe RSV-associated LRTI. The standard of care is limited to symptomatic relief as there are no approved vaccines and few effective antiviral drugs; thus, a safe and efficacious RSV therapeutic is needed. Therapeutic targeting of host proteins hijacked by RSV to facilitate replication is a promising antiviral strategy as targeting the host reduces the likelihood of developing drug resistance. The nuclear export of the RSV M protein, mediated by the nuclear export protein exportin 1 (XPO1), is crucial for RSV assembly and budding. Inhibition of RSV M protein export by leptomycin B correlated with reduced RSV replication in vitro In this study, we evaluated the anti-RSV efficacy of Verdinexor (KPT-335), a small molecule designed to reversibly inhibit XPO1-mediated nuclear export. KPT-335 inhibited XPO1-mediated transport and reduced RSV replication in vitro KPT-335 was effective against RSV A and B strains and reduced viral replication following prophylactic or therapeutic administration. Inhibition of RSV replication by KPT-335 was due to a combined effect of reduced XPO1 expression, disruption of the nuclear export of RSV M protein, and inactivation of the NF-κB signaling pathway.IMPORTANCE RSV is an important cause of LRTI in infants and young children for which there are no suitable antiviral drugs offered. We evaluated the efficacy of KPT-335 as an anti-RSV drug and show that KPT-335 inhibits XPO1-mediated nuclear export, leading to nuclear accumulation of RSV M protein and reduction in RSV levels. KPT-335 treatment also resulted in inhibition of proinflammatory pathways, which has important implications for its effectiveness in vivo.

Keywords: KPT-335; M protein; RSV; Verdinexor; XPO1; exportin 1; nuclear export; respiratory syncytial virus.


Figures

FIG 1
FIG 1
XPO1 expression is required for RSV infection. A549 cells were transfected with a SMARTpool siRNA designed to target XPO1 mRNA (siXPO1) or with an siRNA nontargeting control (siNTC). At 48 h post-siRNA transfection, cells were infected with RSV A2 (MOI of 0.5), and the infection was monitored at 48 h p.i. by F protein immunostaining (A) and RSV plaque assay (B). Inhibition of XPO1 expression was confirmed by Western blotting (C) in A549 cells infected with RSV (R) or mock infected (M) at 24 or 48 h p.i. (48 h and 96 h post-siRNA transfection, respectively). A Mann-Whitney nonparametric, two-tailed test was used to determine differences between groups, and significant differences are indicated. **, P < 0.001.
FIG 2
FIG 2
KPT-335 inhibits RSV replication. (A) A549 cells were treated with DMSO or increasing concentrations of KPT-335 for 72 h. At 70 h posttreatment, 20 μl of CellTiter Blue reagent was added to each well and incubated for 2 h at 37°C. The plate was shaken for 10 s, and fluorescence emission was measured at 560/590 nm. The average fluorescence value of the culture medium background (wells containing no cells) was subtracted from each experimental well. The mean fluorescence emission values of the wells containing DMSO only were considered 100% viability and were used to calculate percent relative cell viability of the wells containing KPT-335. The percent viability versus the log10 concentration of KPT-335 was plotted using GraphPad Prism, and the values were fitted to a nonlinear regression curve to determine the CC50. The data shown are from triplicate samples from one experiment and are representative of three independent experiments. (B) A549 cells were infected with RSV A2 (MOI of 0.5) and treated with increasing amounts of KPT-335 from 2 h p.i. Samples were collected at 72 h p.i., and titers of infectious RSV were determined by immuno-plaque assay as described in Materials and Methods. Average RSV titer in infected samples treated with DMSO was taken as 100% and served as the control; this value was used to calculate percent infection of the samples treated with KPT-335. The percent infection versus the log10 concentration of KPT-335 was plotted using GraphPad Prism, and the values were fitted to a nonlinear regression curve to determine the IC50. The data shown are from triplicate samples from one experiment and are representative of three independent experiments.
FIG 3
FIG 3
KPT-335 is effective against RSV when provided therapeutically or prophylactically. (A) A549 cells were infected with RSV A2 for 2 h (MOI of 0.5), inoculum was removed, and KPT-335 was added as a single dose (1 μM) at 2, 4, 6, 8, 10, 12, 14, 16, 18, 20, or 22 h p.i. At 24 h p.i., samples were collected, and percent RSV infection was determined by immunostaining plaque assay. Average RSV titer at 24 h p.i. in infected samples treated with DMSO was taken as 100% and served as a control; this value was used to calculate percent infection of the samples treated with KPT-335. The means ± standard errors of the means of percent infection versus time of addition of KPT-335 are shown. (B) A549 cells were treated with 1 μM KPT-335 at 72, 48, 24, or 2 h prior to infection (prophylactic treatment) or at 2 or 24 h p.i. (therapeutic treatment). Samples were collected at 72 h p.i., and virus production was quantified by plaque assay. Average RSV titers at 72 h p.i. in infected samples treated with DMSO was taken as 100% and served as control; this value was used to calculate percent infection of the samples treated with KPT-335. The mean ± SEM of percent infection versus time of addition of KPT-335 is shown. The data shown are from three independent experiments. The experimental timeline is depicted above each graph.
FIG 4
FIG 4
M protein is conserved across RSV A and B strains. The amino acid sequence of the RSV M protein from the indicated strains is shown. The nuclear export signal (NES) sequence is shown within a black frame. NES are 8 to 15 residues long and conform to the consensus Φ1-X2,3-Φ2-X2,3-Φ3-X-Φ4 where Φn represents Leu, Val, Ile, Phe, or Met, and X can be any amino acid (39). GenBank accession numbers are indicated at the end of the sequence. #, viruses tested in this study.
FIG 5
FIG 5
KPT-335 inhibits replication of RSV A and B strains independent of the host cell line. A549 or BEAS-2B cells were infected with RSV A2, A/Long, or B1 strain at an MOI of 0.5. At 2 h p.i., medium was replaced with fresh medium containing 1 μM KPT-335 or 750 nm LMB or DMSO as a control. Samples were collected at 24 h p.i., and virus production was quantified by plaque assay. Average RSV titers at 24 h p.i. in infected samples treated with DMSO was taken as 100% and served as control; this value was used to calculate percent infection of the samples treated with KPT-335 or LMB. The means ± standard errors of the means of percent infection versus time of addition of KPT-335 are shown. The data shown are from three independent experiments. The cell lines and virus strains are indicated on the graphs. The Kruskal-Wallis one-way analysis of variance (ANOVA) was used to determine differences between groups, and significant differences are indicated. *, P < 0.05; ns, nonsignificant (P > 0.05).
FIG 6
FIG 6
KPT-335 treatment leads to nuclear accumulation of M protein and XPO1. (A) Monolayers of A549 cells propagated to 80% confluence in 12-well plates containing coverslips were infected with RSV A2 followed by treatment with 1 μM KPT-335 during the early (6 to 18 h p.i.) or late stages (18 to 30 h p.i.) of infection and analyzed at 48 h p.i. by immunofluorescence confocal microscopy for localization of M protein. Cells treated with DMSO were taken as a control. Digital images of 0.5-μm sections were captured with a Nikon Ti-Eclipse confocal system and NIS AR Elements software. (B) Image J was used to determine the nuclear/cytoplasmic ratio (Fn/c) of RSV-M [Fn/c = (Fn − Fb)/(Fc − Fb)], where Fn is the nuclear fluorescence, Fc is the cytoplasmic fluorescence, and Fb is the background or autofluorescence in images such as those shown in panel A. Data shown are means ± standard errors of the means (n ≥ 30) and representative of three independent experiments. Two-way ANOVA followed by Fisher’s least significant difference test was used to determine differences between groups, and statistically significant differences are indicated. **, P < 0.01. (C) RSV A2 infected (R) or mock-infected (M) A549 cells were treated with 1 μM KPT-335, DMSO, or 750 nM LMB from 2 h p.i. Fractions were collected at 24 h p.i., utilizing an NE-PER nuclear and cytoplasmic purification kit. Equivalent protein concentrations of the 24-h p.i. cytoplasmic and nuclear fractions were resolved by SDS-polyacrylamide gel electrophoresis, followed by immunoblotting. Blots were probed for XPO1 and RSV M protein. GAPDH and lamin B1 were used as markers for cytoplasmic and nuclear fractions, respectively. The primary antibodies used are indicated on the left. Images are single blots from one experiment representative of three different experiments; the white line observed in the lamin B1 blot is an artifact produced during exposure and image capture. (D) The relative amount of RSV M protein in the nucleus compared to that in the cytoplasm was estimated by densitometric scanning of the protein bands using ImageJ. Data shown are relative to value for the DMSO-treated samples, taken as 1. (E) A549 cells were transfected using Lipofectamine. After 18 h of incubation, the cells were treated with DMSO or 1 μM KPT-335 for 6 or 24 h. Digital images of 0.5-μm sections were captured with a Nikon Ti-Eclipse confocal system and NIS AR Elements software and representative images are shown. Image J was used to analyze the digital images and determine the Fn/c as described in the legend of Fig. 5. Data are shown in histograms for GFP-Rev after 6 h of treatment with KPT-335 or DMSO (control) (F) and GFP and GFP-M after 6 h and 24 h of treatment with KPT-335 or DMSO (control) (G). Data shown are means ± standard errors of the means (n ≥ 30) and are representative of three independent experiments. Two-way ANOVA followed by Fisher’s least significant difference test was used to determine differences between groups, and statistically significant differences are indicated. *, P < 0.05; **, P < 0.001.
FIG 7
FIG 7
KPT-335 reduces XPO1 expression and increases p53 expression without inducing apoptosis. (A) RSV-infected (R) or mock-infected (M) A549 cells were treated with 1 μM KPT-335, DMSO, or 750 nM LMB from 2 h p.i. Total cell lysate was collected at 24 h p.i. and analyzed by Western blotting as described in the legend of Fig. 5. Blots were probed for XPO1 and p53, with GAPDH used as a loading control. The primary antibodies used are indicated on the left. XPO1 and p53 expression was quantified using ImageJ, normalized to the level of GAPDH. Data shown are relative to values for DMSO-treated samples, taken as 1. (B) A549 cells were infected with RSV at an MOI of 0.5 or 2.0. KPT-335, DMSO, or LMB was added at 2 h p.i., and samples were collected at 24 h p.i. Assay controls included wells without cells (background), mock-infected cells (negative control), and cells treated with 1 μM staurosporine (STP) for 4 h (positive control). At 24 h p.i., plates were equilibrated at room temperature for 30 min, and 100 μl of Caspase-Glo 3/7 reagent was added to each well and incubated for 3 h at room temperature. Luminescence was measured using a Tecan microplate reader, and the background RLU count (wells without cells) was subtracted from each well. A Kruskal-Wallis one-way ANOVA was used to determine differences between groups, and statistically significant differences are indicated. *, P < 0.05; ns, nonsignificant (P > 0.05). (C) A549 cells were infected with RSV at an MOI of 0.5 or 2.0. KPT-335, DMSO, or LMB was added at 2 h p.i., and samples were collected at 6, 24, or 48 h p.i. At the indicated times plates were equilibrated at room temperature for 30 min, and 100 μl of Caspase-Glo 3/7 reagent was added to each well and incubated for 3 h at room temperature. Luminescence was measured using a Tecan microplate reader, and the background RLU count (wells without cells) was subtracted from each well.
FIG 8
FIG 8
KPT-335 induces NF-κB nuclear accumulation and varied cytokine expression. RSV A2-infected A549 cells were treated with 1 μM KPT-335, DMSO, or 750 nM LMB from 2 h p.i. Fractions were collected at 24 h p.i. utilizing an NE-PER nuclear and cytoplasmic purification kit, and analyzed by Western blotting as described in the legend of Fig. 6. Blots were probed for p65, and GAPDH and lamin B1 were used as controls. The relative amount of p65 in the nucleus compared to that in the cytoplasm was estimated by densitometric scanning of the protein bands using ImageJ. Data shown are relative to values for DMSO-treated samples, taken as 1. (B) RSV-infected A549 cells were treated with DMSO, KPT-335, or LMB from 2 h p.i.; mock-infected cells served as controls. Supernatants were collected at 24 h p.i. Culture supernatants were clarified by centrifugation before proinflammatory cytokine and chemokine protein expression was examined with a Multi-Analyte ELISArray kit. Fold change was calculated relative to values in mock-infected samples.

Similar articles

Cited by

References

    1. Iwane MK, Edwards KM, Szilagyi PG, Walker FJ, Griffin MR, Weinberg GA, Coulen C, Poehling KA, Shone LP, Balter S, Hall CB, Erdman DD, Wooten K, Schwartz B, New Vaccine SN. 2004. Population-based surveillance for hospitalizations associated with respiratory syncytial virus, influenza virus, and parainfluenza viruses among young children. Pediatrics 113:1758–1764. doi:10.1542/peds.113.6.1758. - DOI - PubMed
    1. Falsey AR, Hennessey PA, Formica MA, Cox C, Walsh EE. 2005. Respiratory syncytial virus infection in elderly and high-risk adults. N Engl J Med 352:1749–1759. doi:10.1056/NEJMoa043951. - DOI - PubMed
    1. Falsey AR, Walsh EE, Looney RJ, Kolassa JE, Formica MA, Criddle MC, Hall WJ. 1999. Comparison of respiratory syncytial virus humoral immunity and response to infection in young and elderly adults. J Med Virol 59:221–226. doi:10.1002/(SICI)1096-9071(199910)59:2<221::AID-JMV16>3.0.CO;2-H. - DOI - PubMed
    1. Rima B, Collins P, Easton A, Fouchier R, Kurath G, Lamb RA, Lee B, Maisner A, Rota P, Wang L, ICTV Report Consortium . 2017. ICTV virus taxonomy profile: Pneumoviridae. J Gen Virol 98:2912–2913. doi:10.1099/jgv.0.000959. - DOI - PMC - PubMed
    1. Collins PL. 2011. Human respiratory syncytial virus, p 341–410. In Samal SK. (ed), The biology of paramyxoviruses. Caister Academic Press, Norfolk, United Kingdom.

Publication types

MeSH terms

LinkOut - more resources