. 2019 Feb 19;93(5):e01978-18.
doi: 10.1128/JVI.01978-18. Print 2019 Mar 1.

Genome-Wide Identification of Direct RTA Targets Reveals Key Host Factors for Kaposi's Sarcoma-Associated Herpesvirus Lytic Reactivation

Affiliations

Genome-Wide Identification of Direct RTA Targets Reveals Key Host Factors for Kaposi's Sarcoma-Associated Herpesvirus Lytic Reactivation

Bernadett Papp et al. J Virol. .

Abstract

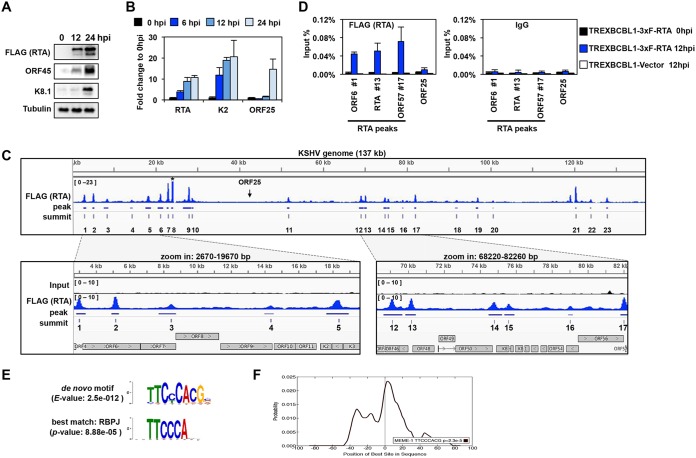
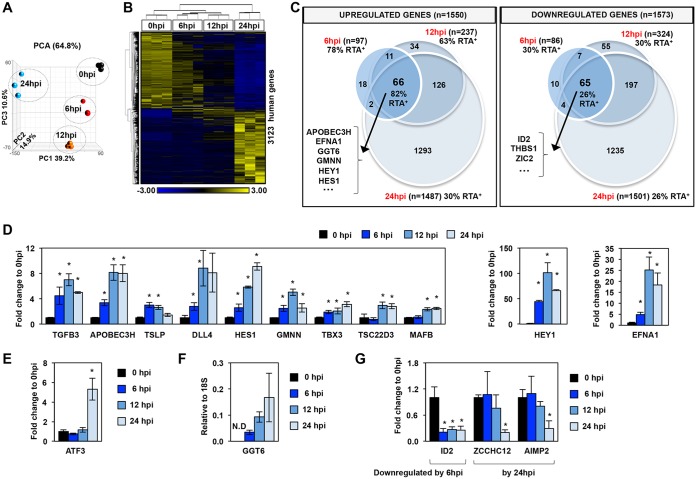
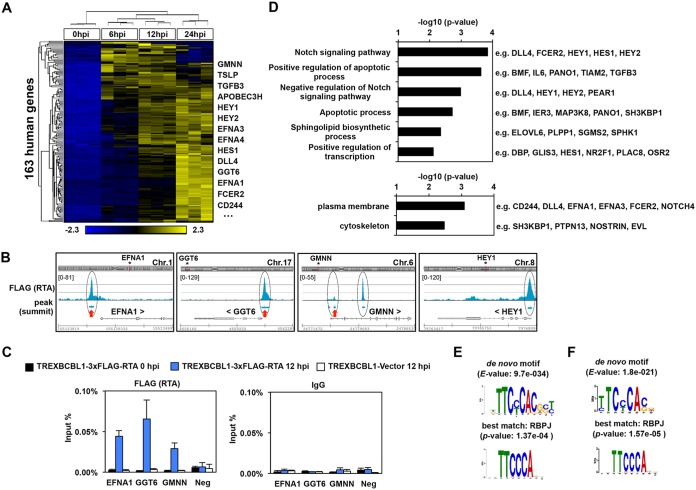
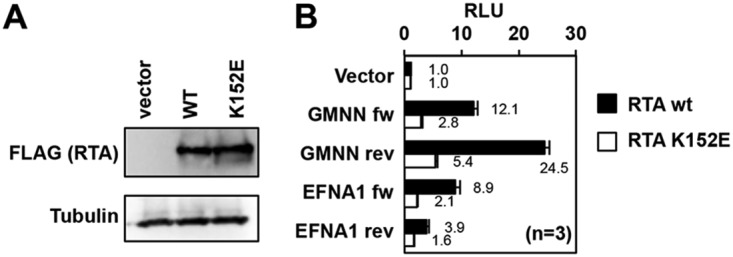
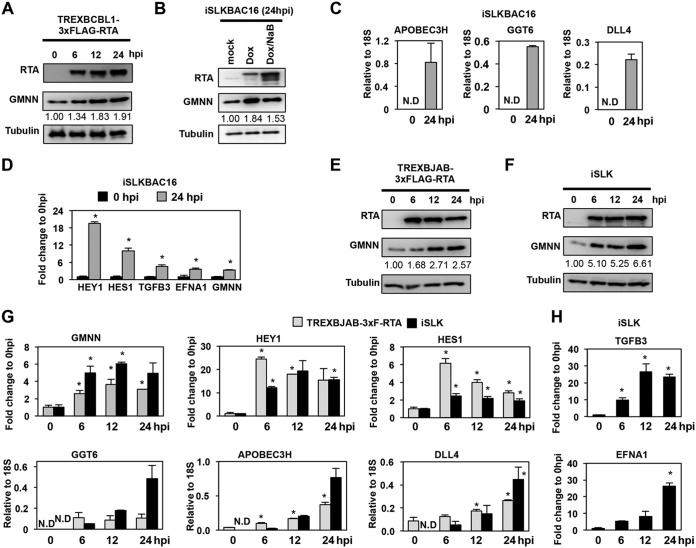
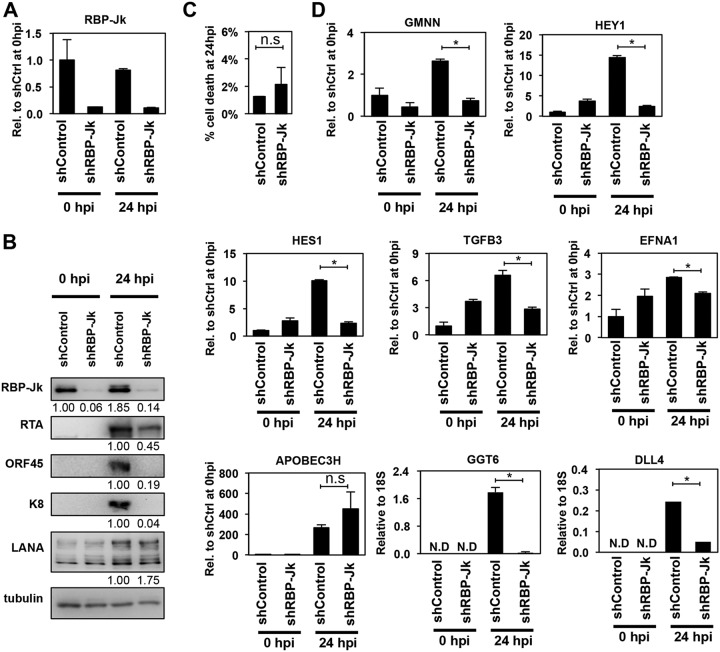
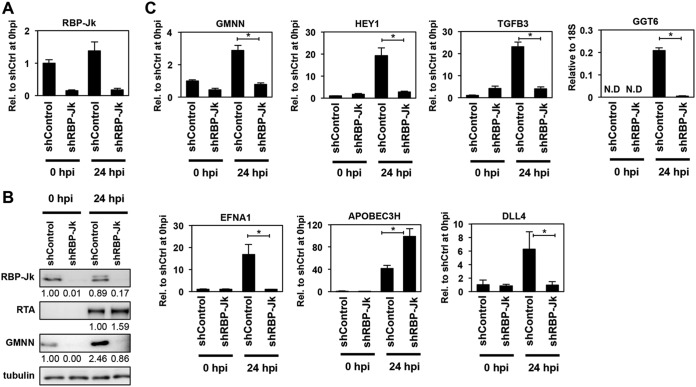
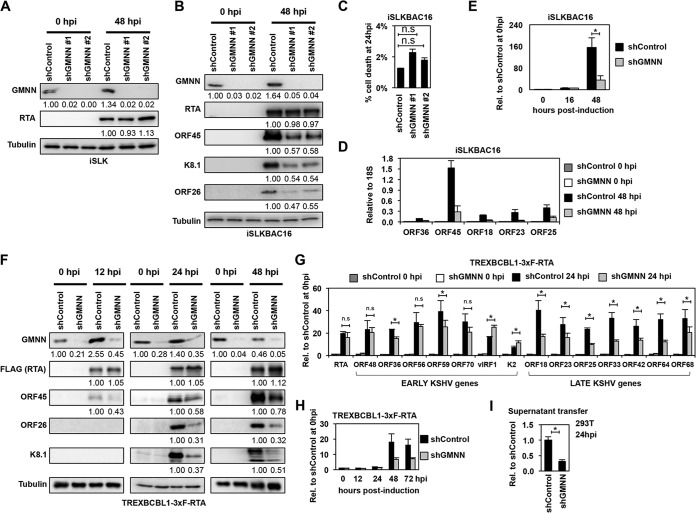
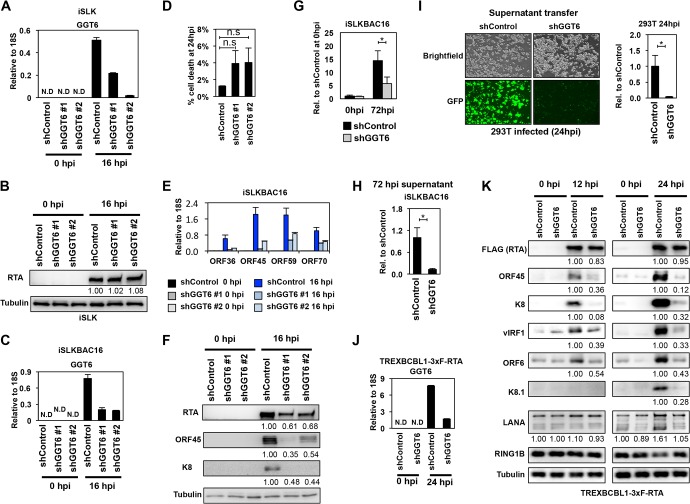
Kaposi's sarcoma-associated herpesvirus (KSHV) is a human oncogenic virus, which maintains the persistent infection of the host by intermittently reactivating from latently infected cells to produce viral progenies. While it is established that the replication and transcription activator (RTA) viral transcription factor is required for the induction of lytic viral genes for KSHV lytic reactivation, it is still unknown to what extent RTA alters the host transcriptome to promote KSHV lytic cycle and viral pathogenesis. To address this question, we performed a comprehensive time course transcriptome analysis during KSHV reactivation in B-cell lymphoma cells and determined RTA-binding sites on both the viral and host genomes, which resulted in the identification of the core RTA-induced host genes (core RIGs). We found that the majority of RTA-binding sites at core RIGs contained the canonical RBP-Jκ-binding DNA motif. Subsequently, we demonstrated the vital role of the Notch signaling transcription factor RBP-Jκ for RTA-driven rapid host gene induction, which is consistent with RBP-Jκ being essential for KSHV lytic reactivation. Importantly, many of the core RIGs encode plasma membrane proteins and key regulators of signaling pathways and cell death; however, their contribution to the lytic cycle is largely unknown. We show that the cell cycle and chromatin regulator geminin and the plasma membrane protein gamma-glutamyltransferase 6, two of the core RIGs, are required for efficient KSHV reactivation and virus production. Our results indicate that host genes that RTA rapidly and directly induces can be pivotal for driving the KSHV lytic cycle.IMPORTANCE The lytic cycle of KSHV is involved not only in the dissemination of the virus but also viral oncogenesis, in which the effect of RTA on the host transcriptome is still unclear. Using genomics approaches, we identified a core set of host genes which are rapidly and directly induced by RTA in the early phase of KSHV lytic reactivation. We found that RTA does not need viral cofactors but requires its host cofactor RBP-Jκ for inducing many of its core RIGs. Importantly, we show a critical role for two of the core RIGs in efficient lytic reactivation and replication, highlighting their significance in the KSHV lytic cycle. We propose that the unbiased identification of RTA-induced host genes can uncover potential therapeutic targets for inhibiting KSHV replication and viral pathogenesis.

Keywords: Kaposi’s sarcoma-associated herpesvirus; RTA; lytic reactivation; primary effusion lymphoma; regulation of gene expression.


Figures

FIG 1
FIG 1
Genome-wide mapping of the RTA-binding sites on the viral genome during KSHV lytic reactivation. (A) Immunoblot analysis of viral protein expression in TRExBCBL1-3×FLAG-RTA cells during latency (0 hpi), at 12 hpi, and 24 hpi. 3×FLAG-RTA was detected by anti-FLAG antibody. (B) RT-qPCR analysis of viral gene expression in TRExBCBL1-3×FLAG-RTA at the indicated time points. (C) Snapshot of RTA binding on the KSHV genome (1 to 137168 bp) (GenBank accession no. NC_009333.1) in TRExBCBL1-3×FLAG-RTA cells at 12 hpi, which was identified by RTA (FLAG) ChIP-seq (top graph). The terminal repeats were excluded. The bottom graphs are zoomed-in views of RTA binding and their corresponding inputs in the indicated KSHV genomic regions. The genomic coordinates of the 23 RTA peaks are listed in Table 1. Note that the peak 8 is out of range. The arrow indicates the location of ORF25. (D) RTA (using FLAG antibody) and IgG ChIP assays were performed at 0 hpi and 12 hpi by using TRExBCBL1-3×FLAG-RTA cells, followed by qPCR quantification of the immunoprecipitated DNA at the indicated RTA-binding sites. The ORF25 region and the TRExBCBL1-Vector cell line were used as negative controls. (E) MEME/TOMTOM analysis was applied to identify the most significantly enriched de novo motif within the 50-bp radius of the 23 RTA peak summits on the KSHV genome (top), which matched to the RBP-Jκ-binding motif (bottom). (F) CentriMo analysis of 100-bp radius of the RTA-binding summits shows that the probability of the RBP-Jκ-binding motif is the highest at the summit of the RTA binding.
FIG 2
FIG 2
Global host gene expression changes in PEL cells upon KSHV reactivation. (A) Principal-component analysis (PCA) of the time course RNA-seq data. (B) Hierarchical clustering of 3,123 host genes, which were more than 2-fold differentially expressed (cutoff P value, FDR <0.05) during KSHV reactivation relative to latency (0 hpi). RPKM values are shifted to 0 and scaled to a standard deviation of 1. Blue and yellow represent lower-than-average and higher-than-average gene expression changes, respectively. (C) Venn diagram representation of the 3,123 host genes (described in panel B) showing the numbers of the significantly upregulated and downregulated host genes during KSHV reactivation relative to latency. The percentage of RTA target genes within each group is also shown, which is based on the RTA ChIP-seq data at 12 hpi. Some examples of genes from the middle intersections are shown. (D) Measuring the induction of host genes by RT-qPCR to confirm the RNA-seq results at the indicated time points during lytic reactivation. Significance test was performed between reactivated and latency samples. (E) Example for a host gene upregulated only at 24 hpi. (F) RT-qPCR confirmation of GGT6 induction during KSHV reactivation. GGT6 expression was calculated relative to the expression of 18S rRNA. N.D, not detectable. (G) Examples for genes that are downregulated during lytic reactivation. *, P < 0.05.
FIG 3
FIG 3
Identification of the RTA-induced host genes during KSHV reactivation. (A) Heatmap showing the hierarchical clustering of the 163 RTA-induced host genes (core RIGs), which are RTA bound and more than 2-fold upregulated at 6 hpi and/or 12 hpi relative to latency (cutoff P value, FDR < 0.05). RPKM values are shifted to 0 and scaled to a standard deviation of 1. Blue and yellow represent lower-than-average and higher-than-average gene expression changes, respectively. Some genes are shown as examples. (B) Snapshots of the RTA ChIP-seq data showing the RTA binding at four core RIGs. The red arrows mark the RTA-binding sites that were confirmed by RTA ChIP-qPCR described in panel C. (C) RTA (using FLAG antibody) and IgG ChIP-qPCR assays were performed at 0 hpi and 12 hpi by using TRExBCBL1-3×FLAG-RTA to confirm the binding of RTA at their indicated host target sites. Three independent biological replicates were used. The IGF2/H19 host genomic locus (Neg) and the TRExBCBL1-Vector cell line were used as negative controls. (D) Gene ontology analysis of the core RIGs. Listed are the most significantly enriched biological process (top) and cellular component (bottom) terms, which are associated with the core RIGs. Some genes are listed as examples for each gene ontology term. (E) The most significantly enriched de novo motif within the 50-bp radius of the RTA-binding peak summits on the host genome (top) corresponds to the RBP-Jκ-binding motif (bottom) based on MEME/TOMTOM analysis. (F) De novo transcription factor binding motif analysis at the core RIGs identified RBP-Jκ-binding motif.
FIG 4
FIG 4
RTA-binding sites at core RIGs act as RTA-responsive enhancers. (A) Immunoblot analysis of the expression of the wild type 3×FLAG-RTA and the DNA-binding mutant 3×FLAG-RTA (RTA K152E) in transfected 293T cells. (B) 293T cells were cotransfected with the luciferase reporter plasmid and either the wild-type or the DNA-binding mutant 3×FLAG-RTA. At 48 h posttransfection, a luciferase reporter assay was performed. The enhancer activities of the DNA fragments containing the RTA-binding sites, which were derived from GMNN and EFNA1 core RIGs, were tested in both orientations (forward [fw] and reverse [rev]). RLU, relative light units.
FIG 5
FIG 5
Testing RTA-driven induction of core RIGs in various KSHV-infected and KSHV-free cell types. Immunoblot analysis of KSHV+ TRExBCBL1-3×FLAG-RTA (A) and iSLKBAC16 (B) cell lines at the indicated postinduction time points. The quantification of GMNN expression on the immunoblots is shown as fold change relative to 0 hpi. (C and D) RT-qPCR analysis of the expression of the indicated core RIGs in iSLKBAC16 cells. The induction of core RIGs were calculated as relative to the expression of 18S rRNA (C) or as the fold change relative to 0 hpi (D). ND, not detectable. (E and F) Immunoblot analysis of RTA and GMNN expression in two different KSHV-free cell lines in which the expression of the transgene RTA was induced by Dox for the indicated periods of time. The quantification of GMNN expression on the immunoblots is shown as fold change relative to 0 hpi. (G) Gene expression of the indicated core RIGs was measured by RT-qPCR in two different Dox-inducible RTA-expressing KSHV-free cell lines at the indicated hours postinduction of RTA. (H) RT-qPCR measurement of TGFB3 and EFNA1 induction relative to 0 hpi in iSLK cells. *, P < 0.05.
FIG 6
FIG 6
Effect of the shRNA depletion of RBP-Jκ on RTA-induced viral and host gene expression during KSHV reactivation. (A) Confirmation of the shRNA knockdown of RBP-Jκ by RT-qPCR. (B) Immunoblot analysis of viral gene expression in RBP-Jκ-treated reactivated iSLKBAC16 cells. The quantification of protein expression on the immunoblots is shown as fold change relative (Rel.) to shControl (shCtrl) at 0 hpi for RBP-Jκ or relative to shControl at 24 hpi in the case of viral proteins. LANA, latency-associated nuclear antigen. (C) Cell death analysis in shRNA-treated reactivated iSLKBAC16 cells (n.s., not significant). (D) RT-qPCR analysis of the RTA-mediated induction of core RIGs in the absence of RBP-Jκ (*, P < 0.05).
FIG 7
FIG 7
RBP-Jκ is required for RTA-induced expression of core RIGs in KSHV-free cells. (A) Reduced expression of RBP-Jκ in shRBP-Jκ-treated iSLK cells was confirmed by RT-qPCR. (B) Immunoblot analysis of shRBP-Jκ-treated iSLK cells for the indicated proteins. The quantification of protein expression on the immunoblots is shown as relative fold change. (C) RT-qPCR quantification of the RTA-induced expression of core RIGs in the absence of RBP-Jκ in iSLK cells (*, P < 0.05).
FIG 8
FIG 8
Effect of geminin on KSHV lytic reactivation. (A and B) Immunoblot analysis of RTA and GMNN expression in shControl- and shGMNN-treated iSLK cells and the expression of KSHV proteins in shRNA-treated iSLKBAC16 cells at 0 hpi and 48 hpi. (C) Cell death analysis in shRNA-treated reactivated iSLKBAC16 cells at 24 hpi. (D) RT-qPCR analysis of viral gene expression in shControl- and shGMNN #1-treated iSLKBAC16 cells. (E) The copy number of KSHV genome in the shGMNN #1- and shControl-treated iSLKBAC16 cells was determined at the indicated time points of KSHV reactivation relative to 0 hpi. (F) Immunoblot analysis of the expression of viral proteins in shControl- and shGMNN-treated TRExBCBL1-3×FLAG-RTA cells at 0 hpi (latency), 12 hpi, 24 hpi, and 48 hpi. The quantification of protein expression on the immunoblots is shown as relative fold change. (G) Testing the expression of viral genes by RT-qPCR in shGMNN-treated TRExBCBL1-3×FLAG-RTA cells compared to shControl-treated cells at 0 hpi and 24 hpi. (H) The relative KSHV DNA load in shControl- and shGMNN-treated TRExBCBL1-3×FLAG-RTA cells at different time points of KSHV reactivation compared to 0 hpi (latency). (I) The same amount of supernatants from shControl and shGMNN samples at 72 hpi described in panel H was used to infect 293T cells, and the viral DNA level was measured in the infected cells by qPCR at 24 hpi. n.s., nonsignificant; *, P < 0.05.
FIG 9
FIG 9
Identification of GGT6 as a pivotal host factor for KSHV lytic reactivation. (A) RT-qPCR measurement of GGT6 expression in shGGT6-treated iSLK cells. (B) RTA expression in shGGT6-treated uninduced and Dox-treated iSLK cells. The quantification of protein expression on the immunoblots is shown as relative fold change. (C) RT-qPCR analysis of latent and reactivated iSLKBAC16 cells treated with different GGT6-specific shRNAs. N.D, not detectable. (D) Cell death analysis of shGGT6-treated reactivated iSLKBAC16 cells at 24 hpi (n.s., not significant). (E) RT-qPCR measurement of the expression of viral genes in the samples described in panel C. (F) Immunoblot analysis of viral protein expression in samples described in panel C. (G and H) iSLKBAC16 cells were treated with shControl or shGGT6 #1 for 48 h, followed by Dox/NaB induction for 72 h, and then viral DNA in the reactivated cells (G) and the virion DNA purified from the supernatant (H) were measured by qPCR. (I) Equal amounts of supernatant from shControl and shGGT6 #1 samples described in panel H were used to infect 293T cells. The KSHV DNA level was measured by qPCR in the infected 293T cells at 24 hpi. Representative immunofluorescence images show 293T cells infected with supernatant derived from shControl- or shGGT6 #1-treated reactivated iSLKBAC16 cells. Green fluorescent protein (GFP) is constitutively expressed from BAC16, which is used for the detection of infected cells. (J) RT-qPCR evaluation of GGT6 expression in shGGT6 #1-treated TRExBCBL1-3×FLAG-RTA cells at 0 hpi (latency) and at 24 hpi (lytic reactivation). (K) TRExBCBL1-3×FLAG-RTA cells were treated with shGGT6 for 2 days followed by Dox induction of 3×FLAG-RTA to trigger lytic viral reactivation for 12 and 24 h. Immunoblot analysis was performed for viral and host proteins indicated on the left. The quantification of protein expression on the immunoblots is shown as relative fold change. N.D, not detectable; *, P < 0.05.

Similar articles

Cited by

References

    1. Jha HC, Banerjee S, Robertson ES. 2016. The role of gammaherpesviruses in cancer pathogenesis. Pathogens 5:E18. - PMC - PubMed
    1. Cesarman E. 2011. Gammaherpesvirus and lymphoproliferative disorders in immunocompromised patients. Cancer Lett 305:163–174. doi:10.1016/j.canlet.2011.03.003. - DOI - PMC - PubMed
    1. Mesri EA, Cesarman E, Boshoff C. 2010. Kaposi’s sarcoma and its associated herpesvirus. Nat Rev Cancer 10:707–719. doi:10.1038/nrc2888. - DOI - PMC - PubMed
    1. Purushothaman P, Uppal T, Verma SC. 2015. Molecular biology of KSHV lytic reactivation. Viruses 7:116–153. doi:10.3390/v7010116. - DOI - PMC - PubMed
    1. Sun R, Lin SF, Staskus K, Gradoville L, Grogan E, Haase A, Miller G. 1999. Kinetics of Kaposi’s sarcoma-associated herpesvirus gene expression. J Virol 73:2232–2242. - PMC - PubMed

Publication types

MeSH terms

Substances