. 2019 Feb 19;93(5):e01728-18.
doi: 10.1128/JVI.01728-18. Print 2019 Mar 1.

HIV Infection Functionally Impairs Mycobacterium tuberculosis-Specific CD4 and CD8 T-Cell Responses

Affiliations

HIV Infection Functionally Impairs Mycobacterium tuberculosis-Specific CD4 and CD8 T-Cell Responses

Patrizia Amelio et al. J Virol. .

Abstract

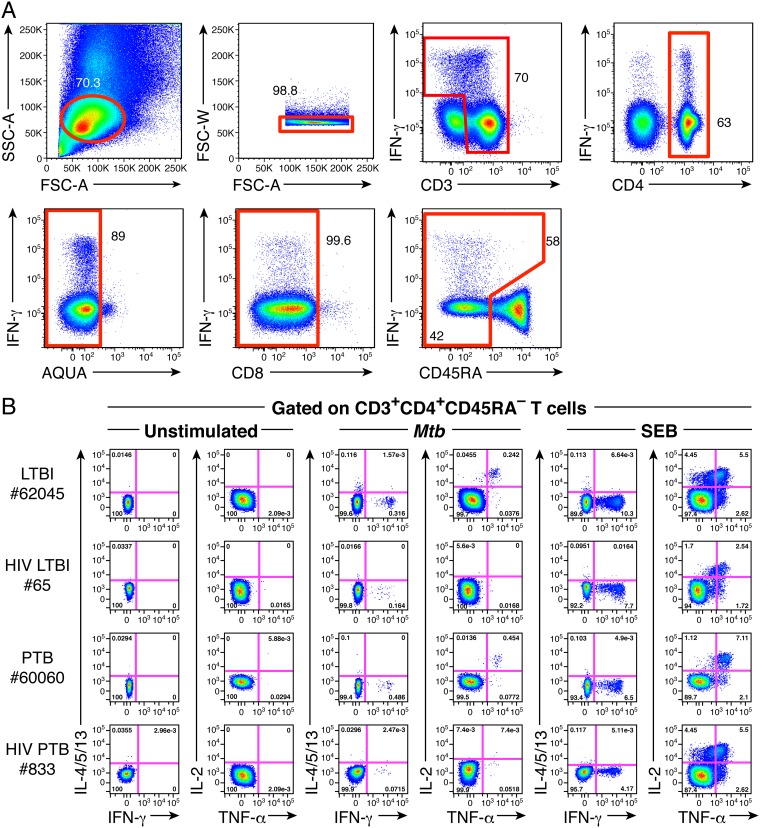
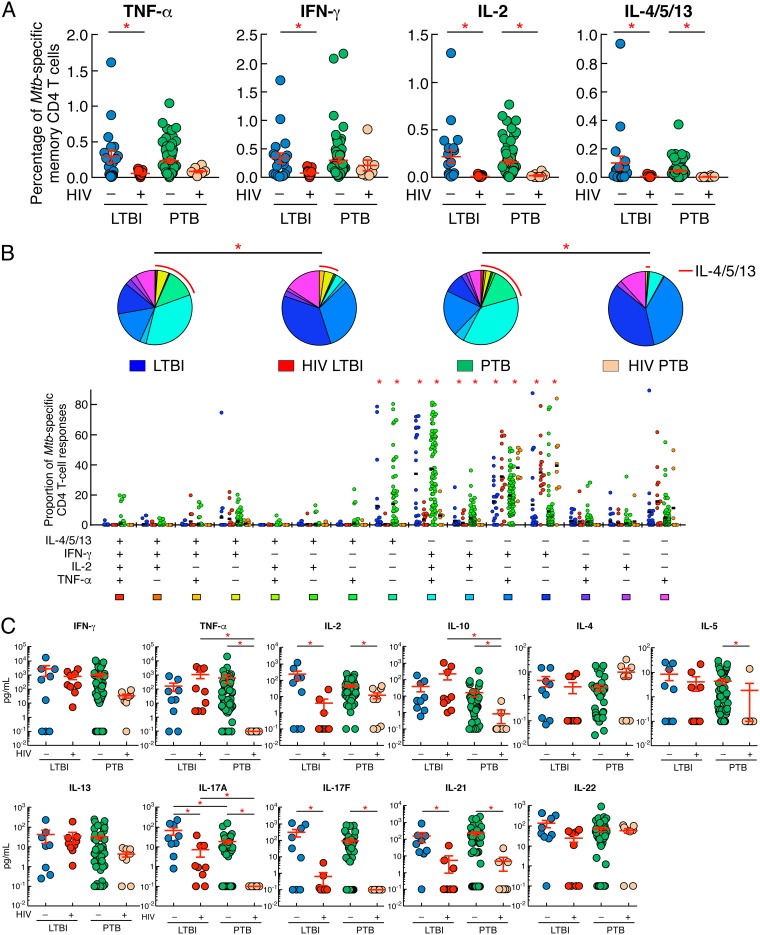
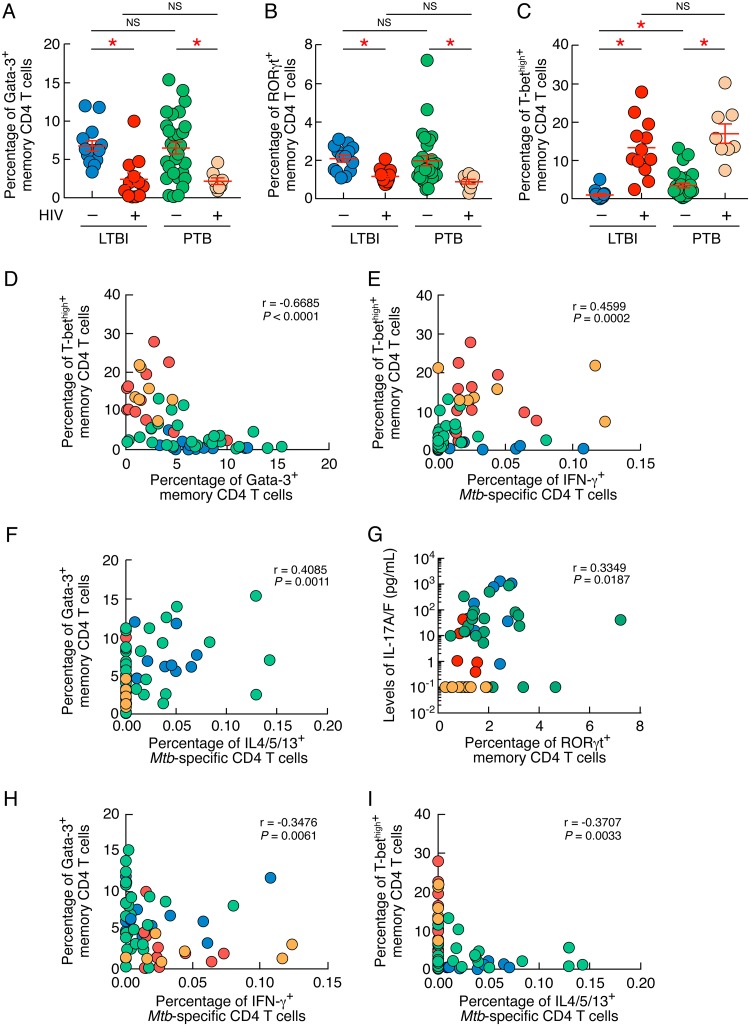
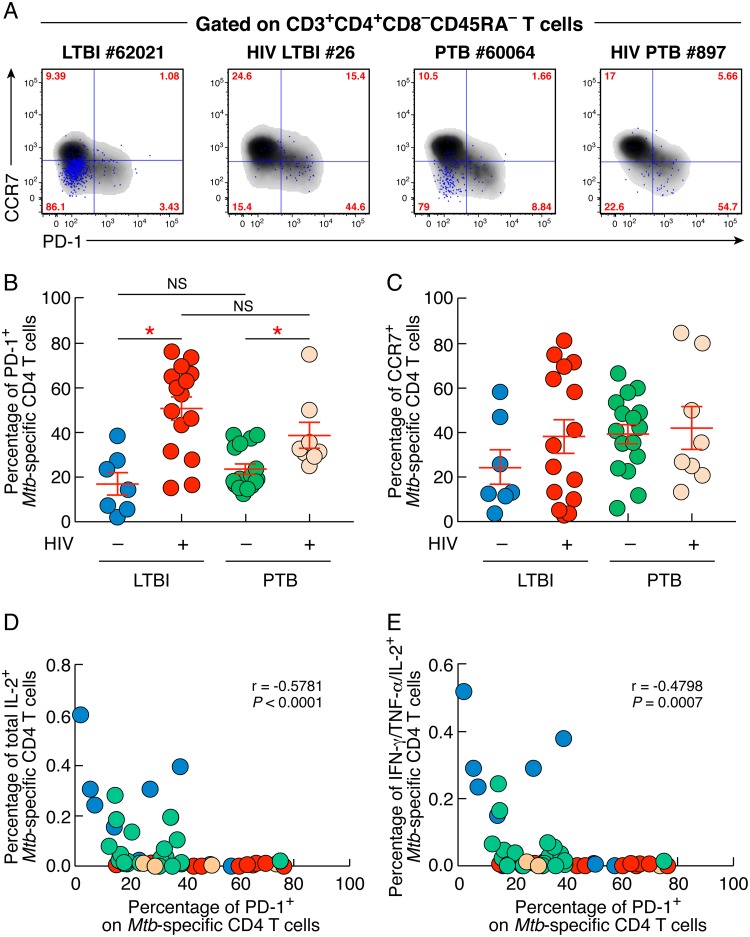
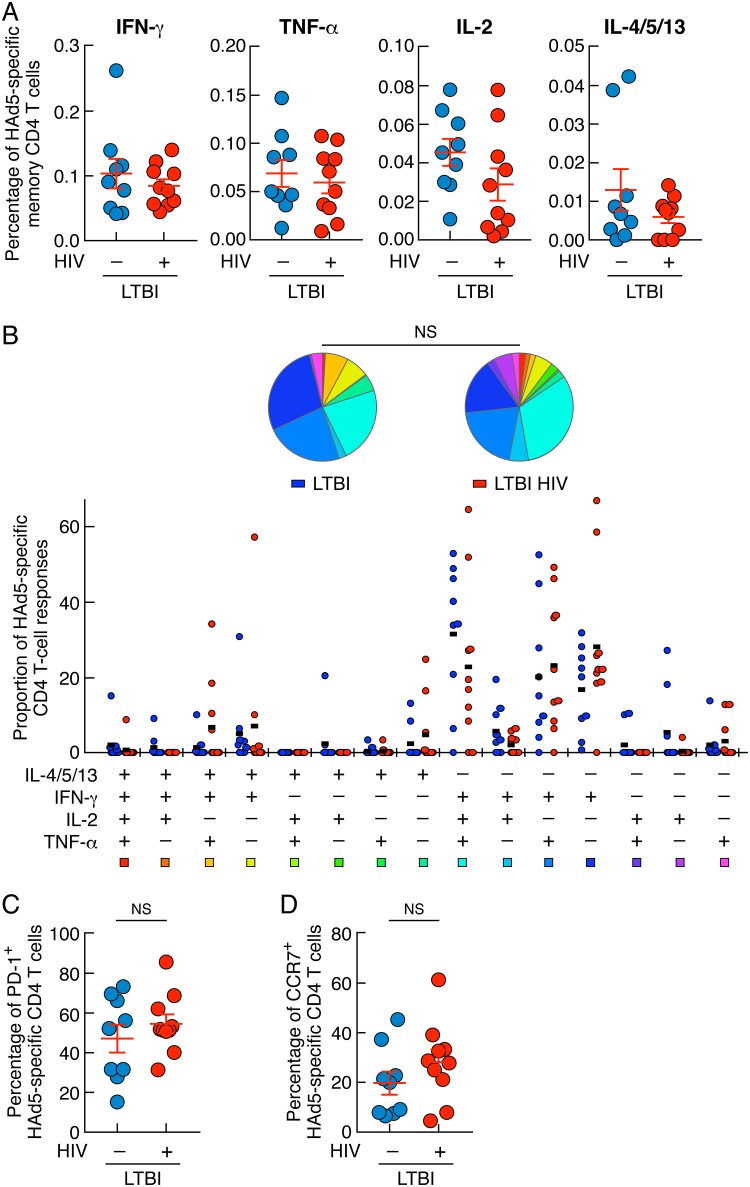
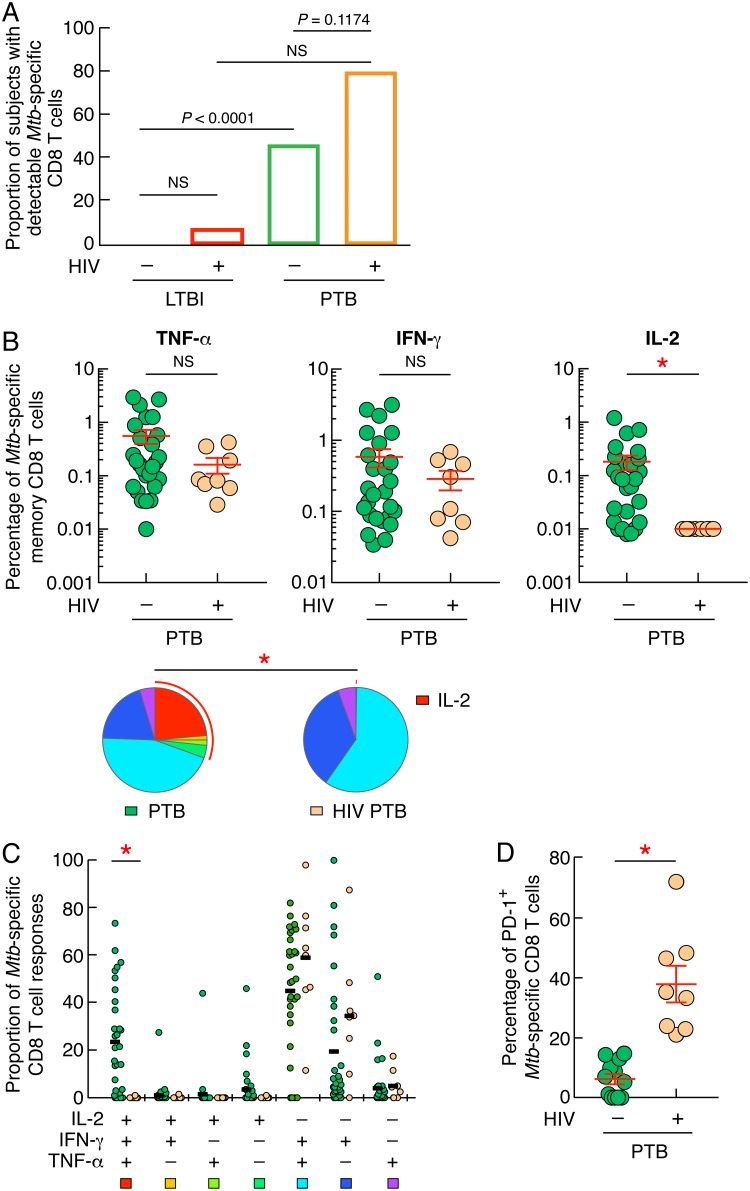
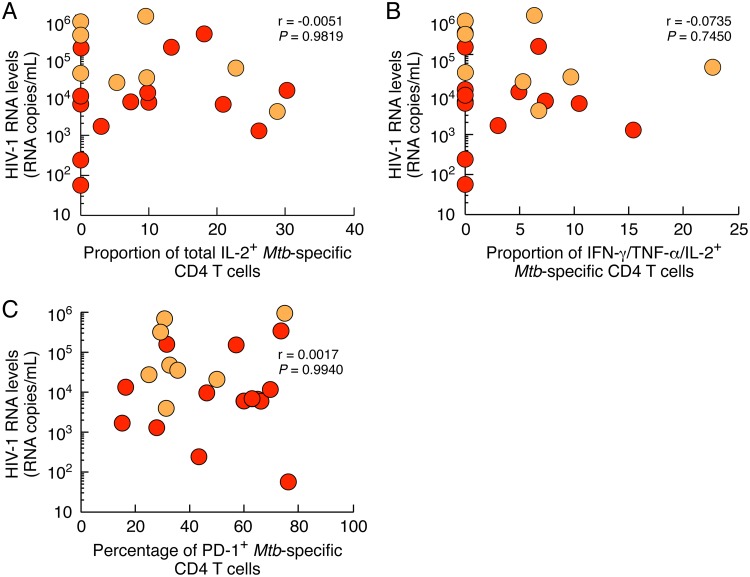
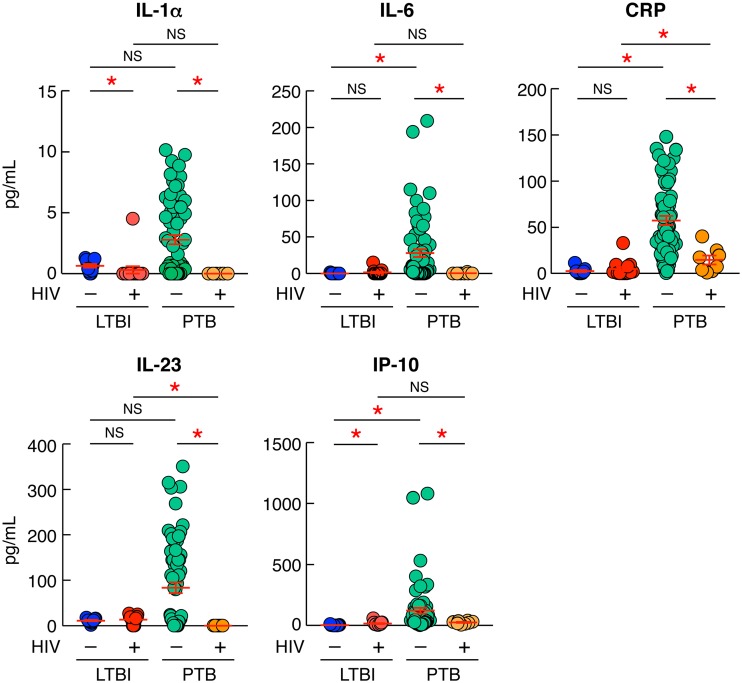
Human immunodeficiency virus (HIV) infection is the major risk factor predisposing for Mycobacterium tuberculosis progression from latent tuberculosis infection (LTBI) to tuberculosis disease (TB). Since long-term-treated aviremic HIV-infected individuals remained at higher risk of developing TB than HIV-uninfected individuals, we hypothesized that progression from LTBI to pulmonary TB (PTB) might be due not only to CD4 T-cell depletion but also to M. tuberculosis-specific CD4 T-cell functional impairment. To test this hypothesis, M. tuberculosis-specific T-cell frequencies and cytokine profiles were investigated in untreated Tanzanian individuals suffering from LTBI (n = 20) or PTB (n = 67) and compared to those of untreated M. tuberculosis/HIV-coinfected individuals suffering from LTBI (n = 15) or PTB (n = 10). We showed that HIV infection significantly reduced the proportion of Th2 (interleukin 4 [IL-4]/IL-5/IL-13) producing M. tuberculosis-specific CD4 T cells and IL-2-producing M. tuberculosis-specific CD4 and CD8 T cells in individuals with LTBI or PTB (P < 0.05). Interestingly, the loss of IL-2 production was associated with a significant increase of PD-1 expression on M. tuberculosis-specific CD4 and CD8 T cells (P < 0.05), while the loss of Th2 cytokine production was associated with a significant reduction of Gata-3 expression in memory CD4 T cells (P < 0.05). Finally, we showed that the serum levels of IL-1α, IL-6, C-reactive protein (CRP), IL-23, and IP-10 were significantly reduced in M. tuberculosis/HIV-coinfected individuals with PTB compared to those in HIV-negative individuals with PTB (P < 0.05), suggesting that HIV infection significantly suppresses M. tuberculosis-induced systemic proinflammatory cytokine responses. Taken together, this study suggests that in addition to depleting M. tuberculosis-specific CD4 T cells, HIV infection significantly impairs functionally favorable M. tuberculosis-specific CD4 T-cell responses in Tanzanian individuals with LTBI or PTB.IMPORTANCEMycobacterium tuberculosis and human immunodeficiency virus (HIV) infections are coendemic in several regions of the world, and M. tuberculosis/HIV-coinfected individuals are more susceptible to progression to tuberculosis disease. We therefore hypothesized that HIV infection would potentially impair M. tuberculosis-specific protective immunity in individuals suffering from latent tuberculosis infection (LTBI) or active pulmonary tuberculosis (PTB). In this study, we demonstrated that M. tuberculosis/HIV-coinfected individuals have fewer circulating M. tuberculosis-specific CD4 T cells and that those that remained were functionally impaired in both LTBI and PTB settings. In addition, we showed that HIV infection significantly interferes with M. tuberculosis-induced systemic proinflammatory cytokine/chemokine responses. Taken together, these data suggest that HIV infection impairs functionally favorable M. tuberculosis-specific immunity.

Keywords: CD4 T cells; HIV; Mycobacterium tuberculosis; exhaustion.


Figures

FIG 1
FIG 1
Assessment of M. tuberculosis-specific CD4 T-cell responses. (A) Gating strategy used to assess cytokine-producing CD4 T cells. (B) Representative flow cytometry profile of M. tuberculosis-specific CD4 T cells producing IFN-γ, IL-4/5/13, TNF-α, and/or IL-2 of individuals with LTBI (62045), HIV/LTBI (65), PTB (60060), or HIV/PTB (833). Cytokine profiles of CD4 T cells stimulated with SEB (positive control) or left unstimulated (negative control) are also shown.
FIG 2
FIG 2
HIV infection influences M. tuberculosis-specific CD4 T-cell frequencies and cytokine profiles. (A) Percentage of M. tuberculosis-specific CD4 T cells producing TNF-α, IFN-γ, IL-2, or IL-4/5/13 of individuals with LTBI (n = 20), HIV/LTBI (n = 15), PTB (n = 67), or HIV/PTB (n = 8). (B) Proportion of M. tuberculosis-specific CD4 T-cell populations producing IFN-γ, IL-4/5/13, TNF-α, and/or IL-2 of individuals with LTBI (n = 20), HIV/LTBI (n = 15), PTB (n = 67), or HIV/PTB (n = 8). All the possible combinations of the responses are shown on the x axis, and the percentages of the functionally distinct cell populations within the M. tuberculosis-specific CD4 T-cell populations are shown on the y axis. Responses are grouped and color-coded on the basis of the number of functions. The pie chart summarizes the data, and each slice corresponds to the fraction of M. tuberculosis-specific CD4 T cell response with a given number of functions within the responding CD4 T-cell population. Bars correspond to the fractions of different functionally distinct CD4 T-cell populations within the total CD4 T cells. The red arc corresponds to IL-4/5/13-producing CD4 T-cell populations. (C) Levels of IFN-γ, TNF-α, IL-2, IL-4, IL-5, IL-13, IL-10, IL-17A, IL-17F, IL-21, and IL-22 produced in M. tuberculosis-stimulated culture supernatants of individuals with LTBI (n = 9), HIV/LTBI (n = 9), PTB (n = 50), or HIV/PTB (n = 8) assessed by multiplex bead array analyses (Luminex). Undetectable values were arbitrarily defined as 0.1 pg/ml. Individuals were color coded (A to C); Individuals with LTBI, blue; individuals with HIV/LTBI, red; individuals with PTB, green and individuals with HIV/PTB, orange. Red asterisks indicate statistical significance. Statistical significance (P < 0.05) was calculated using one-way ANOVA (Kruskal-Wallis test) followed by a Mann-Whitney test (A and C). Statistical analyses of the global cytokine profiles (pie charts) (B) were performed by partial permutation tests using the SPICE software as described previously (54).
FIG 3
FIG 3
HIV infection significantly influences Gata-3, T-bet, and RORγt expression. (A to C) Percentages of memory (CD45RA) CD4 T cells isolated from individuals with LTBI (n = 14), HIV/LTBI (n = 12), PTB (n = 29), or HIV/PTB (n = 8) expressing Gata-3 (A), RORγt (B), or T-bethigh (C). (D) Correlation between the percentage of memory CD4 T cells expressing T-bethigh and the percentage of memory CD4 T cells expressing Gata-3 in individuals with LTBI (n = 14), HIV/LTBI (n = 12), PTB (n = 26), or HIV/PTB (n = 8). (E) Correlation between the percentage of IFN-γ-producing M. tuberculosis-specific CD4 T cells and the percentage of memory CD4 T cells expressing T-bethigh of individuals with LTBI (n = 14), HIV/LTBI (n = 12), PTB (n = 29), or HIV/PTB (n = 8). (F) Correlation between the percentage of IL-4/5/13-producing M. tuberculosis-specific CD4 T cells and the percentage of memory CD4 T cells expressing Gata-3 of TB patients from individuals with LTBI (n = 14), HIV/LTBI (n = 12), PTB (n = 29), or HIV/PTB (n = 8). (G) Correlation between the levels of IL-17A/F detected in M. tuberculosis-stimulated culture supernatants and the percentage of memory CD4 T cells expressing RORγt individuals of individuals with LTBI (n = 9), HIV/LTBI (n = 6), PTB (n = 26), or HIV/PTB (n = 8). (H) Correlation between the percentage of memory CD4 T cells expressing Gata-3 and the percentage of M. tuberculosis-specific CD4 T cells producing IFN-γ in individuals with LTBI (n = 14), HIV/LTBI (n = 12), PTB (n = 26), or HIV/PTB (n = 8). (I) Correlation between the percentage of T-bethigh and the percentage of M. tuberculosis-specific CD4 T cells producing IL-4/5/13 in individuals with LTBI (n = 14), HIV/LTBI (n = 12), PTB (n = 26), or HIV/PTB (n = 8). Statistical significance (*; P < 0.05) was calculated using one way Anova (Kruskal-Wallis test) followed by a Mann-Whitney test (A to C) or Spearman rank test for correlations (D to I). NS, not significant.
FIG 4
FIG 4
HIV infection influences PD-1 expression on M. tuberculosis-specific CD4 T cells. (A) Representative flow cytometry profile of M. tuberculosis-specific memory (CD45RA) CD4 T cells (blue dots) isolated from one individual with LTBI (62021), HIV/LTBI (26), PTB (60064), or HIV/PTB (897) expressing PD-1 and/or CCR7. (B and C) Percentages of M. tuberculosis-specific CD4 T cells isolated from individuals with LTBI (n = 7), HIV/LTBI (n = 15), PTB (n = 16), or HIV/PTB (n = 8) expressing PD-1 (B) and/or CCR7 (C). (D and E) Correlation between the percentage of M. tuberculosis-specific CD4 T cells expressing PD-1 and the percentage of total IL-2-producing M. tuberculosis-specific memory CD4 T cells (D) or the percentage of IFN-γ/IL-2/TNF-α-producing M. tuberculosis-specific memory CD4 T cells of individuals with LTBI (n = 7), HIV/LTBI (n = 15), PTB (n = 16) or HIV/PTB (n = 8) (E). Statistical significance (*; P < 0.05) was calculated using one-way ANOVA (Kruskal-Wallis test) followed by the Mann-Whitney test (B and C) or Spearman rank test for correlation (D and E).
FIG 5
FIG 5
HIV infection did not influence HAd5-specific CD4 T-cell frequencies, cytokine profiles, or PD-1 expression. (A) Percentages of HAd5-specific CD4 T cells producing IFN-γ, TNF-α, IL-2, or IL-4/5/13 of individuals with LTBI (n = 9) or HIV/LTBI (n = 10). (B) Proportion of HAd5-specific CD4 T-cell populations producing IFN-γ, IL-4/5/13, TNF-α, and/or IL-2 of individuals with LTBI (n = 9) or HIV/LTBI (n = 10). All the possible combinations of the responses are shown on the x axis, and the percentages of the functionally distinct cell populations within the HAd5-specific CD4 T-cell populations are shown on the y axis. Responses are grouped and color-coded on the basis of the number of functions. The pie chart summarizes the data, and each slice corresponds to the fraction of HAd5-specific CD4 T cell response with a given number of functions within the responding CD4 T-cell population. Bars correspond to the fractions of different functionally distinct CD4 T-cell populations within the total CD4 T cells. (C and D) Percentages of HAd5-specific CD4 T cells isolated from individuals with LTBI (n = 9) or HIV/LTBI (n = 10) expressing PD-1 (C) and/or CCR7 (D). Statistical significance (*; P < 0.05) was calculated using the Mann-Whitney test (A, C, and D). Statistical analyses of the global cytokine profiles (pie charts [B]) were performed by partial permutation tests using the SPICE software as described previously (54).
FIG 6
FIG 6
HIV infection influences IL-2 production from M. tuberculosis-specific CD8 T-cell responses. (A) Proportions of subjects with detectable M. tuberculosis-specific CD8 T cells. (B) Percentages of M. tuberculosis-specific CD8 T cells producing TNF-α, IFN-γ, and/or IL-2 of individuals with PTB (n = 31) or HIV/PTB (n = 8). Undetectable values were arbitrarily defined as 0.01%. (C) Cytokine profile of M. tuberculosis-specific CD8 T cells of individuals with PTB (n = 31) or HIV/PTB (n = 8). The red arc identifies IL-2-producing cell populations (C). (D) Percentage of M. tuberculosis-specific CD8 T cells expressing PD-1 of individuals with PTB (n = 12) or HIV/PTB (n = 8). Statistical significance (*; P < 0.05) was calculated using chi-square test (A) and Mann-Whitney test (B and D). Statistical analyses of the global cytokine profiles (pie charts [B] and panel C) were performed by partial permutation tests using the SPICE software as described previously (54).
FIG 7
FIG 7
Influence of HIV replication on M. tuberculosis-specific CD4 T-cell cytokine profile and phenotype. Correlation between the levels HIV-1 RNA and the proportion of total IL-2-producing M. tuberculosis-specific memory CD4 T cells (A) or the proportion of IFN-γ/IL-2/TNF-α-producing M. tuberculosis-specific memory CD4 T cells (B) or the percentage of M. tuberculosis-specific CD4 T cells expressing PD-1 (C) of individuals HIV/LTBI (n = 15) or HIV/PTB (n = 8). Statistical significance (*; P < 0.05) was calculated using the Spearman rank test for correlation.
FIG 8
FIG 8
HIV infection dampens the level of systemic inflammation markers in PTB/HIV-coinfected individuals. Shown are serum levels of IL-1α, IL-6, CRP, IL-23, and IP-10 of individuals with LTBI (n = 11), HIV/LTBI (n = 15), PTB (n = 67), or HIV/PTB (n = 8). Statistical significance (*; P < 0.05) was calculated using the Mann-Whitney test.

Similar articles

Cited by

References

    1. Bell LCK, Noursadeghi M. 2017. Pathogenesis of HIV-1 and Mycobacterium tuberculosis co-infection. Nat Rev Microbiol 16:80–90. doi:10.1038/nrmicro.2017.128. - DOI - PubMed
    1. Selwyn PA, Hartel D, Lewis VA, Schoenbaum EE, Vermund SH, Klein RS, Walker AT, Friedland GH. 1989. A prospective study of the risk of tuberculosis among intravenous drug users with human immunodeficiency virus infection. N Engl J Med 320:545–550. doi:10.1056/NEJM198903023200901. - DOI - PubMed
    1. Corbett EL, Watt CJ, Walker N, Maher D, Williams BG, Raviglione MC, Dye C. 2003. The growing burden of tuberculosis: global trends and interactions with the HIV epidemic. Arch Intern Med 163:1009–1021. doi:10.1001/archinte.163.9.1009. - DOI - PubMed
    1. Sonnenberg P, Glynn JR, Fielding K, Murray J, Godfrey-Faussett P, Shearer S. 2005. How soon after infection with HIV does the risk of tuberculosis start to increase? A retrospective cohort study in South African gold miners. J Infect Dis 191:150–158. doi:10.1086/426827. - DOI - PubMed
    1. Getahun H, Gunneberg C, Granich R, Nunn P. 2010. HIV infection-associated tuberculosis: the epidemiology and the response. Clin Infect Dis 50:S201–S207. doi:10.1086/651492. - DOI - PubMed

Publication types

MeSH terms