. 2019 Feb 19;93(5):e01621-18.
doi: 10.1128/JVI.01621-18. Print 2019 Mar 1.

Splicing-Dependent Subcellular Targeting of Borna Disease Virus Nucleoprotein Isoforms

Affiliations

Splicing-Dependent Subcellular Targeting of Borna Disease Virus Nucleoprotein Isoforms

Shohei Kojima et al. J Virol. .

Abstract

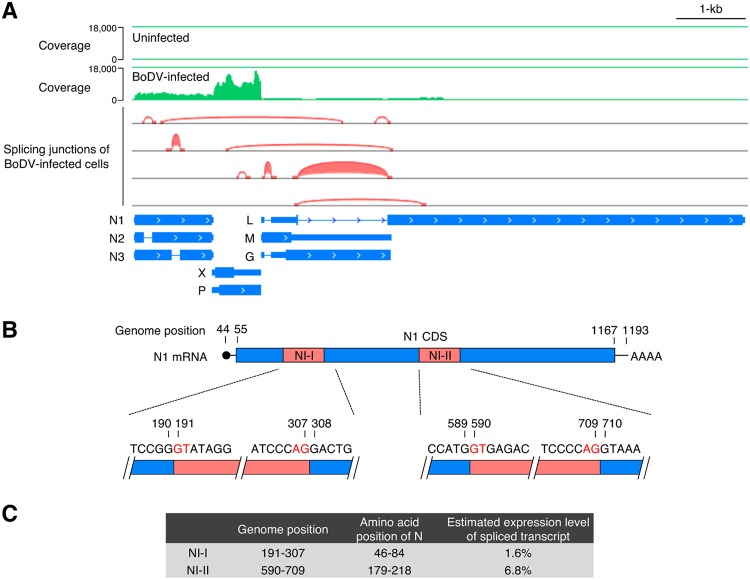
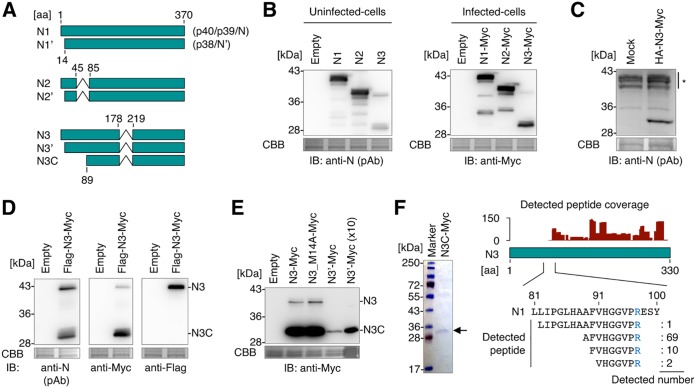
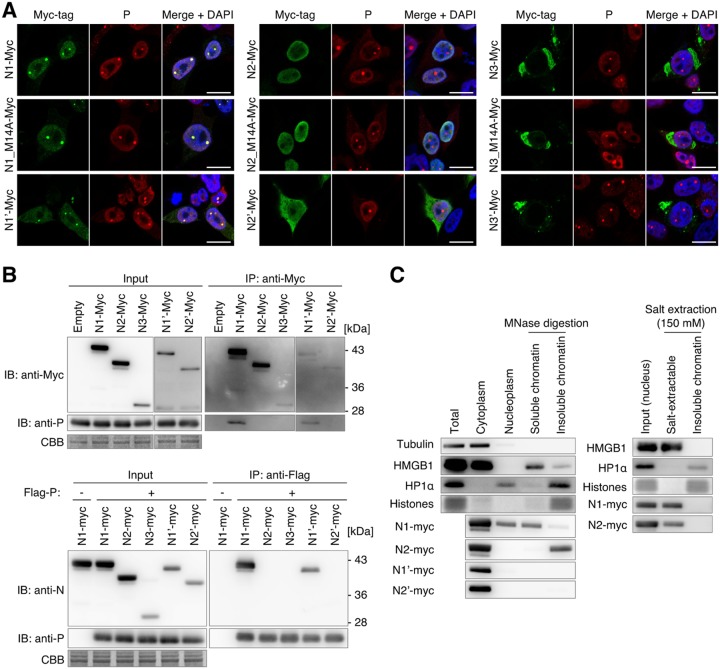
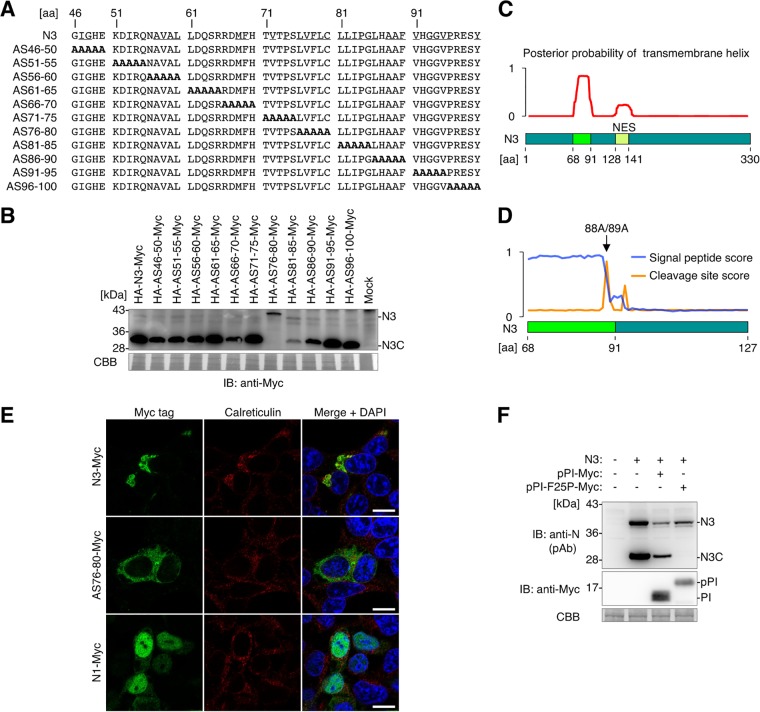
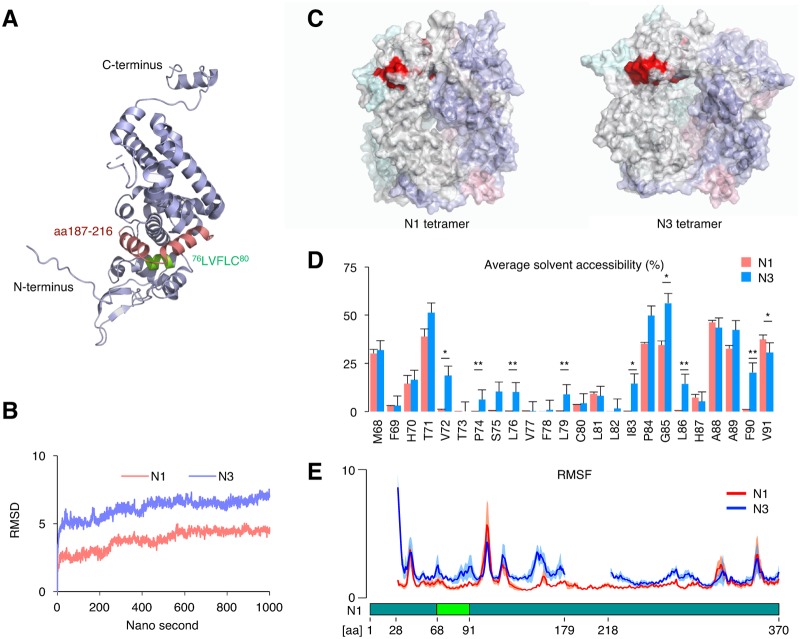
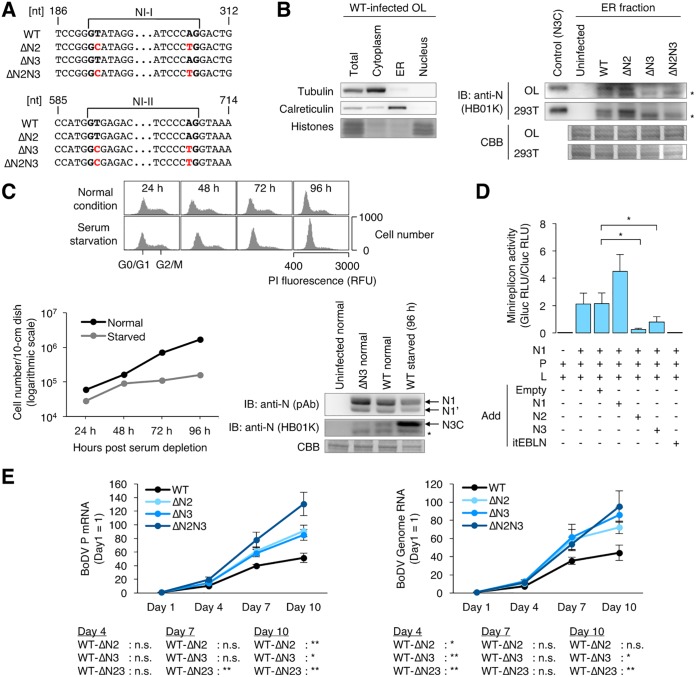
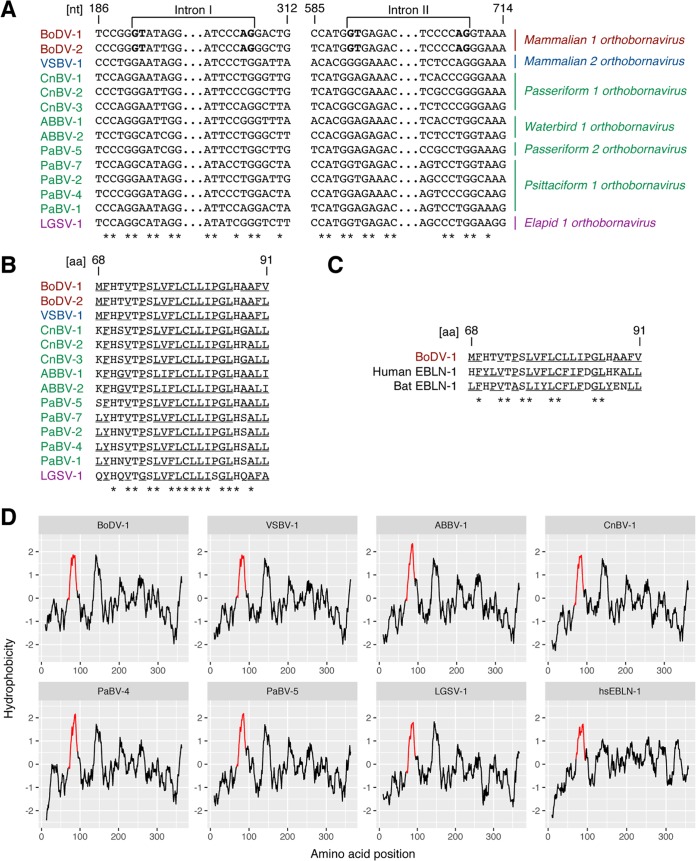
Targeting of viral proteins to specific subcellular compartments is a fundamental step for viruses to achieve successful replication in infected cells. Borna disease virus 1 (BoDV-1), a nonsegmented, negative-strand RNA virus, uniquely replicates and persists in the cell nucleus. Here, it is demonstrated that BoDV nucleoprotein (N) transcripts undergo mRNA splicing to generate truncated isoforms. In combination with alternative usage of translation initiation sites, the N gene potentially expresses at least six different isoforms, which exhibit diverse intracellular localizations, including the nucleoplasm, cytoplasm, and endoplasmic reticulum (ER), as well as intranuclear viral replication sites. Interestingly, the ER-targeting signal peptide in N is exposed by removing the intron by mRNA splicing. Furthermore, the spliced isoforms inhibit viral polymerase activity. Consistently, recombinant BoDVs lacking the N-splicing signals acquire the ability to replicate faster than wild-type virus in cultured cells, suggesting that N isoforms created by mRNA splicing negatively regulate BoDV replication. These results provided not only the mechanism of how mRNA splicing generates viral proteins that have distinct functions but also a novel strategy for replication control of RNA viruses using isoforms with different subcellular localizations.IMPORTANCE Borna disease virus (BoDV) is a highly neurotropic RNA virus that belongs to the orthobornavirus genus. A zoonotic orthobornavirus that is genetically related to BoDV has recently been identified in squirrels, thus increasing the importance of understanding the replication and pathogenesis of orthobornaviruses. BoDV replicates in the nucleus and uses alternative mRNA splicing to express viral proteins. However, it is unknown whether the virus uses splicing to create protein isoforms with different functions. The present study demonstrated that the nucleoprotein transcript undergoes splicing and produces four new isoforms in coordination with alternative usage of translation initiation codons. The spliced isoforms showed a distinct intracellular localization, including in the endoplasmic reticulum, and recombinant viruses lacking the splicing signals replicated more efficiently than the wild type. The results provided not only a new regulation of BoDV replication but also insights into how RNA viruses produce protein isoforms from small genomes.

Keywords: Mononegavirales; RNA splicing; bornavirus.


Figures

FIG 1
FIG 1
Alternative splicing generates transcript variants of N. (A) IGV browser view showing the coverage and splicing junctions of mapped RNA reads from persistently BoDV-infected OL cells. (B) Map of the splicing donor and acceptor sequences of NI-I and NI-II. (C) Genome positions and amino acid positions corresponding to the N introns and estimated expression levels of spliced N transcripts. Expression levels of spliced N transcripts were estimated from the RNA-seq data of BoDV-infected OL cells using MISO (Mixture of Isoforms) software that quantitates the expression levels of alternatively spliced genes from RNA-seq data.
FIG 2
FIG 2
N isoforms expressed from splicing variants of N transcript. (A) Schematic representation of N isoforms. The amino acid positions corresponding to N1 are shown. Synonymous names are shown in parentheses. (B) Detection of N isoforms by Western blotting. Whole-cell lysates of uninfected and persistently BoDV-infected 293T cells transfected with plasmids encoding the indicated N isoforms were used. (C) Detection of N isoforms by Western blotting. Whole-cell lysates of uninfected 293T cells transfected with the mRNA encoding the indicated N isoforms were used. The asterisk represents nonspecific signals. (D) Detection of the N3 short form by Western blotting. The whole-cell lysate of uninfected 293T cells expressing Flag-N3-Myc was used. (E) Detection of N3C-Myc by Western blotting. Whole-cell lysates of uninfected 293T cells expressing the indicated N3 mutants were used. In the ×10 sample, a 10-fold amount of the cell lysate was used for analysis. Coomassie brilliant blue (CBB) staining was used as a loading control. IB, immunoblotting; pAb, polyclonal antibody. (F) Detection of the N terminus of N3C. (Left) Purified N3C-Myc. N3C-Myc was purified from uninfected 293T cells expressing N3C-Myc using an anti-Myc tag antibody. Purified protein was stained with CBB. (Right) Coverage of N3C peptides and the N-terminal fragments of N3C detected by mass spectrometry. The arginine residue of which the peptide bond of the carboxy side is cleaved by trypsin during sample preparation is shown in blue.
FIG 3
FIG 3
Subcellular localization and P- and chromatin-binding abilities of N isoforms. (A) Localization of splicing isoforms with a C-terminal Myc tag. Persistently BoDV-infected 293T cells were transfected with plasmids encoding the indicated constructs, and each N protein was detected using an anti-Myc tag antibody. vSPOTs were stained by an anti-P antibody, and the nucleus was counterstained with DAPI. Bars, 10 μm. (B) Immunoprecipitation analysis of N isoforms. (Top) Immunoprecipitation (IP) of N isoforms and coimmunoprecipitation (co-IP) of P. (Bottom) IP of P and co-IP of N isoforms. Uninfected 293T cells were transfected with plasmids encoding the indicated N and P constructs. IP and co-IP of N isoforms and P were detected by Western blotting. CBB staining was used as a loading control. (C) Chromatin-binding assay of N isoforms. Uninfected 293T cells were transfected with plasmids encoding the indicated N isoforms. (Left) Transfected cells were fractionated into cytoplasm, nucleoplasm, and soluble and insoluble chromatin fractions using micrococcal nuclease (MNase) digestion. (Right) Nuclei of transfected cells were fractionated into salt-extractable and insoluble fractions with 150 mM NaCl. Tubulin, HMGB1, HP1α, and N isoforms were detected by Western blotting. CBB staining was used for detection of histones. For detection of tubulin, HMGB1, HP1α, and histones, lysates of N1-Myc-transfected cells were used.
FIG 4
FIG 4
N3 translocates to the ER and is cleaved into a C-terminal fragment. (A) Protein sequences of N3 mutants used for alanine-scanning mutagenesis analysis. Underlined characters in the N3 sequence represent amino acids with hydrophobic residues. (B) Detection of alanine-scanning N3 mutants by Western blotting. Whole-cell lysates of uninfected 293T cells expressing each mutant were used. (C) Detection of transmembrane helix potential by TMHMM software, which predicts transmembrane helices in proteins. Full-length N3 (aa 1 to 330) was used for analysis. (D) Detection of signal peptide potential by SignalP, which predicts the presence and location of the signal peptide cleavage site in proteins. A partial N3 sequence (aa 68 to 127) was used for analysis. (E) Cellular localization of N3-Myc, AS76-80–Myc, and N1-Myc in uninfected 293T cells. Each N protein was detected by an anti-Myc tag antibody. The ER was stained by an anticalreticulin antibody, and the nucleus was counterstained with DAPI. Bars, 10 μm. (F) N3 is cleaved into N3C by the host SPase. N3C expression was detected by Western blotting. Whole-cell lysates of uninfected 293T cells expressing the indicated constructs were used. pPI-Myc, preproinsulin with a C-terminal Myc tag; pPI-F25P-Myc, pPI-Myc with a single-amino-acid substitution, which functions as an SPase inhibitor. In panels B and F, CBB staining was used as a loading control.
FIG 5
FIG 5
The ER-targeting signal peptide is partially exposed to the protein surface in the predicted N3 structure. (A) Crystal structure of N1 (PDB accession number 1N93). Green and red regions represent 76LVFVC80 and aa 187 to 216, respectively. (B) Root mean square deviation (RMSD) of the N1 tetramer and N3 tetramer. (C) Predicted structures of the N1 tetramer and N3 tetramer. The red region represents 76LVFVC80. (D) Average solvent accessibility of each residue from aa 68 to 91 in N1 and N3. The data are presented as the means and standard errors of the means (SEM) of data from four independent simulations. Student’s t test was used for statistical analysis. *, P < 0.05; **, P < 0.01. (E) Root mean square fluctuation (RMSF) of each residue in N1 and N3. The data are presented as the means ± 95% confidential intervals (CIs) of data from four independent simulations. Solid lines show means, and shaded regions represent CIs.
FIG 6
FIG 6
Splicing of N isoforms negatively regulates BoDV infection. (A) Partial sequences of rBoDVs. Silent mutations that disrupt splicing signals in the N gene are shown in red. (B) Expression of N3C in BoDV-infected cells. Uninfected or persistently rBoDV-infected OL and 293T cells were fractionated into cytoplasm, ER, and nucleus fractions. The ER fraction was used for detection of N3C. The whole-cell lysate of uninfected 293T cells transfected with an N3-expressing plasmid was used for the positive control. N3C, tubulin, and calreticulin were detected by Western blotting. CBB staining was used as a loading control and for detection of histones. Asterisks represent an unidentified N product. (C) Expression levels of N isoforms during serum starvation. Persistently BoDV-infected OL cells were cultured in serum-free medium. (Top and bottom left) Distribution of cell cycles and cell numbers after serum starvation, respectively. For cell cycle detection, the cells were stained by propidium iodide (PI). (Bottom right) Expression levels of the N isoforms. N1, N1′, and N3C were detected by Western blotting. The whole-cell lysate was used for N1 and N1′, and the ER fraction was used for N3C detection. CBB staining was used as a loading control. Normal and starved represent cells cultured in serum-containing and serum-free media, respectively. The asterisk represents an unidentified N product. RFU, relative fluorescence units. (D) Expression of N2 and N3 inhibits BoDV polymerase activity in the minireplicon assay. Uninfected 293T cells were transfected with plasmids encoding the indicated proteins, and luciferase activity was measured at 48 h posttransfection. Gluc (Gaussia luciferase) activity, which was derived from the BoDV minireplicon, was normalized to Cluc (Cypridina luciferase) activity, which was derived from a transfection control plasmid. The data are presented as the means and SEM of results from three independent experiments. One-way analysis of variance (ANOVA) and Tukey’s post hoc test were used for statistical analysis. *, P < 0.05. RLU, relative light units. (E) Propagation of rBoDVs. OL cells were infected with rBoDVs at an MOI of 0.1. The levels of BoDV P mRNA and genome RNA at the indicated time points were measured by qRT-PCR. The data are presented as the means ± SEM of results from three independent experiments. One-way ANOVA and Tukey’s post hoc test were used for statistical analysis. *, P < 0.05; **, P < 0.01; n.s., not significant.
FIG 7
FIG 7
Comparison of splicing signals and hydrophobic regions across orthobornaviruses and endogenous bornavirus-like nucleoproteins. (A) Comparison of the splicing signals across orthobornaviruses. Nucleotide positions corresponding to the BoDV-1 genome are shown. Splicing signals are shown in boldface type. Asterisks represent conserved nucleotides. (B) Conservation of the signal peptide across orthobornaviruses. Amino acid positions corresponding to BoDV-1 N1 are shown. Underlined characters represent amino acids with hydrophobic residues. Asterisks represent conserved amino acids. (C) Conservation of the hydrophobic region in human and bat EBLN-1. Amino acid positions corresponding to BoDV-1 N1 are shown. Underlined characters represent amino acids with hydrophobic residues. Asterisks represent conserved amino acids. (D) Hydrophobicity of nucleoproteins across orthobornaviruses and an endogenous bornavirus-like element. Hydrophobicity was calculated by ProtScale. Full-length nucleoproteins of orthobornaviruses and endogenous bornavirus-like nucleoproteins were used for analysis. The regions corresponding to the hydrophobic transmembrane domain of N3 are shown in red. Accession numbers of protein sequences used for analysis are as follows: P0C796 for BoDV-1, YP_009269413 for variegated squirrel bornavirus 1 (VSBV-1), YP_009237642 for aquatic bird bornavirus 1 (ABBV-1), YP_009268905 for canary bornavirus 1 (CnBV-1), YP_009268893 for parrot bornavirus 4 (PaBV-4), YP_009268899 for PaBV-5, YP_009055058 for Loveridge’s garter snake virus 1 (LGSV-1), and NP_001186867 for Homo sapiens EBLN-1 (hsEBLN-1).
FIG 8
FIG 8
Schematic representation of N isoforms and their subcellular localization during BoDV infection. N1, N2, and N3 mRNAs are transcribed from the N gene. Each mRNA generates two isoforms by translation initiation from the first and second AUG codons. N1 translocates to the nucleus and accumulates in vSPOTs. The sole expression of N1′ localizes to the cytoplasm, while N1′ can enter the nucleus and vSPOTs via interaction with N1 and P in infected cells (Fig. 3A). N2 is transported into the nucleus, but N2 does not localize in vSPOTs. N2′ localizes only in the cytoplasm. N3 and N3′ translocate to the ER and are cleaved into the N3C C-terminal fragment by the host SPase.

Similar articles

Cited by

References

    1. Wasilewski M, Chojnacka K, Chacinska A. 2017. Protein trafficking at the crossroads to mitochondria. Biochim Biophys Acta Mol Cell Res 1864:125–137. doi:10.1016/j.bbamcr.2016.10.019. - DOI - PubMed
    1. Ullman KS, Powers MA, Forbes DJ. 1997. Nuclear export receptors: from importin to exportin. Cell 90:967–970. doi:10.1016/S0092-8674(00)80361-X. - DOI - PubMed
    1. von Heijne G. 1990. The signal peptide. J Membr Biol 115:195–201. doi:10.1007/BF01868635. - DOI - PubMed
    1. Hauri H-P, Schweizer A. 1992. The endoplasmic reticulum-Golgi intermediate compartment. Curr Opin Cell Biol 4:600–608. doi:10.1016/0955-0674(92)90078-Q. - DOI - PMC - PubMed
    1. Paterson RG, Lamb RA. 1990. RNA editing by G-nucleotide insertion in mumps virus P-gene mRNA transcripts. J Virol 64:4137–4145. - PMC - PubMed

Publication types

LinkOut - more resources