

Pivotal Roles of Cryptochromes 1a and 2 in Tomato Development and Physiology
- PMID: 30541876
- PMCID: PMC6426409
- DOI: 10.1104/pp.18.00793
Pivotal Roles of Cryptochromes 1a and 2 in Tomato Development and Physiology
Abstract
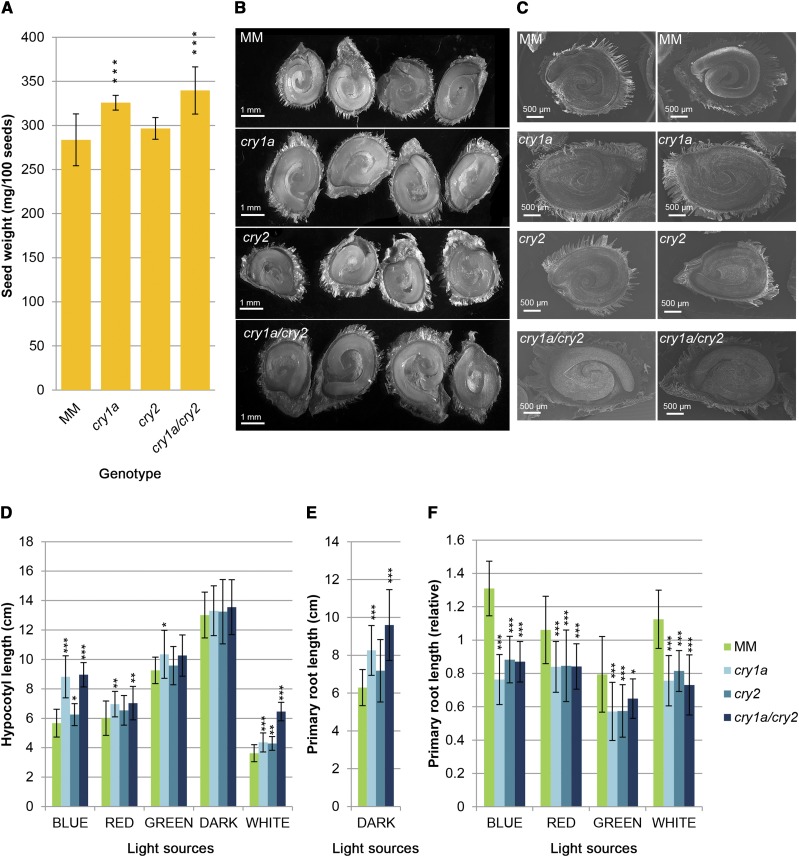
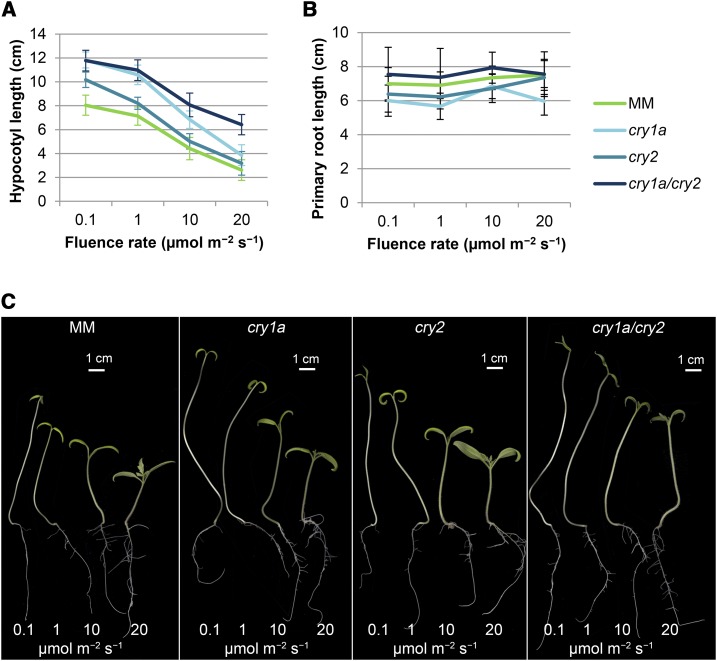
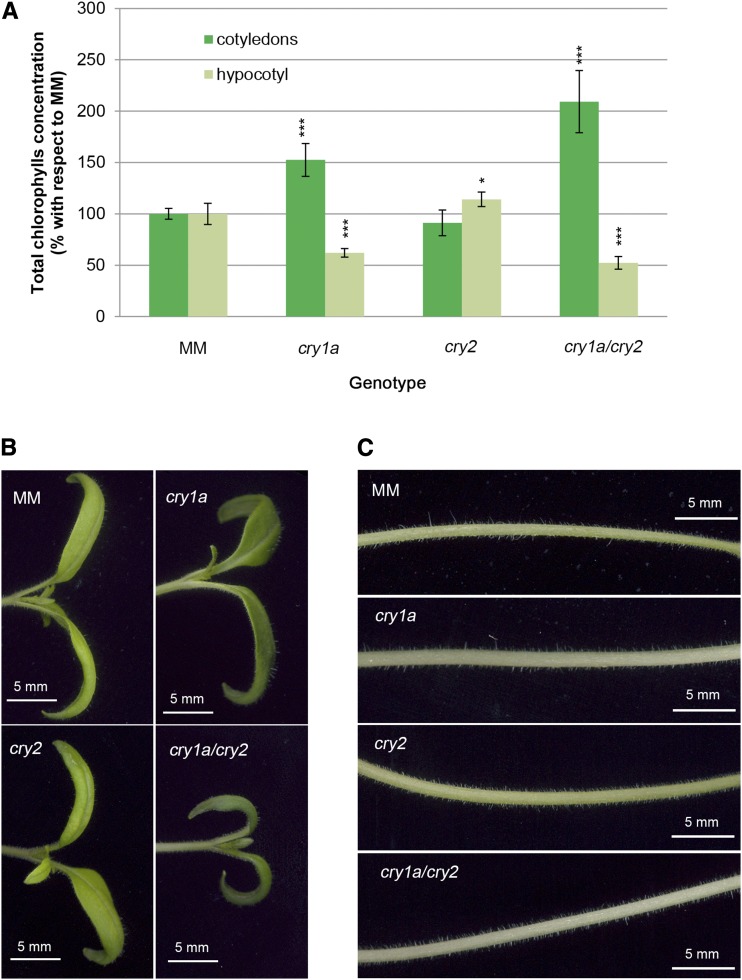
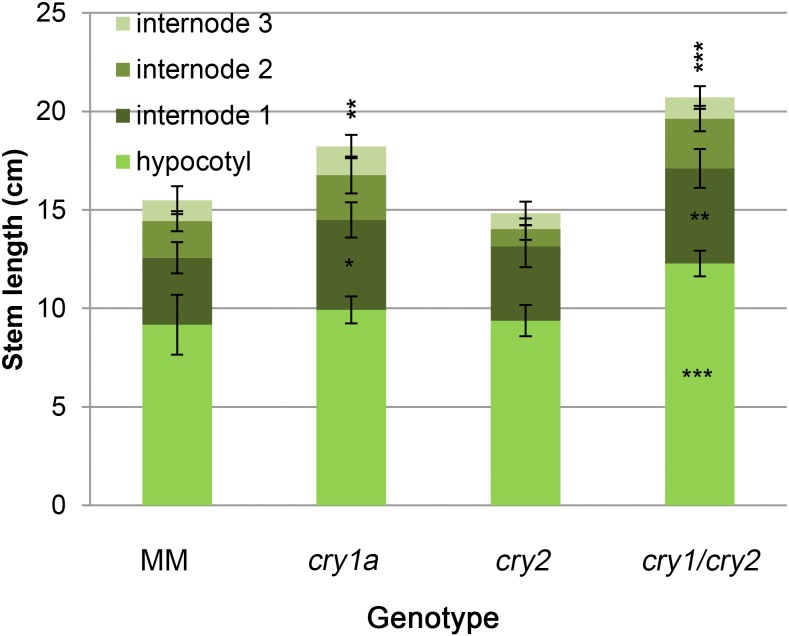
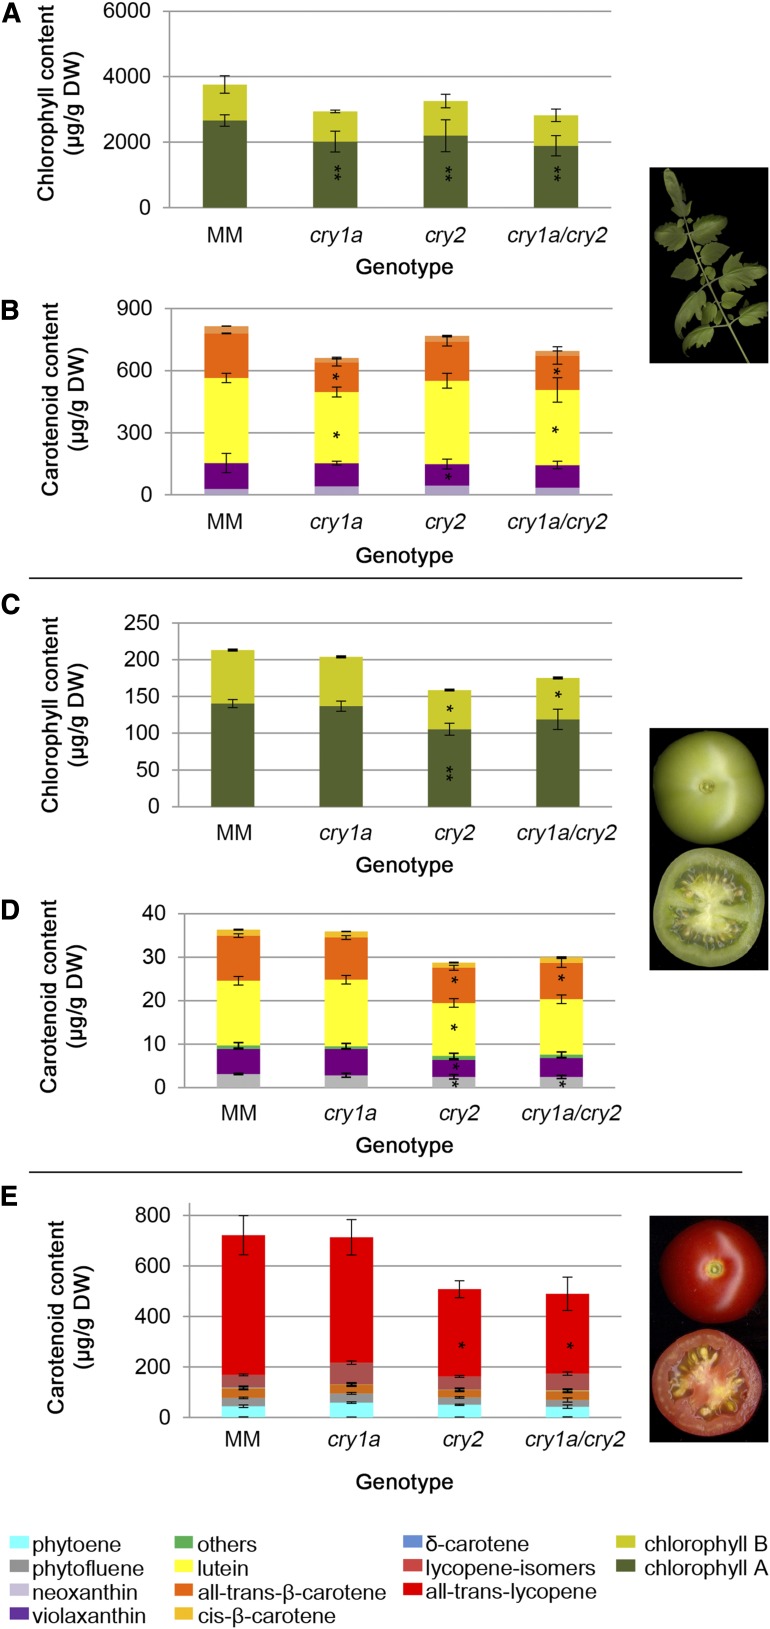
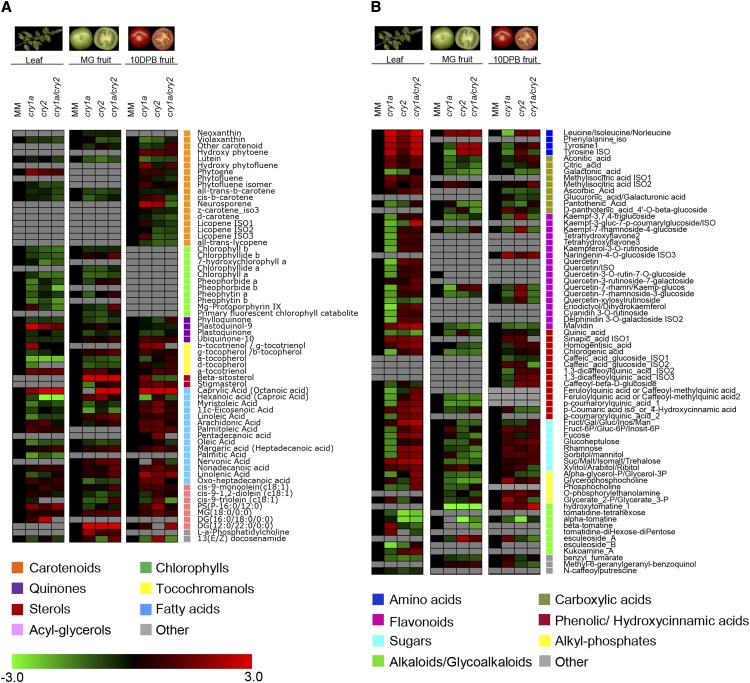
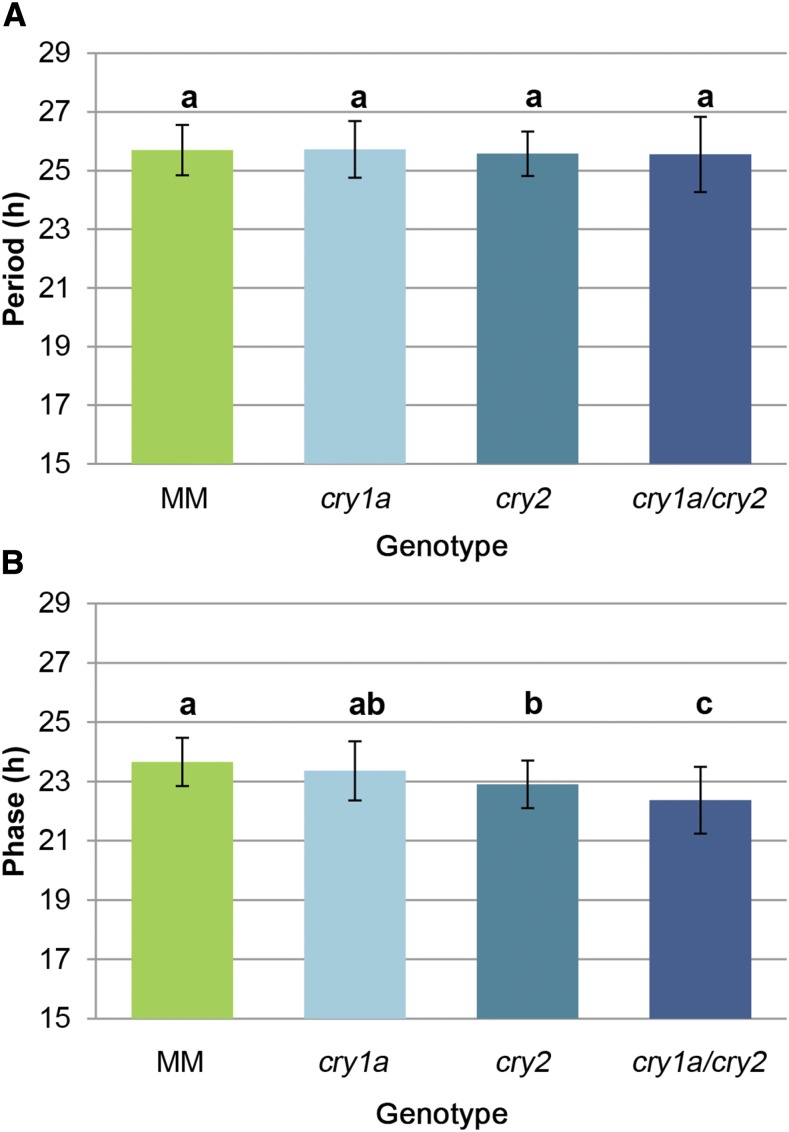
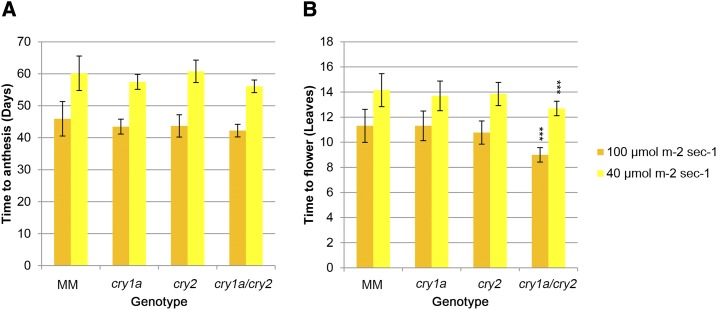
Cryptochromes are flavin-containing blue/UVA light photoreceptors that regulate various plant light-induced physiological processes. In Arabidopsis (Arabidopsis thaliana), cryptochromes mediate de-etiolation, photoperiodic control of flowering, entrainment of the circadian clock, cotyledon opening and expansion, anthocyanin accumulation, and root growth. In tomato (Solanum lycopersicum), cryptochromes are encoded by a multigene family, comprising CRY1a, CRY1b, CRY2, and CRY3 We have previously reported the phenotypes of tomato cry1a mutants and CRY2 overexpressing plants. Here, we report the isolation by targeting induced local lesions in genomes, of a tomato cry2 knock-out mutant, its introgression in the indeterminate Moneymaker background, and the phenotypes of cry1a/cry2 single and double mutants. The cry1a/cry2 mutant showed phenotypes similar to its Arabidopsis counterpart (long hypocotyls in white and blue light), but also several additional features such as increased seed weight and internode length, enhanced hypocotyl length in red light, inhibited primary root growth under different light conditions, anticipation of flowering under long-day conditions, and alteration of the phase of circadian leaf movements. Both cry1a and cry2 control the levels of photosynthetic pigments in leaves, but cry2 has a predominant role in fruit pigmentation. Metabolites of the sterol, tocopherol, quinone, and sugar classes are differentially accumulated in cry1a and cry2 leaves and fruits. These results demonstrate a pivotal role of cryptochromes in controlling tomato development and physiology. The manipulation of these photoreceptors represents a powerful tool to influence important agronomic traits such as flowering time and fruit quality.
© 2019 American Society of Plant Biologists. All Rights Reserved.
Figures
Similar articles
-
Manipulation of the blue light photoreceptor cryptochrome 2 in tomato affects vegetative development, flowering time, and fruit antioxidant content.Plant Physiol. 2005 Jan;137(1):199-208. doi: 10.1104/pp.104.051987. Epub 2004 Dec 23. Plant Physiol. 2005. PMID: 15618424 Free PMC article.
-
Green light reduces elongation when partially replacing sole blue light independently from cryptochrome 1a.Physiol Plant. 2021 Dec;173(4):1946-1955. doi: 10.1111/ppl.13538. Epub 2021 Sep 6. Physiol Plant. 2021. PMID: 34453337 Free PMC article.
-
Cryptochrome 1a depends on blue light fluence rate to mediate osmotic stress responses in tomato.J Plant Physiol. 2021 Mar-Apr;258-259:153374. doi: 10.1016/j.jplph.2021.153374. Epub 2021 Feb 6. J Plant Physiol. 2021. PMID: 33626482
-
Cryptochromes and the Circadian Clock: The Story of a Very Complex Relationship in a Spinning World.Genes (Basel). 2021 Apr 29;12(5):672. doi: 10.3390/genes12050672. Genes (Basel). 2021. PMID: 33946956 Free PMC article. Review.
-
Photocycle and signaling mechanisms of plant cryptochromes.Curr Opin Plant Biol. 2016 Oct;33:108-115. doi: 10.1016/j.pbi.2016.06.013. Epub 2016 Jul 14. Curr Opin Plant Biol. 2016. PMID: 27423124 Review.
Cited by
-
Characterization of Cry2 genes (CRY2a and CRY2b) of B. napus and comparative analysis of BnCRY1 and BnCRY2a in regulating seedling photomorphogenesis.Plant Mol Biol. 2022 Sep;110(1-2):161-186. doi: 10.1007/s11103-022-01293-6. Epub 2022 Jul 13. Plant Mol Biol. 2022. PMID: 35831732
-
Insight from expression profiles of FT orthologs in plants: conserved photoperiodic transcriptional regulatory mechanisms.Front Plant Sci. 2024 Jun 3;15:1397714. doi: 10.3389/fpls.2024.1397714. eCollection 2024. Front Plant Sci. 2024. PMID: 38887456 Free PMC article. Review.
-
Blue light regulates jasmonic acid synthesis via CRY1a and boosts antioxidant enzymes activity in Solanum lycopersicum to resist Botrytis cinerea.Plant Cell Rep. 2025 Jun 29;44(7):160. doi: 10.1007/s00299-025-03559-x. Plant Cell Rep. 2025. PMID: 40581909
-
Transcriptome profiling of barley and tomato shoot and root meristems unravels physiological variations underlying photoperiodic sensitivity.PLoS One. 2022 Sep 12;17(9):e0265981. doi: 10.1371/journal.pone.0265981. eCollection 2022. PLoS One. 2022. PMID: 36095002 Free PMC article.
-
Emergent molecular traits of lettuce and tomato grown under wavelength-selective solar cells.Front Plant Sci. 2023 Feb 13;14:1087707. doi: 10.3389/fpls.2023.1087707. eCollection 2023. Front Plant Sci. 2023. PMID: 36909444 Free PMC article.
References
-
- Ahmad M, Cashmore AR (1993) HY4 gene of A. thaliana encodes a protein with characteristics of a blue-light photoreceptor. Nature 366: 162–166 - PubMed
-
- Ahmad M, Lin C, Cashmore AR (1995) Mutations throughout an Arabidopsis blue-light photoreceptor impair blue-light-responsive anthocyanin accumulation and inhibition of hypocotyl elongation. Plant J 8: 653–658 - PubMed
-
- Bagnall DJ, King RW, Hangarter RP (1996) Blue-light promotion of flowering is absent in hy4 mutants of Arabidopsis. Planta 200: 278–280 - PubMed
Publication types
MeSH terms
Substances
LinkOut - more resources
Full Text Sources
