

Cytomegalovirus Exposure in the Elderly Does Not Reduce CD8 T Cell Repertoire Diversity
- PMID: 30541882
- PMCID: PMC6321841
- DOI: 10.4049/jimmunol.1800217
Cytomegalovirus Exposure in the Elderly Does Not Reduce CD8 T Cell Repertoire Diversity
Abstract
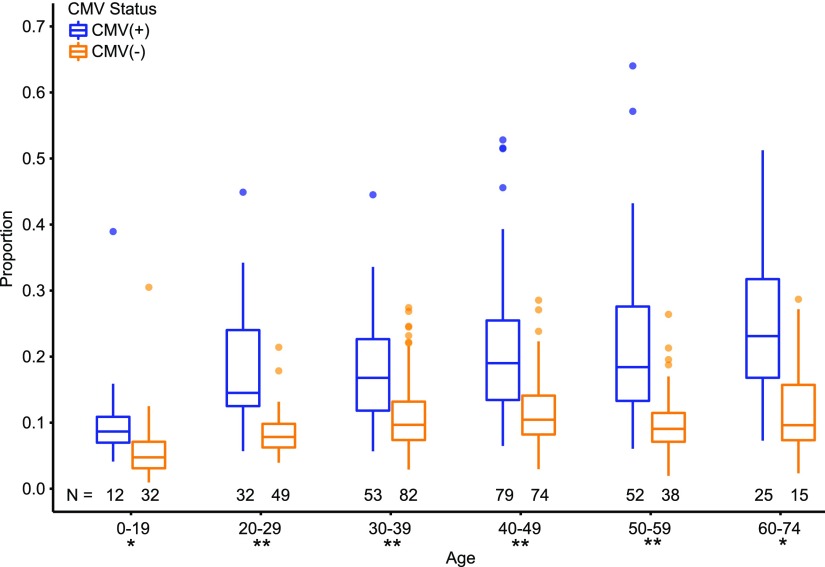
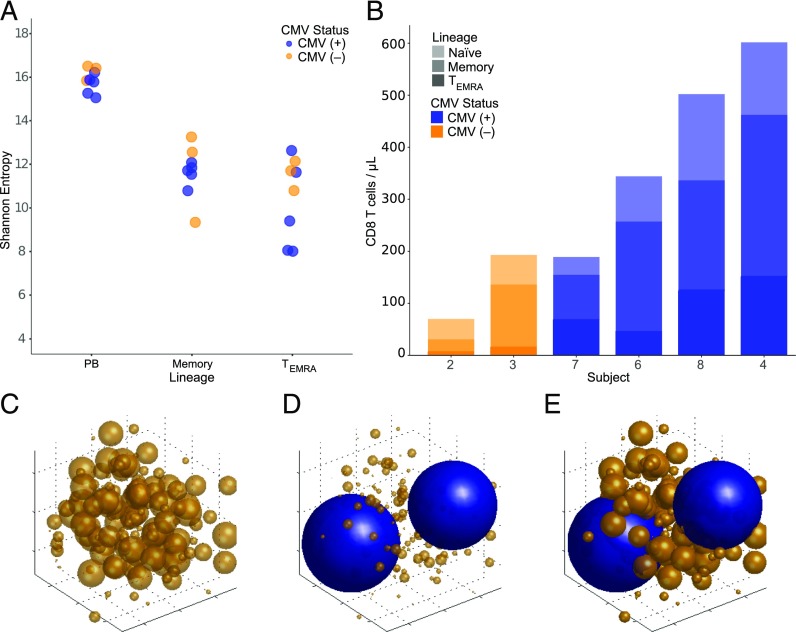
With age, the immune system becomes less effective, causing increased susceptibility to infection. Chronic CMV infection further impairs immune function and is associated with increased mortality in the elderly. CMV exposure elicits massive CD8+ T cell clonal expansions and diminishes the cytotoxic T cell response to subsequent infections, leading to the hypothesis that to maintain homeostasis, T cell clones are expelled from the repertoire, reducing T cell repertoire diversity and diminishing the ability to combat new infections. However, in humans, the impact of CMV infection on the structure and diversity of the underlying T cell repertoire remains uncharacterized. Using TCR β-chain immunosequencing, we observed that the proportion of the peripheral blood T cell repertoire composed of the most numerous 0.1% of clones is larger in the CMV seropositive and gradually increases with age. We found that the T cell repertoire in the elderly grows to accommodate CMV-driven clonal expansions while preserving its underlying diversity and clonal structure. Our observations suggest that the maintenance of large CMV-reactive T cell clones throughout life does not compromise the underlying repertoire. Alternatively, we propose that the diminished immunity in elderly individuals with CMV is due to alterations in cellular function rather than a reduction in CD8+ T cell repertoire diversity.
Copyright © 2019 The Authors.
Figures
Similar articles
-
Cytomegalovirus seropositivity drives the CD8 T cell repertoire toward greater clonality in healthy elderly individuals.J Immunol. 2002 Aug 15;169(4):1984-92. doi: 10.4049/jimmunol.169.4.1984. J Immunol. 2002. PMID: 12165524
-
Longitudinal studies of clonally expanded CD8 T cells reveal a repertoire shrinkage predicting mortality and an increased number of dysfunctional cytomegalovirus-specific T cells in the very elderly.J Immunol. 2006 Feb 15;176(4):2645-53. doi: 10.4049/jimmunol.176.4.2645. J Immunol. 2006. PMID: 16456027
-
Abundant cytomegalovirus (CMV) reactive clonotypes in the CD8(+) T cell receptor alpha repertoire following allogeneic transplantation.Clin Exp Immunol. 2016 Jun;184(3):389-402. doi: 10.1111/cei.12770. Epub 2016 Mar 8. Clin Exp Immunol. 2016. PMID: 26800118 Free PMC article.
-
Role of CMV in immune senescence.Virus Res. 2011 May;157(2):175-9. doi: 10.1016/j.virusres.2010.09.010. Epub 2010 Oct 1. Virus Res. 2011. PMID: 20869407 Review.
-
Immunorejuvenation in the elderly.Rejuvenation Res. 2006 Spring;9(1):111-6. doi: 10.1089/rej.2006.9.111. Rejuvenation Res. 2006. PMID: 16608407 Review.
Cited by
-
T-cells specific for KSHV and HIV migrate to Kaposi sarcoma tumors and persist over time.bioRxiv [Preprint]. 2025 Feb 15:2024.02.06.579223. doi: 10.1101/2024.02.06.579223. bioRxiv. 2025. PMID: 38370623 Free PMC article. Preprint.
-
Effect of Cytomegalovirus on the Immune System: Implications for Aging and Mental Health.Curr Top Behav Neurosci. 2023;61:181-214. doi: 10.1007/7854_2022_376. Curr Top Behav Neurosci. 2023. PMID: 35871707
-
Cytomegalovirus-Mediated T Cell Receptor Repertoire Perturbation Is Present in Early Life.Front Immunol. 2020 Sep 30;11:1587. doi: 10.3389/fimmu.2020.01587. eCollection 2020. Front Immunol. 2020. PMID: 33101265 Free PMC article.
-
CD4+ T cells expressing CX3CR1, GPR56, with variable CD57 are associated with cardiometabolic diseases in persons with HIV.Front Immunol. 2023 Feb 14;14:1099356. doi: 10.3389/fimmu.2023.1099356. eCollection 2023. Front Immunol. 2023. PMID: 36865544 Free PMC article.
-
Substantial uneven proliferation of CD4+ T cells during recovery from acute HIV infection is sufficient to explain the observed expanded clones in the HIV reservoir.J Virus Erad. 2022 Nov 30;8(4):100091. doi: 10.1016/j.jve.2022.100091. eCollection 2022 Dec. J Virus Erad. 2022. PMID: 36582473 Free PMC article.
References
Publication types
MeSH terms
Grants and funding
LinkOut - more resources
Full Text Sources
Medical
Molecular Biology Databases
Research Materials
