

SOG1 activator and MYB3R repressors regulate a complex DNA damage network in Arabidopsis
- PMID: 30541889
- PMCID: PMC6310815
- DOI: 10.1073/pnas.1810582115
SOG1 activator and MYB3R repressors regulate a complex DNA damage network in Arabidopsis
Abstract
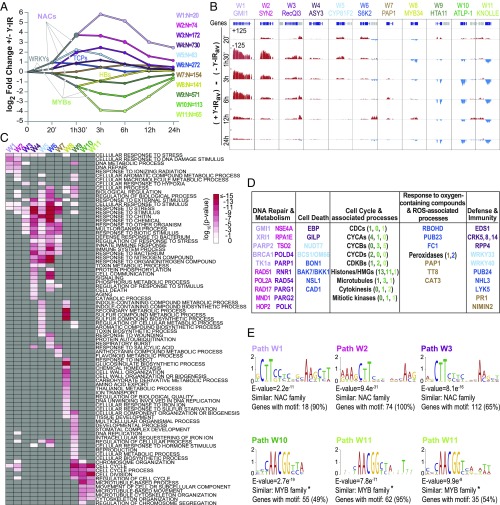
To combat DNA damage, organisms mount a DNA damage response (DDR) that results in cell cycle regulation, DNA repair and, in severe cases, cell death. Underscoring the importance of gene regulation in this response, studies in Arabidopsis have demonstrated that all of the aforementioned processes rely on SUPPRESSOR OF GAMMA RESPONSE 1 (SOG1), a NAC family transcription factor (TF) that has been functionally equated to the mammalian tumor suppressor, p53. However, the expression networks connecting SOG1 to these processes remain largely unknown and, although the DDR spans from minutes to hours, most transcriptomic data correspond to single time-point snapshots. Here, we generated transcriptional models of the DDR from GAMMA (γ)-irradiated wild-type and sog1 seedlings during a 24-hour time course using DREM, the Dynamic Regulatory Events Miner, revealing 11 coexpressed gene groups with distinct biological functions and cis-regulatory features. Within these networks, additional chromatin immunoprecipitation and transcriptomic experiments revealed that SOG1 is the major activator, directly targeting the most strongly up-regulated genes, including TFs, repair factors, and early cell cycle regulators, while three MYB3R TFs are the major repressors, specifically targeting the most strongly down-regulated genes, which mainly correspond to G2/M cell cycle-regulated genes. Together these models reveal the temporal dynamics of the transcriptional events triggered by γ-irradiation and connects these events to TFs and biological processes over a time scale commensurate with key processes coordinated in response to DNA damage, greatly expanding our understanding of the DDR.
Keywords: DNA damage response; DREM; SOG1; transcriptional networks.
Copyright © 2018 the Author(s). Published by PNAS.
Conflict of interest statement
The authors declare no conflict of interest.
Figures


Similar articles
-
SOG1: a master regulator of the DNA damage response in plants.Genes Genet Syst. 2016;90(4):209-16. doi: 10.1266/ggs.15-00011. Epub 2015 Nov 26. Genes Genet Syst. 2016. PMID: 26617076 Review.
-
An insight into the mechanism of DNA damage response in plants- role of SUPPRESSOR OF GAMMA RESPONSE 1: An overview.Mutat Res. 2020 Jan-Apr;819-820:111689. doi: 10.1016/j.mrfmmm.2020.111689. Epub 2020 Jan 23. Mutat Res. 2020. PMID: 32004947 Review.
-
Identifying the target genes of SUPPRESSOR OF GAMMA RESPONSE 1, a master transcription factor controlling DNA damage response in Arabidopsis.Plant J. 2018 May;94(3):439-453. doi: 10.1111/tpj.13866. Epub 2018 Mar 24. Plant J. 2018. PMID: 29430765
-
SOG1 and BRCA1 Interdependently Regulate RAD54 Expression for Repairing Salinity-Induced DNA Double-Strand Breaks in Arabidopsis.Plant Cell Physiol. 2024 May 30;65(5):708-728. doi: 10.1093/pcp/pcae008. Plant Cell Physiol. 2024. PMID: 38242160
-
SOG1 transcription factor promotes the onset of endoreduplication under salinity stress in Arabidopsis.Sci Rep. 2021 Jun 2;11(1):11659. doi: 10.1038/s41598-021-91293-1. Sci Rep. 2021. Retraction in: Sci Rep. 2024 Feb 21;14(1):4282. doi: 10.1038/s41598-024-54831-1. PMID: 34079040 Free PMC article. Retracted.
Cited by
-
Genome-wide identification and expression analysis of peach multiple organellar RNA editing factors reveals the roles of RNA editing in plant immunity.BMC Plant Biol. 2022 Dec 13;22(1):583. doi: 10.1186/s12870-022-03982-2. BMC Plant Biol. 2022. PMID: 36513981 Free PMC article.
-
Identification and Characterization of SOG1 (Suppressor of Gamma Response 1) Homologues in Plants Using Data Mining Resources and Gene Expression Profiling.Genes (Basel). 2022 Apr 9;13(4):667. doi: 10.3390/genes13040667. Genes (Basel). 2022. PMID: 35456473 Free PMC article.
-
A regulatory module controlling stress-induced cell cycle arrest in Arabidopsis.Elife. 2019 Apr 9;8:e43944. doi: 10.7554/eLife.43944. Elife. 2019. PMID: 30944065 Free PMC article.
-
XAP5 CIRCADIAN TIMEKEEPER Affects Both DNA Damage Responses and Immune Signaling in Arabidopsis.Front Plant Sci. 2021 Oct 1;12:707923. doi: 10.3389/fpls.2021.707923. eCollection 2021. Front Plant Sci. 2021. PMID: 34659282 Free PMC article.
-
Translational control of SOG1 expression in response to replication stress in Arabidopsis.Stress Biol. 2023 Jul 27;3(1):28. doi: 10.1007/s44154-023-00112-2. Stress Biol. 2023. PMID: 37676617 Free PMC article.
References
Publication types
MeSH terms
Substances
LinkOut - more resources
Full Text Sources
Molecular Biology Databases
Research Materials
Miscellaneous
