. 2018 Dec 26;115(52):E12172-E12181.
doi: 10.1073/pnas.1813378116. Epub 2018 Dec 12.

Electrostatics, proton sensor, and networks governing the gating transition in GLIC, a proton-gated pentameric ion channel

Affiliations

Electrostatics, proton sensor, and networks governing the gating transition in GLIC, a proton-gated pentameric ion channel

Haidai Hu et al. Proc Natl Acad Sci U S A. .

Abstract

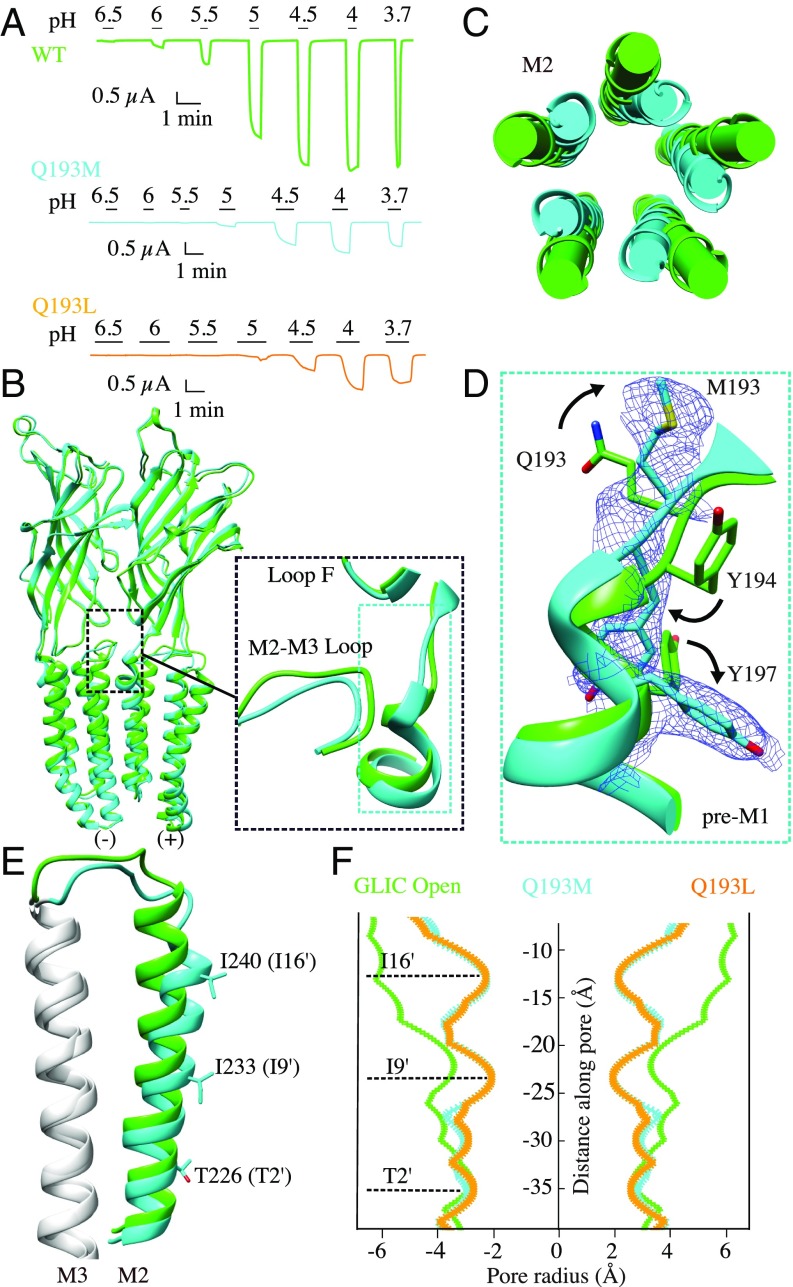
The pentameric ligand-gated ion channel (pLGIC) from Gloeobacter violaceus (GLIC) has provided insightful structure-function views on the permeation process and the allosteric regulation of the pLGICs family. However, GLIC is activated by pH instead of a neurotransmitter and a clear picture for the gating transition driven by protons is still lacking. We used an electrostatics-based (finite difference Poisson-Boltzmann/Debye-Hückel) method to predict the acidities of all aspartic and glutamic residues in GLIC, both in its active and closed-channel states. Those residues with a predicted pKa close to the experimental pH50 were individually replaced by alanine and the resulting variant receptors were titrated by ATR/FTIR spectroscopy. E35, located in front of loop F far away from the orthosteric site, appears as the key proton sensor with a measured individual pKa at 5.8. In the GLIC open conformation, E35 is connected through a water-mediated hydrogen-bond network first to the highly conserved electrostatic triad R192-D122-D32 and then to Y197-Y119-K248, both located at the extracellular domain-transmembrane domain interface. The second triad controls a cluster of hydrophobic side chains from the M2-M3 loop that is remodeled during the gating transition. We solved 12 crystal structures of GLIC mutants, 6 of them being trapped in an agonist-bound but nonconductive conformation. Combined with previous data, this reveals two branches of a continuous network originating from E35 that reach, independently, the middle transmembrane region of two adjacent subunits. We conclude that GLIC's gating proceeds by making use of loop F, already known as an allosteric site in other pLGICs, instead of the classic orthosteric site.

Keywords: allosteric modulation; electrostatic networks; pH activation; pentameric ligand-gated ion channel; proton sensor.


Conflict of interest statement

The authors declare no conflict of interest.

Figures

Fig. 1.
Fig. 1.
Predictions of proton-sensing residues among all Glu and Asp in GLIC derived from electrostatic FD/DH calculations. (A) Cartoon representation of the open form of GLIC crystallized at pH 4. The front subunit is highlighted and shown in green. Asp and Glu residues predicted to have ΔpKa larger than one unit between the open and closed states are shown as sticks and their Cα atoms are shown as red van der Waals spheres (Inset). Cα atom of R192 is shown as a cyan sphere. The black bars represent the plasma membrane level. (B) Top view of GLIC with color and representation of atoms identical to A. (C) Scatter plots for the predicted pKa values of all Asp (19 for each subunit) and Glu (16 for each subunit) for the open and closed forms of the receptor (red crosses). Residues deviating from the diagonal by more than one pH unit (black dots) are labeled. Residues lying on the diagonal (green line) have predicted pKa values that are equal in the two forms. The pink region contains residues for which the protonation state is predicted to change at pH50 ± 1 (pH50 = 5.10 ± 0.20). (D) ΔpKa values, from the open to closed form, of Asp and Glu are plotted as a function of the residue number (red line).
Fig. 2.
Fig. 2.
pH-induced FTIR difference spectra of GLIC reconstituted in POPE/POPG lipids of (A) wild-type GLIC and (B) the E35A mutant. Reference spectra were taken at pH = 7.0 and FTIR differences were recorded while the solution pH was continuously lowered. Negative peaks represent the structural components that were reduced after lowering the pH, while positive peaks represent the structural components that were gained by lowering the pH. (C) pH titration curves derived from the normalized intensities of the band at 1,400 cm−1 (symmetric carboxylate vibration) of the wild-type (+) and of the E35A mutant (red). Open and filled symbols represent data from different experiments performed under identical conditions. (D) Deviations of the mutants’ pH titration from the wild-type. The cross marker in black (+) represents trace deviation of wild-type between two different experiments, which sets the extent of the reproducibility error. The solid curves represent results of fitting the data points by the Henderson–Hasselbalch equation for E35A, E75A, E181A.
Fig. 3.
Fig. 3.
Probing the immediate environment of E35. (A) Cartoon representation of the open form at 2.22-Å resolution for GLIC at pH 4. Only two subunits, viewed from the outside of the pentamer, are shown. The ECD and TMD interface loop regions are highlighted in green and blue. The Inset shows structurally ordered water molecules at the ECD–TMD interface crevice. Water molecules are depicted as red spheres with blue mesh representation of 2mFo-DFc electron density map contoured at a level of 1 σ and overlaid. Surrounding residues are represented as sticks and labeled. Black dashed lines represent the hydrogen-bonds network at the domain interface made of water molecules, loop F, Q193, and the M2-M3 loop. (B) Effect of MMTS binding on the function of GLIC Cys-less and mutant T158C. The same recording protocol was used for all constructs (Materials and Methods).
Fig. 4.
Fig. 4.
Characterization of GLIC Q193M and Q193L mutations. (A) Proton-elicited currents from GLIC wild-type (green), Q193M (cyan), and Q193L (orange). (B) Structural superimposition of the GLIC Q193M (cyan) with the open form of wild-type GLIC (green). Only two subunits are shown viewed from the outside of the pentamer. Both structures are aligned using the whole pentamer. Inset shows an enlarged view of the pre-M1 region and of the M2-M3 loop reorganization. (C) Top view of the conformational change of M2 helices. (D) Conformational rearrangement of the pre-M1 region. The electron density of the 2mFo-DFc map around Q193M (blue) is contoured at the level of 1 σ. (E) Side view of the conformational change of the M2 helix, M2-M3 loop, and M3 helix from one subunit. (F) Pore-radius profile for GLIC WT open (green), Q193M (cyan), Q193L (orange). The constriction sites in the LC conformation from M2 helix are labeled and are shown as sticks in E.
Fig. 5.
Fig. 5.
The two electrostatic triads at the ECD–TMD interface governing channel gating. (A) Side view of two subunits of GLIC viewed from the outside of the pentamer. Inset shows a zoomed-in view of the interresidue electrostatic network at the ECD–TMD interface. The salt bridges formed between R192, D122, and D32 are shown in dashed lines. Hydrophobic stacking interactions between residue Y197, P120, Y119 (Cys-Loop) are also highlighted by a star. The interaction between the primary electrostatic triad and the secondary electrostatic triad through Y197 (pre-M1) and R192 is shown in dashed lines. (B) Proton-elicited currents of GLIC Y197F and Y197A. (C) Conformational change of Y197F mutant structure (purple) in the M2 helix and the M2-M3 loop compared with the GLIC wild-type (green). (D) Top view of the TMD. (E) Conformational rearrangement of the pre-M1 region. The electron density 2mFo–DFc map of the Y197F mutant structure (blue mesh) is contoured at the level of 1σ. (F) Top view of the structure of Y119A in the TMD region. The detergent molecules inserted into the intrasubunit cavity are shown as sticks with a blue mesh representation of the 2FoFc electron density map in its vicinity contoured at 1σ and overlaid. The Inset zooms in on the zone of interaction of a detergent molecule with residues bordering the intrasubunit cavity. (G) Top view of the structure of Y119F in the TMD region.
Fig. 6.
Fig. 6.
Two stabilization networks are used in GLIC to maintain the channel open. (A) View of the GLIC wild-type open-form structure. Two adjacent subunits are highlighted. (B) Multiple-sequence alignment of GLIC and its homologs in a limited set of regions to highlight the positions in GLIC (colored in red) whose mutation traps GLIC in LC conformation. The alignment contains GLIC (G. violaceus) and ELIC (E. chrysanthemi), sTeLIC (symbiont of the worm Tevnia), GluCl (a glutamate-gated chloride ion channel from Caenorhabditis elegans), α1-GlyR (the glycine receptor α1 subunit from zebrafish), and 5HT3A (the serotonin receptor from mouse). The remaining sequences are representatives for human pLGICs. Numbering refers to the GLIC protein sequence. The yellow stars indicate the residues forming the primary electrostatic triad and the purple stars indicate residues involved in the secondary electrostatic triad. The TGW motif in GLIC is boxed. (C and D) Two branches of a continuous network originating from E35 that reach, independently, the middle transmembrane region (H235) of two adjacent subunits. The proton-sensor E35 and key residues responsible for channel activation are shown as sticks. (C) View from outside the pentamer with the first network shown as a purple line, across subunits. (D) View from inside the pentamer showing the second network involving the hydrophobic cluster as an orange line, within the same subunit.

Similar articles

Cited by

References

    1. Corringer P-J, et al. Structure and pharmacology of pentameric receptor channels: From bacteria to brain. Structure. 2012;20:941–956. - PubMed
    1. Lee WY, Free CR, Sine SM. Binding to gating transduction in nicotinic receptors: Cys-loop energetically couples to pre-M1 and M2-M3 regions. J Neurosci. 2009;29:3189–3199. - PMC - PubMed
    1. Sauguet L, Shahsavar A, Delarue M. Crystallographic studies of pharmacological sites in pentameric ligand-gated ion channels. Biochim Biophys Acta. 2015;1850:511–523. - PubMed
    1. Althoff T, Hibbs RE, Banerjee S, Gouaux E. X-ray structures of GluCl in apo states reveal a gating mechanism of Cys-loop receptors. Nature. 2014;512:333–337. - PMC - PubMed
    1. Hibbs RE, Gouaux E. Principles of activation and permeation in an anion-selective Cys-loop receptor. Nature. 2011;474:54–60. - PMC - PubMed

Publication types