. 2019 Feb 6;39(6):984-1004.
doi: 10.1523/JNEUROSCI.2557-18.2018. Epub 2018 Dec 12.

Neurod1 Is Essential for the Primary Tonotopic Organization and Related Auditory Information Processing in the Midbrain

Affiliations

Neurod1 Is Essential for the Primary Tonotopic Organization and Related Auditory Information Processing in the Midbrain

Iva Macova et al. J Neurosci. .

Abstract

Hearing depends on extracting frequency, intensity, and temporal properties from sound to generate an auditory map for acoustical signal processing. How physiology intersects with molecular specification to fine tune the developing properties of the auditory system that enable these aspects remains unclear. We made a novel conditional deletion model that eliminates the transcription factor NEUROD1 exclusively in the ear. These mice (both sexes) develop a truncated frequency range with no neuroanatomically recognizable mapping of spiral ganglion neurons onto distinct locations in the cochlea nor a cochleotopic map presenting topographically discrete projections to the cochlear nuclei. The disorganized primary cochleotopic map alters tuning properties of the inferior colliculus units, which display abnormal frequency, intensity, and temporal sound coding. At the behavioral level, animals show alterations in the acoustic startle response, consistent with altered neuroanatomical and physiological properties. We demonstrate that absence of the primary afferent topology during embryonic development leads to dysfunctional tonotopy of the auditory system. Such effects have never been investigated in other sensory systems because of the lack of comparable single gene mutation models.SIGNIFICANCE STATEMENT All sensory systems form a topographical map of neuronal projections from peripheral sensory organs to the brain. Neuronal projections in the auditory pathway are cochleotopically organized, providing a tonotopic map of sound frequencies. Primary sensory maps typically arise by molecular cues, requiring physiological refinements. Past work has demonstrated physiologic plasticity in many senses without ever molecularly undoing the specific mapping of an entire primary sensory projection. We genetically manipulated primary auditory neurons to generate a scrambled cochleotopic projection. Eliminating tonotopic representation to auditory nuclei demonstrates the inability of physiological processes to restore a tonotopic presentation of sound in the midbrain. Our data provide the first insights into the limits of physiology-mediated brainstem plasticity during the development of the auditory system.

Keywords: Neurod1 mutation; auditory pathway; cochlear nucleus; inferior colliculus; plasticity; sensory topographical map.


Figures

Figure 1.
Figure 1.
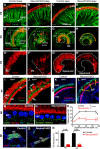
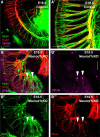
Morphology of the Neurod1cKO inner ear is altered. A–D, Whole-mount immunostaining with anti-Myo7a [a marker of hair cells (HCs)] and anti-acetylated α-tubulin (nerve fibers) antibodies shows subtle changes in a number of radial fibers (RFs), lack of the intraganglionic spiral bundle (IGSB; arrow), noticeable disorganization of RFs, and overshooting fibers in the apex of Neurod1cKO cochlea (C, D). Scale bar, 50 μm. E–H, Whole-mount immunostaining of SG neurons (anti-NeuN, a neuronal soma marker) and innervation shows reduction and disorganization of SG neurons in mutants. Scale bar, 50 μm. E′H′, Higher-magnification images demonstrate a decreased number and altered distribution of SG neurons. Scale bar, 20 μm. I, J, Immunohistochemistry for Myo7a and for β tubulin (a marker of inner pillar supporting cells) shows the disorganization of OHCs (red) and inner pillar cells (IPs; green) in the apex in Neurod1 cKO compared with the organ of Corti of control littermates at P7. Scale bar, 20 μm. HS, Hoechst nuclear staining. K, L, Immunohistochemistry for prestin (a marker for OHC) and calretinin (a marker for IHCs) shows trans-differentiated IHCs instead of OHCs (arrows) in the apex of the mutant cochlea at 1 month of age (M1). Scale bar, 20 μm. M, N, Confocal analysis of immunostaining for a synaptic ribbon protein (CtBP2) in the IHC area shows a reduction of ribbons in mutant adult mice compared with the controls. Phalloidin labels F-actin in stereocilia of hair cells. HS, Nuclear staining Hoechst. Scale bar, 10 μm. O, Quantification of ribbon synapses per IHC area along the tonotopic axis. Data are expressed as the mean ± SEM; n = 3; two-way ANOVA. ****p < 0.0001. P, Q, Immunohistochemistry for NeuN in SG neurons at M1, the dotted line indicates the boundaries of SG in the vibratome sections of the cochlea. Scale bar, 50 μm. R, Quantification of SG neurons in the control and Neurod1cKO cochlea at P0 and M1. Data are represented as the mean ± SEM; n = 3/genotype/age. Two-tailed unpaired t test. ***p < 0.001.
Figure 2.
Figure 2.
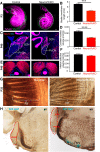
Deletion of Neurod1 affects the size of the components of the auditory pathways. A, B, Representative image of a whole-mount of control and Neurod1cKO cochlea at P3. Hair cells labeled with anti-Myo7a (green) and neuronal fibers with anti-β-tubulin (magenta). Note a reduced density of radial fibers in Neurod1cKO cochlea. Scale bar, 100 μm. Quantification of cochlear length at 4 weeks of age (n = 3). C, Sections of the CN immunostained with anti-NeuN (red) of adult control and Neurod1cKO, showing the DCN and PVCN. The line indicates the boundaries of the CN. HS, Nuclear staining Hoechst. Scale bar, 200 μm. D, Quantification of the volume of the adult CN normalized to body weight (n = 5). E, F, Immunostaining of coronal brain sections for NeuN and quantification of the volume of the adult control and Neurod1cKO IC, normalized to body weight (n = 5). Scale bar, 200 μm. Data (B, D, F) are the mean ± SEM. Two-tailed unpaired t test. ***p < 0.001, ****p < 0.0001. G, In the adult cochlea, decreased density and increased length of radial fibers (RFs) stained by OsO4 in Neurod1cKO are noticeable compared with the control. Scale bar, 100 μm. H, Using a LacZ reporter (R26R mouse line), Isl1-cre-mediated β-galactosidase reporter expression shows no Cre recombination in the CN in the brain sections. The dotted line indicates the boundaries of the CN. Cre recombination is detected by the LacZ reporter in the facial motor nucleus (FMN). Scale bar, 200 μm.
Figure 3.
Figure 3.
DPOAEs and ABRs are altered in Neurod1cKO. A, OHC function assessed by DPOAE shows significantly reduced levels in the low-frequency range. Data are the mean ± SEM; n = 12/control, n = 8/Neurod1cKO; two-way ANOVA with Bonferroni post hoc test. *p < 0.05, **p < 0.01, ****p < 0.0001. B, The average ABR thresholds of control (n = 12) and Neurod1cKO mice (n = 8). Five of the 8 Neurod1cKO animals did not have any response to the highest measured intensity at 2 or 40 kHz, indicated by the dotted line. Data are the mean ± SD; two-way ANOVA. ****p < 0.0001. C, Averaged ABR response curves evoked by an 80 dB SPL click; control in black, Neurod1cKO in red. The solid line shows the average and the shading indicates ±SEM. The ABR wave amplitudes of the mutant were five times lower than the control. Averaged individual ABR wave latency values are shown by the corresponding peaks. D, Averaged click-evoked ABR amplitude-intensity functions normalized to the wave amplitude at 90 dB SPL for ABR waves I and IV, and the ratio of ABR wave IV amplitude to wave I amplitude. Data are represented as the mean ± SD; two-way ANOVA. **p < 0.01, ***p < 0.001.
Figure 4.
Figure 4.
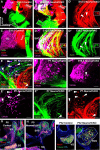
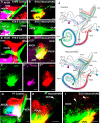
Translocated SG neurons form an aberrant, unsegregated spiro-vestibular ganglion in Neurod1cKO. A–F, Representative images of triple-dye labeling from the anterior vestibular end organs [labeled as utricle (U); magenta], apex (green), and base (red) of the cochlea shows the distribution of vestibular and SG neurons in whole-mounted collapsed stacks (AD) and optical confocal sections (E, F). Dye injection sites are indicated by arrowheads and labeled correspondingly “apex”, “base”, “U” (A, B). In the control (A, C), neurons located in the vestibular ganglion (VG) of the control are only labeled by utricular dye applications (A, C, magenta; basal turn, red; apex, green) injections label only fibers in the AN and utricular injection labels fibers of the vestibular nerve (VN). In Neurod1cKO (B–F), neurons labeled by dyes injected into the cochlear base and apex, and the utricle combine to form an aberrant enlarged ganglion, the SVG, as shown in whole mounts (B, D) or optical sections (E, F). In mutants, there is a tendency of fibers labeled from the apex (green) to be more anterior in the combined SVG and the combined AVN (B), whereas apical fibers run in the most posterior part of the AN in control animals (A, C). Overlapping fibers (yellow) labeled by the basal and apical dye applications are present in the mutant cochlear base (B, arrows). Note that double-labeled SVG neurons can be seen after basal and apical injections (D, E, yellow cells). The double-labeled cells after basal and anterior vestibular end organ injections can best be visualized when the dye is false colored in blue (E, double-labeled cells in magenta). D′D‴, E′E‴, Images of individual colors of the separate channels shown as a merged image in D and E (arrowheads indicate double-labeled cells from merged images). F, A merged image shows only apical turn dye labeled SG neurons (green, dotted circles) near magenta labeled vestibular neurons in the SVG. Note that green cells are substantially smaller compared with the VG neurons labeled from anterior vestibular end organ dye application. Scale bars, 100 μm; dorsal is up and posterior is to the right in all dye-tracing images. G, H, Representative vibratome sections show translocated spiral ganglion PROX1+ neurons in the SVG as detected by immunohistochemistry for PROX1 (a marker for SG neurons) and NeuN (a marker for differentiated neurons) in Neurod1cKO at P0. Scale bar, 100 μm. HS, Nuclear staining Hoechst. I, J, Immunohistochemistry for NeuN and β-tubulin in the adult control VG and Neurod1cKO SVG. Scale bar, 50 μm. Dotted lines indicate the boundaries of the SG, VG, and SVG.
Figure 5.
Figure 5.
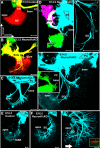
Loss of Neurod1 causes projection defects of SG neurons. A, B, Only afferents to the cochlea are labeled by the lipophilic dye injected into the CN (red) but not by dye injected into the cerebellum (green) in the control at E13.5. In Neurod1cKO littermates, some SG neurons and fibers are labeled from cerebellar injections (B, yellow, representing green overlapping with red). Note that afferents in the cochlea are distributed irregularly in mutants compared with controls (A, B, red). CF′, The cyan arrowheads show the approximate application site of the dye [posterior canal crista (PC)] that results in labeling of multiple cells and branches projecting to the developing organ of Corti in Neurod1cKO. Injection of three different colored dyes [utricle, magenta; PC, cyan; apex, green] into the E14.5 Neurod1cKO ear shows overlap of spiral and vestibular ganglion neurons in the spiro-vestibular ganglion and magenta fibers to the cochlea (C, D, D′). Higher-magnification of fibers in the cochlea labeled from PC injections shows multiple neuronal branches toward the developing organ of Corti hair cells (D″). The dye injected into the apex of Neurod1cKO (D′, inset, green) labels fibers reaching the base as well as fibers to the posterior canal crista in a pattern reminiscent of fibers labeled from PC injections. These neurons have branched axons that reach not only the brain but also the PC nerve. E, F, F′, After PC dye application at E16.5, only a few efferent collaterals are labeled in controls that contribute to the intraganglionic spiral bundle (IGSB). In Neurod1cKO at E16.5, PC dye application labels SG neurons near the apex that terminate in an unusual pattern along IHC (F′, arrow). This pattern is comparable to the reported pattern of vestibular fibers in a replacement model of neurotrophins (F′, inset; data from Tessarollo et al., 2004), indicating that some SG neurons project like vestibular neurons in the brain, reach vestibular end organs (such as the canal crista) and terminate at the organ of Corti in a pattern comparable to rerouted vestibular neurons. Scale bars, 100 μm. PC, Posterior crista; U, utricle; VG, vestibular ganglion.
Figure 6.
Figure 6.
Distribution and multiple branches of SG neurons reveal disorganization in the Neurod1cKO cochlea. A, B, The application of different colored dyes into the apex (green), base (red), and utricle (magenta) shows a spatially restricted labeling of SG neurons and fibers based on the injection site in controls (A), whereas both fibers and neurons are labeled throughout the Neurod1cKO cochlea by the utricle, base and apex injections (B). A′, In controls, overlapping (yellow) efferent fibers superimpose in the intraganglionic bundles (IGSB). Some efferent fibers are labeled either by the dye application to the apex or base in controls (red or green) and together with afferents form evenly spaced radial bundles. B′B‴, images of individual colors of the separate channels shown as a merged image in B. Note that SG neurons near the apex are double labeled with magenta (utricle) and green (apex) as indicated by arrowheads, and show in addition two or more local branches to different parts of the cochlea (B′). Scale bars, 100 μm.
Figure 7.
Figure 7.
Disorganized inner ear efferents reach the organ of Corti in the Neurod1cKO cochlea. A, A′, In control animals, the injections of lipophilic dye into the olivocochlear bundle (OCB; green) labels inner ear efferent fibers forming the intraganglionic bundle (IGSB) and dye application into the CN (red) labels SG neurons and afferent radial fibers reaching the organ of Corti (OC). B, B′, In Neurod1cKO, the same dye applications label the scattered SG neurons (red dye-labeled; arrowheads) in the cochlea and show strong efferent innervation that lacks an IGSB formation. Note also the profound innervation of the OHC region of the OC only in the apex of the Neurod1cKO mutant (B, arrow). Scale bars, 100 μm.
Figure 8.
Figure 8.
Neurod1cKO SG neurons project unsegregated widely ramifying central axons to the CN. A, C, E, Injections of different colored dyes (magenta, vestibular organs; red, base; green, apex) label distinct bundles of neuronal fibers (AN) projecting to the CN and vestibular nuclei in controls. The tonotopic organization of the CN subdivisions in controls is shown in the AVCN and the DCN with low-frequency fibers labeled from the apex and high-frequency from the base and no labeling between (the middle cochlea; A, E, G). The only mixed bundle (yellow) are inner ear efferents (IEEs; A). In Neurod1cKO, neuronal fibers completely overlap forming a mixed-labeled AVN (yellow) and are restricted to the ventral part of the CN with just a few fibers occasionally expanding to the DCN (B, D, F). The overlapping fibers in the AVCN indicate a loss of the tonotopic organization of the central projections (B, yellow fibers). C, D, Higher-magnification shows central afferents as parallel fibers (isofrequency bands) in control AVCN and DCN, whereas central projections of afferents in mutants branch in a restricted and erratic pattern in the CN (green dye injection into the apex). E, F, The tonotopic organization of the CN subdivisions with low-frequency-encoding fibers from the apex (green) terminating ventrally and high-frequency-encoding fibers from the base (red) terminating dorsally in the control AVCN and DCN. In contrast, disorganized fibers labeled by dye injected in the apex of Neurod1cKO project into the ventral part of the AVCN, whereas virtually only sporadic fibers labeled by basal dye injection reach only PVCN subdivisions. F′–F‴, Single color images show the incomplete cochlear projection segregation as well as some “vestibular” fibers projecting to the CN of Neurod1cKO (F″) that never happens in control animals (A, C, E). G, Very large lipophilic dye injections result in barely segregated projection with almost no space between apical and basal afferents in controls. Inset, Cochlear afferents organized as parallel fibers in isofrequency bands. H, I, Comparable large dye injections label sporadic and divergent fibers mostly in the ventral part of the CN of Neurod1cKO at P7 and E18.5. Note that single afferents project widely ramifying across the CN complex (H, I, arrowheads). Scale bars, 100 μm. J, Schematics of changes in Neurod1cKO: (1) SG neurons are miswired and misplaced into an aberrant SVG, (2) overlapped central auditory and vestibular afferents form the AVN, and 3) the CN has reduced projections without tonotopic organization both in terms of branch distribution within the cochlea and to the CN. The triangles indicate the application sites of the dyes in the base, apex, utricle (U), and posterior canal crista (PC). AC, Anterior crista; HC, horizontal crista; VG, vestibular ganglion; VN, vestibular nerve.
Figure 9.
Figure 9.
The formation of isofrequency bands in the anteroventral CN of Neurod1cKO is altered. A, A′, B, B′, Auditory nerve synaptic terminals of control and mutant mice are comparable, as anti-VGLUT1 labels the endbulb of Held synapses and anti-parvalbumin labels the bushy cell soma in the AVCN of the adult control and Neurod1cKO. C, Activated neurons are labeled by anti-c-Fos antibody in response to 15 kHz pure tone stimulation in the AVCN of 2 months old controls and Neurod1cKO. Dotted line indicates boundaries of the AVCN. A, Anterior; L, lateral; M, medial; P, posterior. D, The total number of c-Fos+ neurons determined in the sections of the AVCN of control (n = 4) and Neurod1cKO mice (n = 4). Two sections were evaluated per each individual mouse. Values are mean ± SEM. **p = 0.0099, t test. Scale bars: 200 μm; A′, B′, 10 μm. HS, Nuclear staining Hoechst.
Figure 10.
Figure 10.
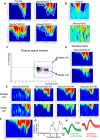
Deletion of Neurod1 affects the IC tuning curves of multiple and isolated single units. A, Representative examples of tuning curves recorded in the IC in control and Neurod1cKO mice. B, Response map to two-tone stimulation (fixed tone of 13 kHz), shows low- and high-frequency sideband inhibitory areas in control (the areas are outlined by white lines) and small and disorganized inhibitory areas in Neurod1cKO mice. C, Feature space window (in which each action potential is represented by a single point) with a delineated cluster of action potentials (purple dashed box) belonging to isolated single units recorded at the electrode channel. Action potentials corresponding to multiple unit activity are within the larger box (indicated by solid blue line). D, E, Examples of the tuning curves representing multiple unit activity and the activity of a single isolated unit from five different recordings in Neurod1cKO mice. F, Tuning curve of a multiple unit in Neurod1cKO mice; for the same recording, frequency profile of the same response to tonal stimulation at different frequencies with bimodal frequency tuning (at 30 dB sound attenuation) is calculated from single-unit activity (G). H, Action potential curves, recorded at two different points marked with the corresponding color in the frequency profile at (E), demonstrating very similar spike shapes and therefore classified as generated by the same neuron (single unit).
Figure 11.
Figure 11.
Characteristics of IC neurons are affected by acoustic information processing in the periphery. A, The dependence of IC excitatory thresholds on the CF of neuronal clusters (multiunits) in control and Neurod1cKO mice. Excitatory thresholds are shown as individual units and as averages in 0.3 octave bins. Data are mean ± SEM. Two-way ANOVA with Bonferroni post hoc test. ****p < 0.0001. B, Sharpness of the neuronal tuning expressed by quality factor Q10 (the ratio between the CF and bandwidth at 10 dB above the minimum threshold) averaged in 0.3 octave bins. Data are represented as the mean ± SEM; two-way ANOVA with Bonferroni post hoc test. ****p < 0.0001, **p < 0.01. C, Percentages of strictly monotonic, saturating and non-monotonic RIFs. Fisher's exact test. ***p < 0.001, ****p < 0.0001. D, Comparison of the RIF parameters in control and Neurod1cKO mice: dynamic range, relative response at the RIFs point R10 (10% of the RIF response magnitude), maximum response magnitude and spontaneous activity. Data are the mean ± SD; unpaired t test. *p < 0.05, ****p < 0.0001. For all extracellular recordings Neurod1cKO (n = 9; 432 units from the IC) and control mice (n = 10; 480 units) were used. E, The average probability of a response to individual clicks in the series of clicks. Inset, Diagram of the clicks train, where the rate continuously speeds up and then slows down again (mean ± SEM; n = 10/control, n = 9/Neurod1cKO; ****p < 0.0001, unpaired t test). F, Degree of synchronization for different interstimulus intervals (ISIs) expressed using the vector strength computed for responses to click trains with different interclick intervals (mean ± SD; n = 10/control, n = 9/Neurod1cKO; ****p < 0.0001, two-way ANOVA with Bonferroni post hoc test).
Figure 12.
Figure 12.
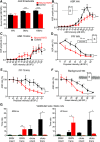
ASR and PPI responses are altered in Neurod1cKO. A, Thresholds of ASRs for WN, and tone pips at 8 and 16 kHz in control and Neurod1cKO mice. Data are the mean ± SEM, n = 8/group. Statistical significance determined by the Holm–Sidak method, t test. *p < 0.05, **p < 0.01, ***p < 0.001. Amplitude-intensity ASR functions for WN (B), and for tone pips of 16 kHz (C) in control and Neurod1cKO mice. Data are the mean ± SEM, n = 8/group. D, Efficacy of the WN and (E) 16 kHz tone prepulse intensity on the relative ASR amplitude; 100% corresponds to the ASR amplitude without a prepulse (uninhibited ASR). Data are the mean ± SEM, n = 8/group. F, Impact of a continuous background WN with increasing intensity on the relative ASR amplitude; 100% corresponds to the amplitude of uninhibited ASR (response in silence). Data are the mean ± SEM, n = 8/group. Two-way ANOVA with Bonferroni post hoc tests for BF. *p < 0.05, **p < 0.01, ***p < 0.001, ****p < 0.0001. G, Ratio of the orientation (orient) and transition (trans) time in the presence of background WN (BWN) or series of clicks to the time in silence on rods of 20 or 15 mm diameters. The green line depicts the point when the ratio is 1 (no change in measured times with/without sound). Data are the mean ± SEM (control, n = 4; Neurod1cKO, n = 3). Statistical significance determined using two-way ANOVA with Sidak's multiple-comparison test. *p < 0.05, **p < 0.01.
Figure 13.
Figure 13.
Model of tonotopic phenotype in Neurod1cKO. In control mice, spiral ganglion afferent neurons (SGN) are radially connected with a single ending to IHCs (10–20 neurons/1 IHC). IHCs at different parts of the cochlea are stimulated by different frequencies, forming a tonotopic map with high frequencies at the base and low frequencies at the apex. The auditory system is tonotopically organized at all levels including the auditory nerve. The CN is the first target of the auditory nerve. SGN axons project centrally into the AVCN, relaying distinct frequencies within their corresponding isofrequency band. The IC is a major center for the integration of auditory sensory information from ascending pathways, including the pathway from the CN. The tuning curve of each IC unit represents a combination of the frequency and amplitude that evokes a response. At one frequency, the best frequency, sensitivity is highest. In Neurod1cKO mutants, the SG is disorganized, with aberrant innervation and a reduced number of neurons, many of which are displaced in the spiro-vestibular ganglion. There is little cochleotopic organization of afferents to the organ of Corti, within the auditory nerve and in the CN. SG afferents relaying specific frequencies target more AVCN cells outside the isofrequency band. Characteristics of IC neurons are altered with an enlarged frequency range and higher excitatory thresholds. The tuning characteristics of IC neurons are broad with multiple peaks of “best frequency”. AC, Anterior crista; AN, auditory nerve; HC, horizontal crista; PC, posterior crista; RF, radial fibers; VG, vestibular ganglion; VN, vestibular nerve.

References

    1. Baker CI, Peli E, Knouf N, Kanwisher NG (2005) Reorganization of visual processing in macular degeneration. J Neurosci 25:614–618. 10.1523/JNEUROSCI.3476-04.2005 - DOI - PMC - PubMed
    1. Bohuslavova R, Dodd N, Macova I, Chumak T, Horak M, Syka J, Fritzsch B, Pavlinkova G (2017) Pax2-Islet1 transgenic mice are hyperactive and have altered cerebellar foliation. Mol Neurobiol 54:1352–1368. 10.1007/s12035-016-9716-6 - DOI - PMC - PubMed
    1. Buonomano DV, Merzenich MM (1998) Cortical plasticity: from synapses to maps. Annu Rev Neurosci 21:149–186. 10.1146/annurev.neuro.21.1.149 - DOI - PubMed
    1. Buran BN, Strenzke N, Neef A, Gundelfinger ED, Moser T, Liberman MC (2010) Onset coding is degraded in auditory nerve fibers from mutant mice lacking synaptic ribbons. J Neurosci 30:7587–7597. 10.1523/JNEUROSCI.0389-10.2010 - DOI - PMC - PubMed
    1. Bures Z, Grécová J, Popelár J, Syka J (2010) Noise exposure during early development impairs the processing of sound intensity in adult rats. Eur J Neurosci 32:155–164. 10.1111/j.1460-9568.2010.07280.x - DOI - PubMed

Publication types

MeSH terms

Substances

LinkOut - more resources