. 2019 May 8;68(2):177-193.
doi: 10.1538/expanim.18-0139. Epub 2018 Dec 13.

Genetic diversity of 21 experimental chicken lines with diverse origins and genetic backgrounds

Affiliations

Genetic diversity of 21 experimental chicken lines with diverse origins and genetic backgrounds

Mitsuo Nunome et al. Exp Anim. .

Abstract

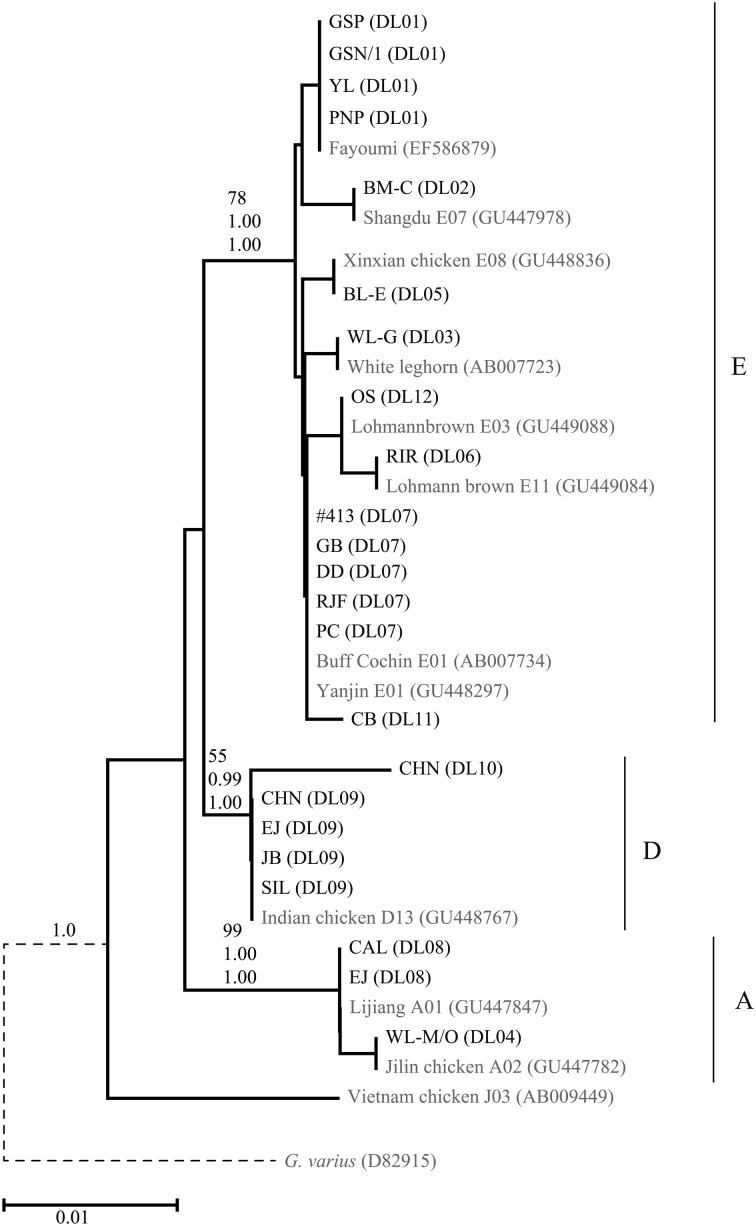
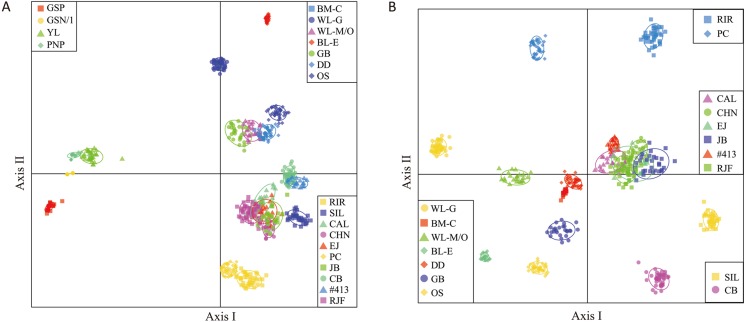
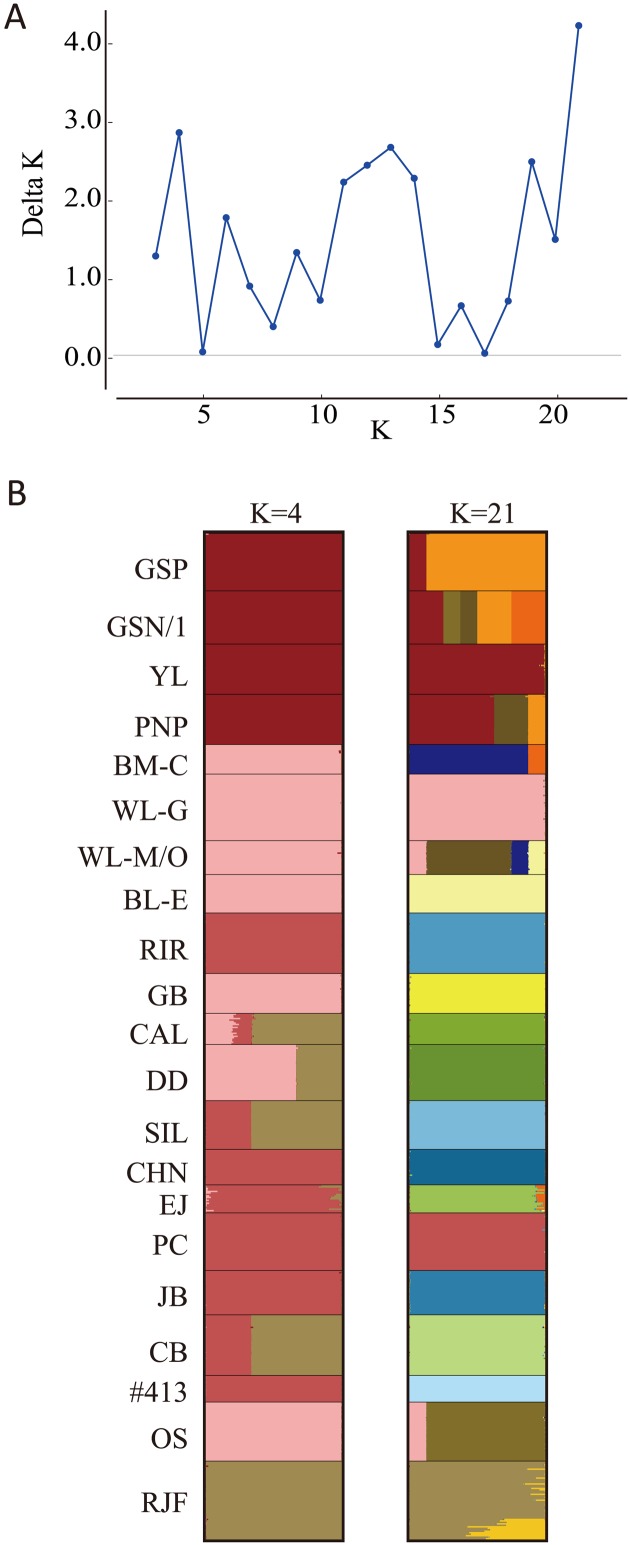
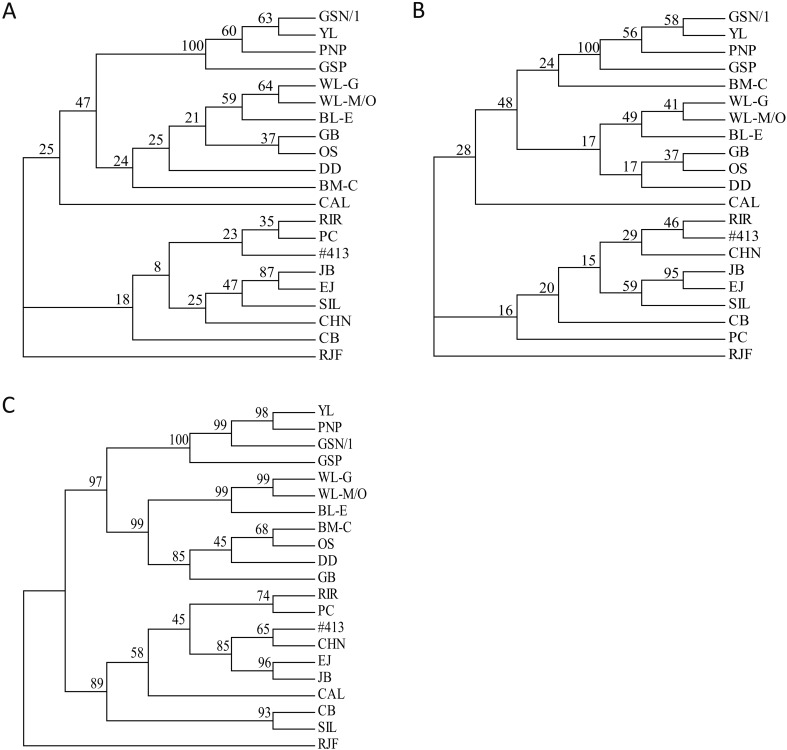
The genetic characteristics and diversity of 21 experimental chicken lines registered with the National BioResource Project of Japan were examined using mitochondrial D-loop sequences and 54 microsatellite DNA markers. A total of 12 haplotypes were detected in the 500-bp mitochondrial DNA sequences of the hypervariable segment I for 349 individuals of 21 lines. The 12 haplotypes belonged to three (A, D, and E) haplogroups, out of the eight (A‒H) common haplogroups in domestic chickens and red junglefowls. The haplogroups A and D were widely represented in indigenous chickens in the Asian and Pacific regions, and the haplogroup E was the most prevalent in domestic chickens. Genetic clustering by discriminant analysis of principal components with microsatellite markers divided 681 individuals of 21 lines into three groups that consisted of Fayoumi-, European-, and Asian- derived lines. In each of the cladograms constructed with Nei's genetic distances based on allele frequencies and the membership coefficients provided by STRUCTURE and with the genetic distance based on the proportion of shared alleles, the genetic relationships coincided well with the breeding histories of the lines. Microsatellite markers showed remarkably lower genetic heterozygosities (less than 0.1 observed heterozygosity) for eight lines (GSP, GSN/1, YL, PNP, BM-C, WL-G, BL-E, and #413), which have been maintained as closed colonies for more than 40 years (except for #413), indicating their usefulness as experimental chicken lines in laboratory animal science research.

Keywords: chicken bioresource; genetic diversity; microsatellite DNA marker; mitochondrial DNA.


Figures

Fig. 1.
Fig. 1.
Neighbor-joining tree of mitochondrial DNA D-loop haplotypes of 21 chicken lines. Because the neighbor-joining tree and the Bayesian trees generated basically the same topologies, the neighbor-joining tree is shown as a representative tree. Sequences obtained from GenBank are indicated in gray. The branch support values on the primary branch of each haplogroup are shown in the following order from top to bottom: bootstrap values for the neighbor-joining tree based on the TrN+I model, posterior probabilities for the Bayesian tree based on the TrN+I model, and posterior probabilities for the Bayesian tree based on the HKY+I model. The branch of the outgroup species (Gallus varius, dashed line) is shortened because the branch lengths was too long to be shown in the figure.
Fig. 2.
Fig. 2.
Discriminant analysis of principal components (DAPC) plots using 54 microsatellite DNA markers. (A) DAPC plot of 21 chicken lines. The populations are subdivided into three groups: four Fayoumi-derived lines, seven lines of European origin, and ten lines of Asian origin. (B) DAPC of 17 lines excluding four Fayoumi lines. Each population group is enclosed by a circle, which covers 80% of the distribution of individuals of each population.
Fig. 3.
Fig. 3.
Bayesian clustering of 21 chicken lines. (A) Delta K values at K=3 to K=21 generated by STRUCTURE HARVESTER. (B) Group memberships of 21 chicken lines at K=4 and K=21 are shown by different colors, which were produced using CLUMPAK.
Fig. 4.
Fig. 4.
Cladograms of 21 chicken lines. (A, B) Cladograms constructed with the Nei’s genetic distance based on allele frequencies (Da) [42] (A) and the genetic distance based on the proportion of shared alleles (Dps) [2] (B) using 54 microsatellite DNA markers, which were calculated using MICROSATELLITE ANALYZER. (C) Cladogram constructed by POPTREE2 with Nei’s genetic distances between lines based on the membership coefficients (Dmc) Dmc generated at K=2 to K=21 using CLUMPAK. Numbers on branches indicate bootstrap values of 1,000 replicates.

References

    1. Berthouly-Salazar C., Rognon X., Van T., Gély M., Chi C.V., Tixier-Boichard M., Bed’Hom B., Bruneau N., Verrier E., Maillard J.C., Michaux J.R.2010. Vietnamese chickens: a gate towards Asian genetic diversity. BMC Genet. 11: 53. doi: 10.1186/1471-2156-11-53 - DOI - PMC - PubMed
    1. Bowcock A.M., Ruíz-Linares A., Tomfohrde J., Minch E., Kidd J.R., Cavalli-Sforza L.L.1994. High resolution of human evolutionary trees with polymorphic microsatellites. Nature 368: 455–457. doi: 10.1038/368455a0 - DOI - PubMed
    1. Carlsson J.2008. Effects of microsatellite null alleles on assignment testing. J. Hered. 99: 616–623. doi: 10.1093/jhered/esn048 - DOI - PubMed
    1. Chang C.S., Chen C.F., Berthouly-Salazar C., Chazara O., Lee Y.P., Chang C.M., Chang K.H., Bed’Hom B., Tixier-Boichard M.2012. A global analysis of molecular markers and phenotypic traits in local chicken breeds in Taiwan. Anim. Genet. 43: 172–182. doi: 10.1111/j.1365-2052.2011.02226.x - DOI - PubMed
    1. Cole R.K.1966. Hereditary hypothyroidism in the domestic fowl. Genetics 53: 1021–1033. - PMC - PubMed

Substances