. 2018 Dec 12;8(1):17800.
doi: 10.1038/s41598-018-36087-8.

Figure-ground perception in the awake mouse and neuronal activity elicited by figure-ground stimuli in primary visual cortex

Affiliations

Figure-ground perception in the awake mouse and neuronal activity elicited by figure-ground stimuli in primary visual cortex

Ulf H Schnabel et al. Sci Rep. .

Abstract

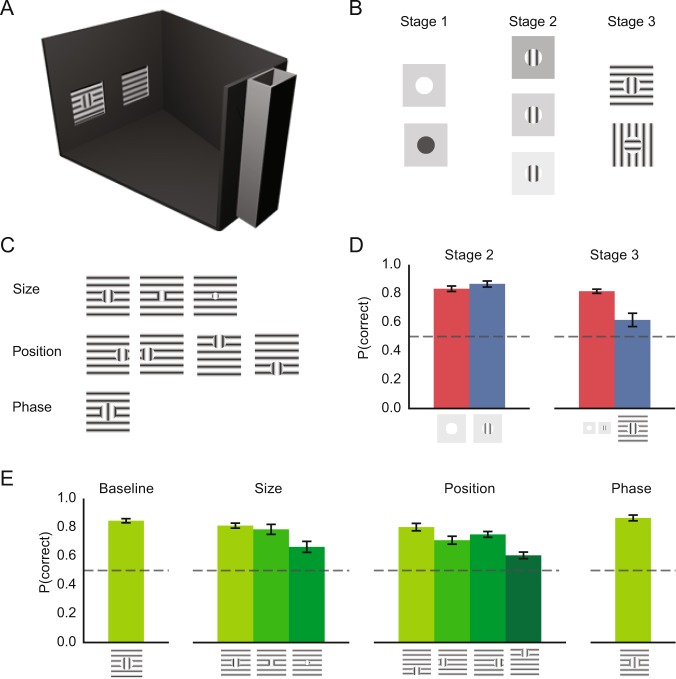
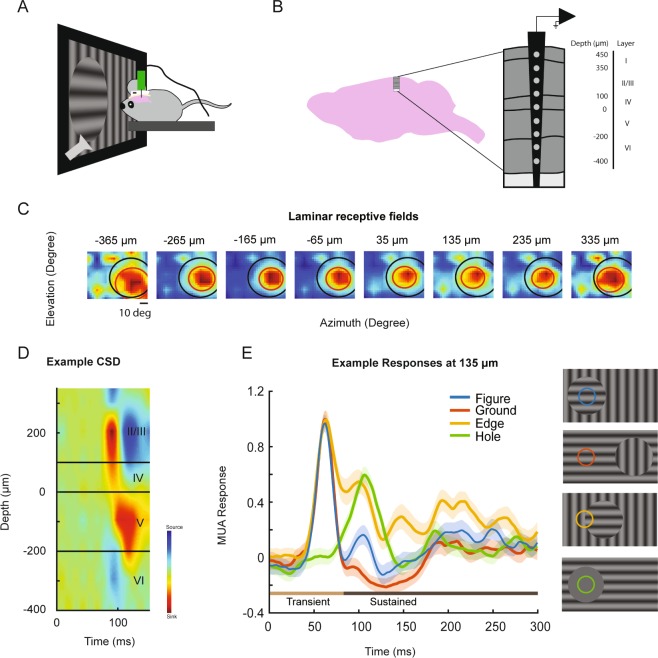
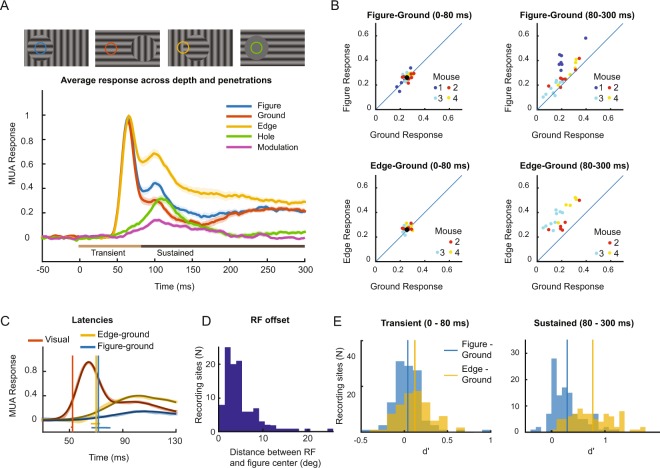
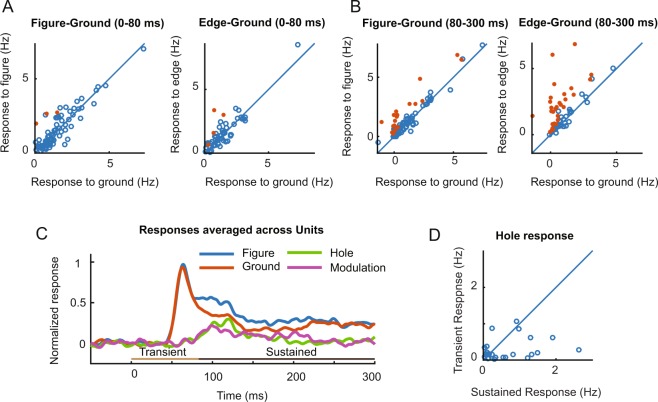
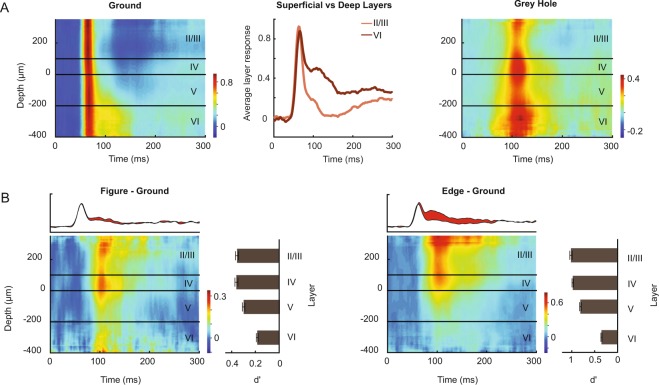
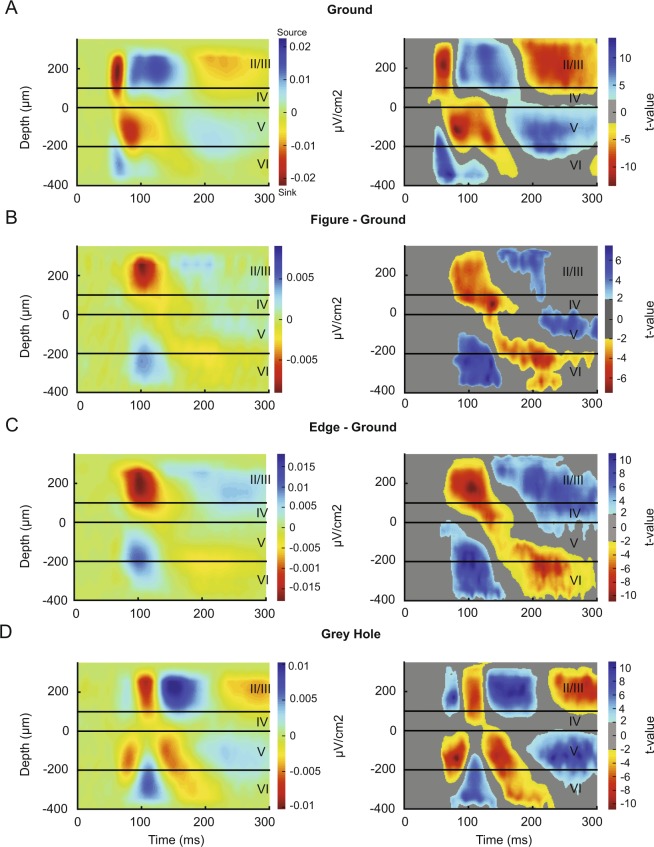
Figure-ground segregation is the process by which the visual system identifies image elements of figures and segregates them from the background. Previous studies examined figure-ground segregation in the visual cortex of monkeys where figures elicit stronger neuronal responses than backgrounds. It was demonstrated in anesthetized mice that neurons in the primary visual cortex (V1) of mice are sensitive to orientation contrast, but it is unknown whether mice can perceptually segregate figures from a background. Here, we examined figure-ground perception of mice and found that mice can detect figures defined by an orientation that differs from the background while the figure size, position or phase varied. Electrophysiological recordings in V1 of awake mice revealed that the responses elicited by figures were stronger than those elicited by the background and even stronger at the edge between figure and background. A figural response could even be evoked in the absence of a stimulus in the V1 receptive field. Current-source-density analysis suggested that the extra activity was caused by synaptic inputs into layer 2/3. We conclude that the neuronal mechanisms of figure-ground segregation in mice are similar to those in primates, enabling investigation with the powerful techniques for circuit analysis now available in mice.


Conflict of interest statement

The authors declare no competing interests.

Figures

Figure 1
Figure 1
Figure-ground perception in mice. (A) Schematic of the setup for the behavioral experiment, with a feeding box on the right and two touch screens on the left. (B) The mouse had to choose between a stimulus with a circle (the figure) and a homogeneous display without a circle. Reward was given if the animal chose the stimulus with the figure. During stage 1 of the training process, the mice saw circles that were either lighter or darker than the background. During stage 2 we presented a grating stimulus on a homogeneous background and during stage 3 we included grating figures superimposed on a background with the orthogonal orientation. (C) For the tests of generalization, we either varied the size, the position or the phase of the figure. Note that the grating orientation of the figure and background could be either vertical or horizontal so that the local orientation could not be used to solve the task. (D) Accuracy for the familiar (red bar) and new (blue bar) stimuli in the first sessions of stage 2 and stage 3. Error bars indicate SEM. In stage two, the luminance defined circles were replaced by gratings. Each of the seven mice performed 40 familiar and 60 new trials in stage 2. In stage 3, the mice saw figure-ground stimuli with a figure grating on top of a background with the orthogonal grating for the first time. Here each mouse performed 80 familiar and 28 new trials. Example stimuli are shown underneath each bar. (E) Average baseline accuracy for the figure-ground (stage 3) stimuli and accuracy in the generalization tests. Each mouse performed 100 trials for the baseline condition and 60 trials for each of the other conditions. Error bars indicate SEM across 7 animals.
Figure 2
Figure 2
Electrophysiological recordings. (A) For the V1 recordings, the mouse’s head was immobilized in front of a screen and we presented visual stimuli while using a laminar probe to record V1 activity. Eye position was monitored with an eye tracker. (B) We inserted a laminar electrode with a spacing of 100um between the recording sites into primary visual cortex (C) RFs of the different recording sites of an example penetration (see Methods). Red ellipses represent the full width at half maximum of a 2D-gaussian fitted to the response profile to estimate the RFs. Black line indicates the perimeter of the figure stimulus. (D) CSD of the same penetration. The bottom of the early sink demarcates the boundary between L4 and L5. This sink provides an estimate of the position of the electrode and was used to align the data of different penetrations. (E) MUA responses elicited by the visual stimuli (illustrated on the right) at one example recording site in layer 2/3. The color of the traces corresponds to the color of the receptive field on the visual stimuli shown on the right. The shaded area shows the SEM across trials.
Figure 3
Figure 3
Multi-unit activity elicited by the figure-ground stimuli in V1. (A) The V1 MUA response elicited by the different stimuli, averaged across all layers of the 21 penetrations for which all four stimuli were presented. The shaded area indicates the SEM across penetrations. (B) Comparison of activity elicited by the figure and background (top) and the edge and background (bottom) during the early (0–80 ms, left) and late time-window (80–300 ms, right). Data from the different mice are shown in distinct colors. Each data point represents the average activity across all recording sites of one penetration. (C) The latency of the visual response and the figure-ground modulation was determined with a curve-fitting method (see Methods). Thick lines show the data and thin black lines the fits. The vertical lines show the estimated latency of the visual response (red), the difference between the edge and background response (yellow) and the difference between the figure and background response (blue). The horizontal lines indicate the 95% confidence interval of the latencies as determined with a bootstrapping method. The red horizontal line is difficult to see because the 95%-confidence interval is very narrow. (D) Distribution of the distance between the center of the RFs of the MUA recording sites and the figure center. (E) Distribution of d′ values of the MUA for discriminating between figure and ground (blue) and between edge and ground (yellow) during the early, transient (0–80 ms, left) and late, sustained time-window (80–300 ms, right).
Figure 4
Figure 4
Figure ground modulation of single V1 neurons. (A) Comparison of firing rates of single units in V1 during the early time-window (0–80 ms) elicited by the figure center and background (left, N = 85), and elicited by the figure edge and background (right, N = 59). Red dots illustrate neurons for which the response differed significantly (p < 0.05). (B) Same as A, but during the later time-window (80–300 ms). (C) Average V1 response of single units (N = 59). Before averaging, the activity of individual neurons was normalized by first subtracting the baseline activity and then dividing by the peak response in the ground condition. The purple trace illustrates the time course of figure-ground modulation, which is the difference between the activity elicited by the figure and the background (i.e. blue minus red curve). The green trace shows the average response to the hole condition. The horizontal lines above the x-axis illustrate the early (light brown, 0–80 ms) and late time-windows (dark brown, 80–300 ms) used in the analysis. (D) Single unit response upon presentation of ground and hole stimuli during the transient (y-axis) and the sustained phase (x-axis) (N = 59).
Figure 5
Figure 5
Laminar profile of figure ground modulation of V1 MUA. (A) Laminar profile of the MUA response elicited by a homogeneous grating (left) and by the stimulus with the grey hole (right). X-axis, time; y-axis, laminar depth. The middle panel compares the response evoked by the ground in the superficial and the deep layers. It can be seen that the activity is more sustained in the deep layers. (B) Laminar profile of the figure-ground modulation, i.e. the difference in activity evoked by the figure and the background (left) and the edge and the background (right). The average activity across the layers is shown in the panel above and the figure-ground modulation in red. Right panels, the average d′ values during the sustained response phase (80–300 ms) in the different layers.
Figure 6
Figure 6
Analysis of the CSD. (A) left, CSD profile evoked by the background stimulus. Sinks are shown in warm colors and sources in cool colors, the values are in μV/cm2. The boundary between layer 4 and 5 was determined as the lower border of the early sink with a clear reversal visible at the depth marked as 0. Right, we determined the significance of the sinks and sources using a method based on clustering t-tests (see Methods). Significant (p < 0.05) sinks are shown in warm colors and significant sources in cool colors, the color indicates t-value. All sinks and sources that are visible in the left panel turned out to be significant. (B) Difference in the CSD profile evoked by the figure and the background. Note that the figure is associated with an extra sink in layer 2/3 that coincides with the increase in spiking activity. (C) The difference in the CSD between the edge and the background. The laminar profile is similar to that in panel B, but the edge elicits a slightly stronger sink in layer 2/3. (D) Laminar CSD profile evoked by the grating stimulus with a grey hole at the RF location. Note the initial sink in layer 5, which is followed by a CSD profile that resembles the one in panel B.

References

    1. Self MW, Kooijmans RN, Supèr H, Lamme VA, Roelfsema PR. Different glutamate receptors convey feedforward and recurrent processing in macaque V1. Proc. Natl. Acad. Sci. USA. 2012;109:11031–6. doi: 10.1073/pnas.1119527109. - DOI - PMC - PubMed
    1. Lamme V. The Neurophysiology of Figure-Ground Segregation in Primary Visual Cortex. J. Neurosci. 1995;15:1605–1615. doi: 10.1523/JNEUROSCI.15-02-01605.1995. - DOI - PMC - PubMed
    1. Poort J, et al. The role of attention in figure-ground segregation in areas V1 and V4 of the visual cortex. Neuron. 2012;75:143–56. doi: 10.1016/j.neuron.2012.04.032. - DOI - PubMed
    1. Zipser K, Lamme VA, Schiller PH. Contextual modulation in primary visual cortex. J. Neurosci. 1996;16:7376–89. doi: 10.1523/JNEUROSCI.16-22-07376.1996. - DOI - PMC - PubMed
    1. Scholte HS, Jolij J, Fahrenfort JJ, Lamme VAF. Feedforward and Recurrent Processing in Scene Segmentation: Electroencephalography and Functional Magnetic Resonance Imaging. Nat. Nat. J. Neurosci. 2008;20:492–496. - PubMed

Publication types