. 2018 Dec 12;8(1):17781.
doi: 10.1038/s41598-018-36062-3.

Rapid detection of metastatic lymph nodes of colorectal cancer with a gamma-glutamyl transpeptidase-activatable fluorescence probe

Affiliations

Rapid detection of metastatic lymph nodes of colorectal cancer with a gamma-glutamyl transpeptidase-activatable fluorescence probe

Hidemasa Kubo et al. Sci Rep. .

Abstract

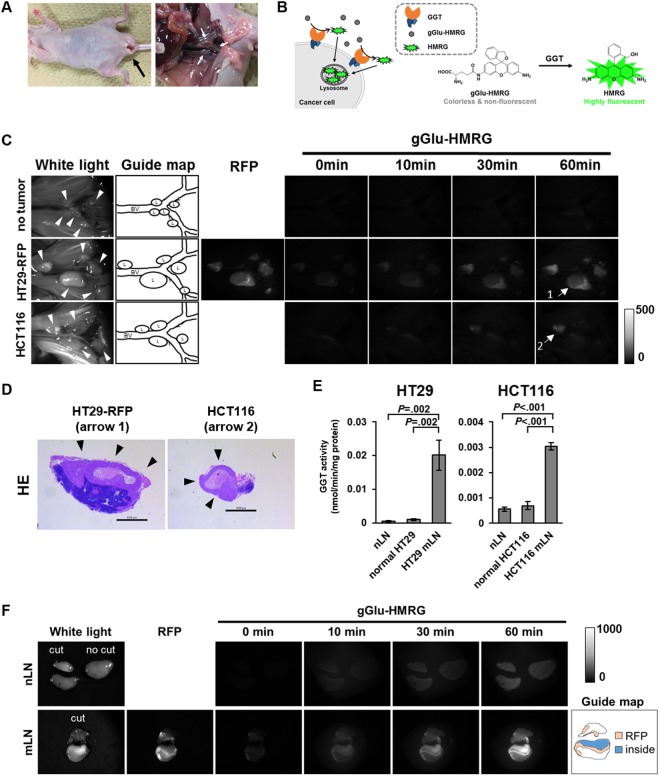
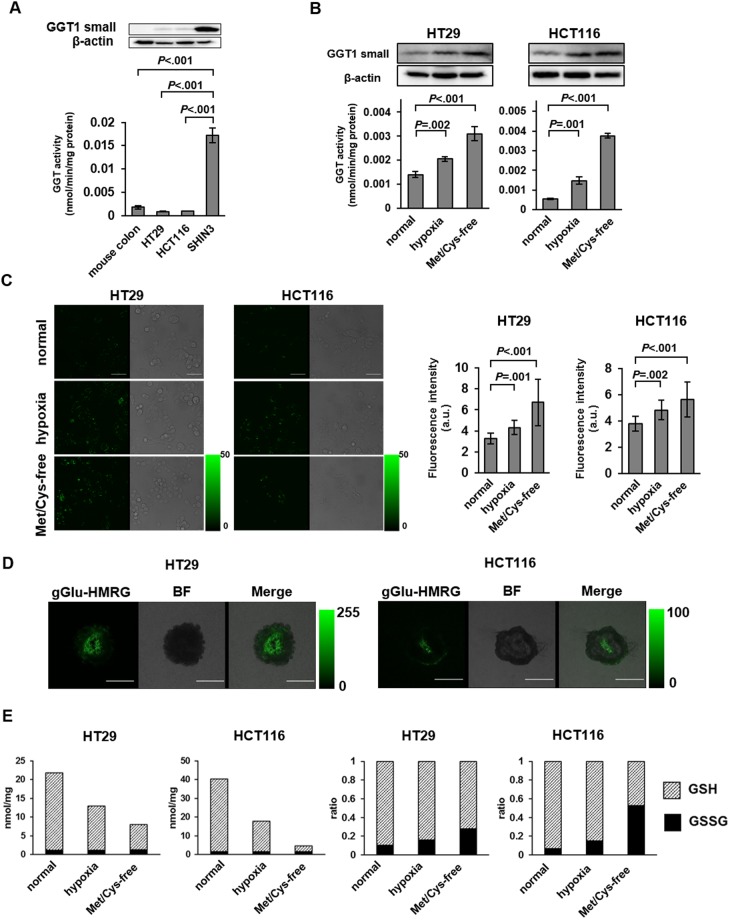
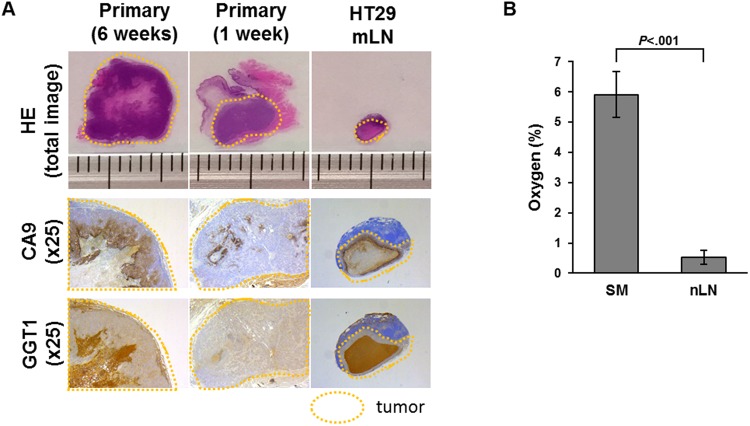
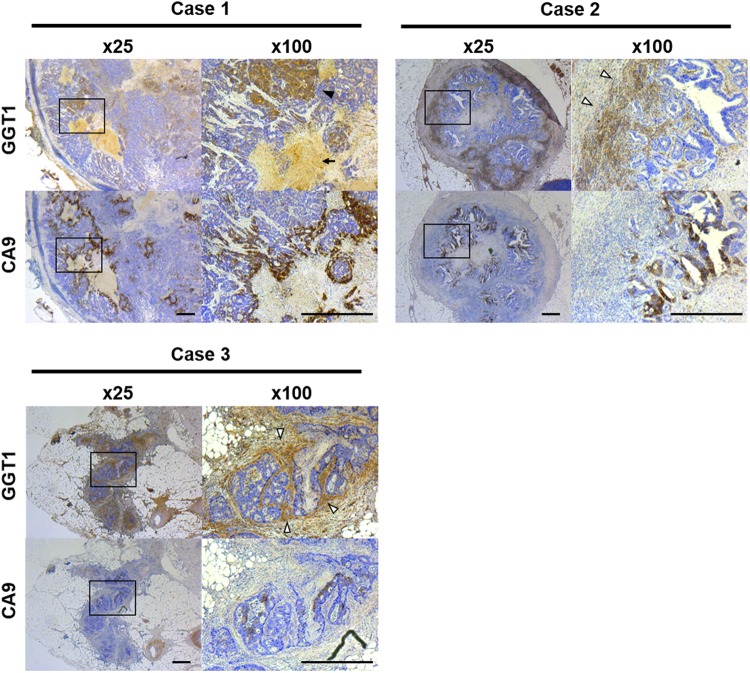
Rapid diagnosis of metastatic lymph nodes (mLNs) of colorectal cancer (CRC) is desirable either intraoperatively or in resected fresh specimens. We have developed a series of activatable fluorescence probes for peptidase activities that are specifically upregulated in various tumors. We aimed to discover a target enzyme for detecting mLNs of CRC. Among our probes, we found that gGlu-HMRG, a gamma-glutamyl transpeptidase (GGT)-activatable fluorescence probe, could detect mLNs. This was unexpected, because we have previously reported that gGlu-HMRG could not detect primary CRC. We confirmed that the GGT activity of mLNs was high, whereas that of non-metastatic lymph nodes and CRC cell lines was low. We investigated the reason why GGT activity was upregulated in mLNs, and found that GGT was induced under conditions of hypoxia or low nutritional status. We utilized this feature to achieve rapid detection of mLNs with gGlu-HMRG. GGT appears to be a promising candidate enzyme for fluorescence imaging of mLNs.


Conflict of interest statement

The authors declare no competing interests.

Figures

Figure 1
Figure 1
The GGT activity was upregulated in mLNs of CRC in model mouse. By utilizing this property, mLNs could be visualized with gGlu-HMRG in vivo and ex vivo. (A) Mouse model of para-aortic lymph node metastasis. The black arrow shows the primary tumor. White arrows show para-aortic lymph nodes. (B) Proposed mechanism of gGlu-HMRG activation and retention. gGlu-HMRG reacts with GGT in the plasma membrane of cells, generating the highly fluorescent product HMRG, which accumulates in lysosomes in the cells. (C,D) Lymph-node images of tumor-free mouse and the mouse model are shown. White light and RFP images were captured before application of gGlu-HMRG. Time-lapse images are shown after topical application of gGlu-HMRG. White arrowheads show lymph nodes. HE staining (arrows 1 and 2) shows that the lymph nodes detected by gGlu-HMRG are mLNs. Black arrowheads indicate metastatic lesions. BV: blood vessel, L: lymph node. Scale bar, 1000 μm. (E) GGT activity of whole tissue lysate of mLNs compared with normal cultured cells and nLNs (n = 3). Error bars represent SD. (F) Ex vivo imaging of nLN and mLN of HT29-RFP (cut surface) are shown. White light and RFP images were captured before application of gGlu-HMRG. Time-lapse images are shown after topical application of gGlu-HMRG. For the study of mLNs (C and F), we used a fluorescence stereoscopic microscope. For imaging of RFP, we used a G filter set (excitation filter 546/10 nm, barrier filter 590 nm long-pass). For imaging of gGlu-HMRG, we used a GFP3 filter set (excitation filter 470/40 nm, barrier filter 525/50 nm). mLNs: metastatic lymph nodes, nLNs: non-metastatic lymph nodes, GGT: gamma-glutamyl transpeptidase, HE: hematoxylin-eosin.
Figure 2
Figure 2
Study of the primary tumor in the mouse model. GGT activity of the inside of tumor was higher than the outside and normal cultured cells. (A) The locations ‘inside’ and ‘outside’ the tumor are shown. Comparison of HT29 primary tumor and mouse normal colon. White light and 540 nm fluorescence images, captured 30 min after application of gGlu-HMRG, are shown. (B) GGT activity of lysate of normal cultured cells, and the outside and inside of the tumor (n = 3). Error bars represent SD.
Figure 3
Figure 3
The GGT activity levels in colorectal cancer cell lines and mouse normal colon were lower than that of ovarian cancer cell line which is a positive control of GGT-expressing cell. The GGT activity and expression level of cell lines were upregulated in cells cultured under hypoxic and low nutritional conditions. In both hypoxic and low nutritional conditions, GSH decreased and GSSG increased, indicating that the cells were exposed to oxidative stress. (A) Comparison of GGT activity in mouse normal colon, HT29 cells, HCT116 cells, and ovarian cancer cell line SHIN3 as a positive control (n = 3). Error bars represent SD. Blots were cropped from different membrane divided after transfer. (B) Comparison of GGT activity and expression among CRC cell lines cultured under normal, hypoxic and Met/Cys-free conditions (n = 3). Error bars represent SD. In western blots, we detected GGT1 firstly, and then detected β-actin from the same membrane. (C) Live-cell fluorescence imaging of CRC cell lines cultured under normal, hypoxic and Met/Cys-free conditions with gGlu-HMRG. Scale bar, 50 μm. Average fluorescence intensity of ten cells selected at random are shown (n = 10). Error bars represent SD. (D) Fluorescence imaging of spheroids with gGlu-HMRG. Scale bar, 500 μm. (E) Measurement of GSH and GSSG in CRC cell lines cultured under normal, hypoxic and Met/Cys-free conditions. Absolute concentration was measured in lysate at 0.5 mg/ml protein concentration (n = 3). GSH: reduced glutathione, GSSG: oxidized glutathione.
Figure 4
Figure 4
HE staining and immunohistochemistry (CA9 and GGT1) of fixed primary tumor and mLN specimens from orthotopic mouse model. CA9 and GGT1 were expressed inside the primary tumor and in mLNs. GGT1 was accumulated in the area of central necrosis. HE: hematoxylin-eosin.
Figure 5
Figure 5
Comparison between primary tumor and mLNs of the mouse model. Expression of CA9 and GGT1 in mLNs was higher than that in the primary tumor at 1week after injection of cells. (A) CA9 and GGT1 expression of HT29 mLNs compared to primary tumor at 6 weeks or 1 week after injection of cells. (B) Tissue oxygen concentration (%) of rectal submucosa (SM) and nLNs (n = 3). Error bars represent SD. mNs: metastatic lymph nodes, nLNs: non metastatic lymph nodes.
Figure 6
Figure 6
Representative human colorectal cancer specimen. Immunohistochemistry of CA9 and GGT1 in mLNs. In these cases, both CA9 and GGT1 were expressed, suggesting that GGT1 expression is related to hypoxia in mLNs. Scale bar, 500 μm. Black arrowheads: GGT of cancer cells, white arrowheads: GGT surrounding cancer cells, arrow: accumulation of GGT. mLNs: metastatic lymph nodes, GGT: gamma-glutamyl transpeptidase.

References

    1. Jemal A, et al. Global cancer statistics. CA-Cancer J Clin. 2011;61:69–90. doi: 10.3322/caac.20107. - DOI - PubMed
    1. Watanabe T, et al. Japanese Society for Cancer of the Colon and Rectum (JSCCR) guidelines 2016 for the treatment of colorectal cancer. Int J Clin Oncol. 2018;23:1–34. doi: 10.1007/s10147-017-1101-6. - DOI - PMC - PubMed
    1. Bipat S, et al. Rectal cancer: local staging and assessment of lymph node involvement with endoluminal US, CT, and MR imaging—a meta-analysis. Radiology. 2004;232:773–783. doi: 10.1148/radiol.2323031368. - DOI - PubMed
    1. Kantorová I, et al. Routine 18F-FDG PET preoperative staging of colorectal cancer: comparison with conventional staging and its impact on treatment decision making. J Nucl Med. 2003;44:1784–1788. - PubMed
    1. Fisher ER, et al. Detection and significance of occult axillary node metastases in patients with invasive breast cancer. Cancer. 1978;42:2025–2031. doi: 10.1002/1097-0142(197810)42:4<2025::AID-CNCR2820420452>3.0.CO;2-J. - DOI - PubMed

Publication types

Substances