. 2018 Dec;564(7736):434-438.
doi: 10.1038/s41586-018-0794-7. Epub 2018 Dec 12.

The translation of non-canonical open reading frames controls mucosal immunity

Affiliations

The translation of non-canonical open reading frames controls mucosal immunity

Ruaidhrí Jackson et al. Nature. 2018 Dec.

Abstract

The annotation of the mammalian protein-coding genome is incomplete. Arbitrary size restriction of open reading frames (ORFs) and the absolute requirement for a methionine codon as the sole initiator of translation have constrained the identification of potentially important transcripts with non-canonical protein-coding potential1,2. Here, using unbiased transcriptomic approaches in macrophages that respond to bacterial infection, we show that ribosomes associate with a large number of RNAs that were previously annotated as 'non-protein coding'. Although the idea that such non-canonical ORFs can encode functional proteins is controversial3,4, we identify a range of short and non-ATG-initiated ORFs that can generate stable and spatially distinct proteins. Notably, we show that the translation of a new ORF 'hidden' within the long non-coding RNA Aw112010 is essential for the orchestration of mucosal immunity during both bacterial infection and colitis. This work expands our interpretation of the protein-coding genome and demonstrates that proteinaceous products generated from non-canonical ORFs are crucial for the immune response in vivo. We therefore propose that the misannotation of non-canonical ORF-containing genes as non-coding RNAs may obscure the essential role of a multitude of previously undiscovered protein-coding genes in immunity and disease.


Figures

Extended Data Figure 1:
Extended Data Figure 1:. RiboTag RNA Isolation and mRNA Expression
a) Nanodrop analysis of Ribosome associated RNA isolated from RiboTag and RiboTagLysm mice showing no detected RNA isolated from WT BMDMs. b) Bioanalyzer traces and RNA Integrity Number (RIN) of ribosome associated RNA isolated from BMDMs from RiboTagLysM mice non-treated (NT) or stimulated with LPS for 6 and 24 hours. c) qPCR analysis of ribosome associated transcripts of non-treated (NT) BMDMs, stimulated with LPS (10 ng/ml) or infected with S. Typhimurium at an MOI of 1 for 6 hr. Data is presented as SEM from 6 biological replicates.
Extended Data Figure 2:
Extended Data Figure 2:. Ribosome Profiling, RNAseq Read Tracing and RibORF Analysis
a-d) WT BMDMs were non-treated (NT) or stimulated with LPS (10 ng/ml) for 6 hr and ribosome profiling conducted. Data is representative of 2 biological replicates a) Pattern of RNAseq transcriptional reads (red) and Riboprofiling translational reads (blue) for IL12b from NT (upper trace) and LPS stimulated (lower trace) BMDMs. The gene structure of Il12b is located in the center, with a very thin blue line representing the introns and wide blue rectangles indicating exonic structure. Thinner exonic structures represent annotated 5ʹ and 3’ UTRs. b) Pattern of RNAseq transcriptional reads (red) and Riboprofiling translational reads (blue) for a Non-RiboTag identified lncRNA, A130088B15rik, from NT (upper trace) and LPS stimulated (lower trace) BMDMs. The gene structure of A130088B15rik is located in the center, with a thin blue line representing the introns and wide blue rectangles indicating exonic structure. c) Pattern of RNAseq transcriptional reads (red) and Riboprofiling translational reads (blue) for a RiboTag identified lncRNA, Aw112010, from NT (upper trace) and LPS stimulated (lower trace) BMDMs. The gene structure of Aw112010 is located in the center, with a thin blue line representing the introns and wide blue rectangles indicating exonic structure. d) RibORF analysis of read distribution (reads/million mappable reads; RPM) around start and stop codons of known, annotated protein coding genes in steady state and LPS stimulated samples.
Extended Data Figure 3:
Extended Data Figure 3:. Breakdown of Different Analytical approaches to Predict Protein Coding lncRNAs
a) RiboCode analysis of ribosome profiling data identifies 85 ORFs within lncRNAs with protein coding potential b) Comparison of non-canonical ORFs identified by RibORF, Ribosome Release Score and Translation Efficiency (RRS+TE+) and RiboCode analytical strategies from BMDM expressing lncRNA using ribosome profiling. c) WT BMDMs were non-treated or stimulated with LPS (10 ng/ml) for 6 hr and ribosome profiling conducted. Data is representative of 2 biological replicates. Volcano plot of LPS induced differentially regulated genes identified by RibORF, RiboCode and RRS+TE analysis.
Extended Data Figure 4:
Extended Data Figure 4:. Overexpression of Non-Canonical ORFs Reveals Distinct Subcellular Localization
a) HEK293 cells were transfected with 500 ng of flag-tagged plasmids encoding the non-canonical ORFs for GM7160 and GM9895. Cells were fixed and stained with DAPI (blue, nucleus), Phalloidin (red, cytoskeletal F-actin) and anti-flag (green, ORF of interest). Confocal microscopy was conducted at 60x and 100x objectives, as indicated. Data are representative of at least 3 independent experiments.
Extended Data Figure 5:
Extended Data Figure 5:. Aw112010HA Mouse Characterization
a) Schematic representation of Aw112010HA knock in mice. b) Genotyping for Aw112010HA mice from CRISPR/Cas9 injections c) Sequence information for GGSG(x3)-HA Tag insertion used to generate Aw112010HA mice. d) WT and AW112010HA BMDMs were left untreated or stimulated with LPS (10 ng/ml) for 6hrs. Protein lysates were generated and were incubated overnight with anti-HA magnetic beads. Purified lysates were probed for HA by western blot. Whole cell lysates were used as a loading control and probed for β-tubulin. Data is representative of 3 independent experiments.
Extended Data Figure 6:
Extended Data Figure 6:. Mass Spec Validation of the Aw112010 ORF
a) MS/MS fragmentation of an endogenous peptide from Aw112010 found in LPS stimulated macrophages after HA IP purification. Identified fragment ions (b and y-ions, red) are indicated above and below the peptide sequence. b) Aw112010 predicted protein sequence. Peptides detected by mass spec are highlighted in red and blue. c) Mass Spec information for the identified fragments displayed in Fig 2h.
Extended Data Figure 7:
Extended Data Figure 7:. Characterization of Aw112010Stop Mice
a) Schematic representation of Aw112010HA knock in mice. b) Genotyping for Aw112010Stop mice generated using CRISPR/Cas9. c) Sanger sequencing of the frameshifting Stop Codon insertion in Aw112010Stop Mice and WT controls. d) Sequence of frameshifting stop insertion. Stop codons and frame positions are indicated below the sequence.
Extended Data Figure 8:
Extended Data Figure 8:. Cytokine Production in WT and Aw112010Stop macrophages and mice
a-c) WT and Aw112010Stop BMDMs were stimulated with LPS for indicated times and supernatants were analyzed for IL-12p40, IL-6 and IL-10 by ELISA. Data is from 6 biological replicates conducted over 2 independent experiments. d) Mice were administered PBS (n=5) or LPS (n=6, WT and Aw112010Stop) (10 mg/kg) for 6 hr via intraperitoneal injection. Serum was analyzed for IL-6 by ELISA. SEM of replicates is presented for ELISA and qPCR data and significance determined by unpaired two-tailed t-tests, (*p<0.05; **p<0.01; ***p<0.001; ****p<0.0001).
Extended Data Figure 9:
Extended Data Figure 9:. The Aw112010 Protein is required for IL-12-40 Production
a-c) Predicted protein structure of the Aw112010 non-canonical ORF encoded protein generated using Quark Package. Aw112010 is predicted to contain a single transmembrane domain. d) BMDMs were subjected to electroporation with indicated plasmids. BMDMs were stimulated with LPS (10 ng/ml) for 6 hr. Supernatants were analyzed for IL-12p40 production by ELISA. Data is of 3 biological replicates. Statistical significance was determined by unpaired two-tailed t tests. Significance indicated by ***p<0.001.
Figure 1:
Figure 1:. Bacterial Infection Drives Widespread Ribosomal Association with “Non-Coding RNAs”
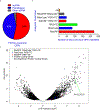
a-f) BMDMs from RiboTagLysM mice were non-treated (NT) or stimulated with LPS (1 ng/ml). RNA was subjected to RNAseq. Data is presented as a combination of 2 independent biological replicates. a) Circos plot shows differentially expressed (Log2FC) ribosome associated transcripts upon LPS 6 and 24 hr stimulation with red depicting upregulation and blue downregulation. Each track from the periphery to the core represents: chromosomes location; 12,820 known protein coding transcripts; 1,176 lncRNAs; 1,107 pseudogenes; and 413 other non-coding RNA. b) Pie chart of percentage breakdown of protein coding gene annotated from RiboTag RNAseq (fpkm ≥ 1). c) The exploded “non-protein coding” are further classified. d) Stratification of detectable BMDM lncRNAs based upon ribosome association. Ribosome associated lncRNA with an fpkm of ≥1 in RiboTag RNAseq are represented in the red exploded section. Blue section depicts lncRNAs not found in RiboTag RNAseq, but with an fpkm of ≥ 0.01 in conventional RNAseq. e) Volcano plot and f) heatmap analysis of lncRNAs associated with ribosomes after LPS stimulated in BMDMs. g) qPCR analysis of ribosome associated transcripts of non-treated BMDMs or stimulated with LPS (10 ng/ml) or infected with S. Typhimurium at an MOI of 1 for 6 hr. Data is presented as 6 biological replicates and fold expression calculated from each individual NT sample h) RiboTagLysM mice were gavaged with 2×10⁸ CFU of S. Typhimurium. After 24 hr, colonic tissue was extracted and lysed. Macrophage ribosome associated RNA was isolated and qPCR analysis conducted. Data is presented as 7 biological replicates. g-h) SEM of replicates is present for qPCR data and significance determined by unpaired two-tailed t-tests, (**p<0.01; ***p<0.001; ****p<0.0001).
Figure 2:
Figure 2:. LPS Triggers Genome Wide Differential Translation of Non-Canonical ORFs in lncRNAs
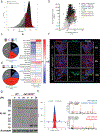
a-e) WT BMDMs were non-treated or stimulated with LPS (10 ng/ml) for 6 hr and ribosome profiling conducted. Data is representative of 2 biological replicates. a) Percentage of Maximum Entropy (PME) values for protein coding genes and lncRNAs. ≥ 0.6% PME cutoff represents transcripts considered protein coding. b) Translation efficiency (TE) and ribosome release score (RRS) analysis was conducted on RiboProfiling identified transcripts. Purple broken lines represent the 95th percentile of the 3ʹ UTRs of known protein coding genes and discriminates coding and non-coding transcripts. c) Categorization of start codon usage and d) ORF size in RibORF and/or RiboCode identified lncRNAs with coding RRS+TE+ values. e) Heatmap of top significantly LPS differentially regulated lncRNA ORFs. f) HEK293 cells transfected with empty vector (EV) or Aw112010FLAG ORF. Cells were stained with DAPI, Phalloidin and anti-FLAG. Confocal microscopy was conducted at 60x and 100x objectives. g) WT and Aw112010HA BMDMs were untreated and stimulated with LPS (10 ng/ml), protein lysates generated and western blot conducted for HA and β-tubulin. Data is representative of 3 biological replicates. h) Aw112010HA BMDMs were generated, stimulated with LPS for 6 hr and subjected to HA-immunoprecipitation. Purified lysates were subject to mass spec analysis. Precursor ion peaks in the MS1 extracted ion chromatogram corresponding to a spiked in synthetic isotopically labeled peptide standard (top) and co-elution of a peak consistent with the endogenous Aw112010 peptide (bottom) in the same sample. Identified fragment ions (b and y-ions, red) are indicated above and below the peptide sequence. Data is representative of 2 biological replicates.
Figure 3:
Figure 3:. Translation of the Non-Canonical Aw112010 Encoded ORF is Essential for Mucosal Immunity
a-e) WT (n=10) and Aw112010Stop (n=11) mice were administered Streptomycin (20mg) by oral gavage 24 hr prior to S. Typhimurium infection (1×10³ Colony Forming Units (CFU). a) Weight loss was measured post infection. b) Enumeration of S. Typhimurium CFUs present in feces of WT and Aw112010Stop mice 24 hr post infection. c) Enumeration of S. Typhimurium CFUs in the cecum of WT and Aw112010Stop mice 96 hr post infection. d) Enumeration of S. Typhimurium CFUs in the liver and e) spleen of WT and Aw112010Stop mice 96 hr post infection. f) Confocal immunostaining of macrophages (F4/80, Green), B cells (B220, Purple), Salmonella (anti-Salmonella, Red) in the spleens of WT and Aw112010Stop mice infected with 1×10² CFUs of S. Typhimurium 72 hr post gavage. Representative of 3 independent biological replicates Original magnification 60x. g) Survival curve analysis of WT (n=10) and Aw112010Stop (n=10) infected with 1×10² CFU via oral gavage. h, i) WT and Aw112010Stop cohoused littermate mice were administered 2.5% DSS in their drinking water for 5 days. h) Weight loss from WT (n=11) and Aw112010Stop (n=12) Weight loss was measured over 12 days. j) Colon length was measured from WT (n=10) and Aw112010Stop (n=12). SEM of replicates is presented for weight loss and colon length data and statistical significance determined by unpaired two tailed t tests. Bacterial CFU data is presented SEM in log scale and statistical significance determined by nonparametric Mann-Whitney test. Survival curve statistical analysis was determined by a Log-rank test. Significance indicated by *p<0.05; **p<0.01; ***p<0.001; ****p<0.0001.
Figure 4:
Figure 4:. Translation of the Aw112010 Non-Canonical ORF Encoded Protein is required for IL-12 production
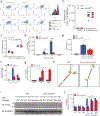
a) BMDMs were pretreated with CytochalasinD (CD) (10 μM) for 1 hr, LPS (10 ng/ml) for 6 hr or non-treated (NT). pHrodo BioParticles were administered for 1 hr and cells assessed for Cd11b and pHrodo. Plots are representative of 3 independent experiments. b) BMDMs were infected with S. Typhimurium for 6 hr. Cells were lysed and colony forming units enumerated (CFUs). c) BMDMs were pretreated with LPS (100 ng/ml) for 5 hr and infected with a S. Typhimurium for 1 hr and LDH release measured. d) BMDMs were stimulated with LPS (10 ng/ml). qPCR was conducted for Il12b expression. e) Mice were administered PBS (n=5) or LPS (n=6, WT and Aw112010Stop) (10 mg/kg) for 6 hr via intraperitoneal injection. Serum was analyzed for IL-12p40 by ELISA. f) BMDMs were stimulated with LPS (10 ng/ml). qPCR conducted for Aw112010 expression. g) WT and Aw112010Stop BMDMs were treated with cycloheximide (50 μg/ml) or non-sense mediated decay inhibitor (iNMD) (50 μM) for 6 hr. qPCR was conducted for Aw112010. Fold expression was calculated from each individual replicates vehicle sample h) Predicted RNA folding of Aw112010 mRNA (WT) and a mutant Aw112010 transcript (Mut). i, j) BMDMs were subjected to electroporation with indicated plasmids. BMDMs were stimulated with LPS (10 ng/ml) for 6 hr. i) Western blot conducted for Aw112010-Flag and β-tubulin. j) qPCR was conducted for Il12b mRNA. Where applicable all data is presented as SEM. b, c) Data is from 3 independent experiments conducted with 3 biological and 3 technical replicates. d) Data is of 3 biological replicates and fold expression calculated from a WT NT sample. f,g) Data is from 4 independent experiments. i-j) Data is of 3 biological replicates. j) Fold expression is calculated from a single WT EV NT replicate for WT cells and a single Aw112010Stop EV NT replicate for Aw112010Stop cells. Statistical significance was determined by unpaired two-tailed t tests. Significance indicated by *p<0.05; **p<0.01; ***p<0.001; ****p<0.0001.

References

    1. Couso JP & Patraquim P Classification and function of small open reading frames. Nat Rev Mol Cell Biol 18, 575–589, doi:10.1038/nrm.2017.58 (2017). - DOI - PubMed
    1. Kozak M Regulation of translation in eukaryotic systems. Annu Rev Cell Biol 8, 197–225, doi:10.1146/annurev.cb.08.110192.001213 (1992). - DOI - PubMed
    1. Guttman M, Russell P, Ingolia NT, Weissman JS & Lander ES Ribosome profiling provides evidence that large noncoding RNAs do not encode proteins. Cell 154, 240–251, doi:10.1016/j.cell.2013.06.009 (2013). - DOI - PMC - PubMed
    1. Ingolia NT, Lareau LF & Weissman JS Ribosome profiling of mouse embryonic stem cells reveals the complexity and dynamics of mammalian proteomes. Cell 147, 789–802, doi:10.1016/j.cell.2011.10.002 (2011). - DOI - PMC - PubMed
    1. Hoagland MB, Stephenson ML, Scott JF, Hecht LI & Zamecnik PC A SOLUBLE RIBONUCLEIC ACID INTERMEDIATE IN PROTEIN SYNTHESIS. Journal of Biological Chemistry 231, 241–257 (1958). - PubMed

Publication types

MeSH terms