. 2019 Jan;565(7739):318-323.
doi: 10.1038/s41586-018-0804-9. Epub 2018 Dec 12.

Structural basis of coreceptor recognition by HIV-1 envelope spike

Affiliations

Structural basis of coreceptor recognition by HIV-1 envelope spike

Md Munan Shaik et al. Nature. 2019 Jan.

Abstract

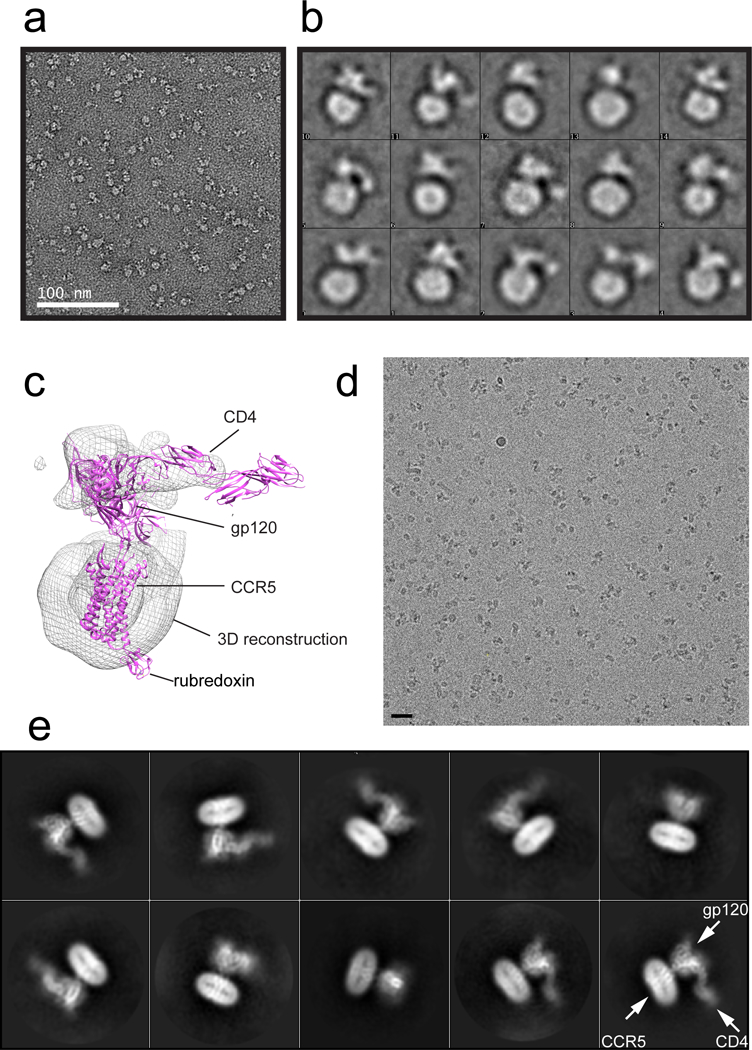
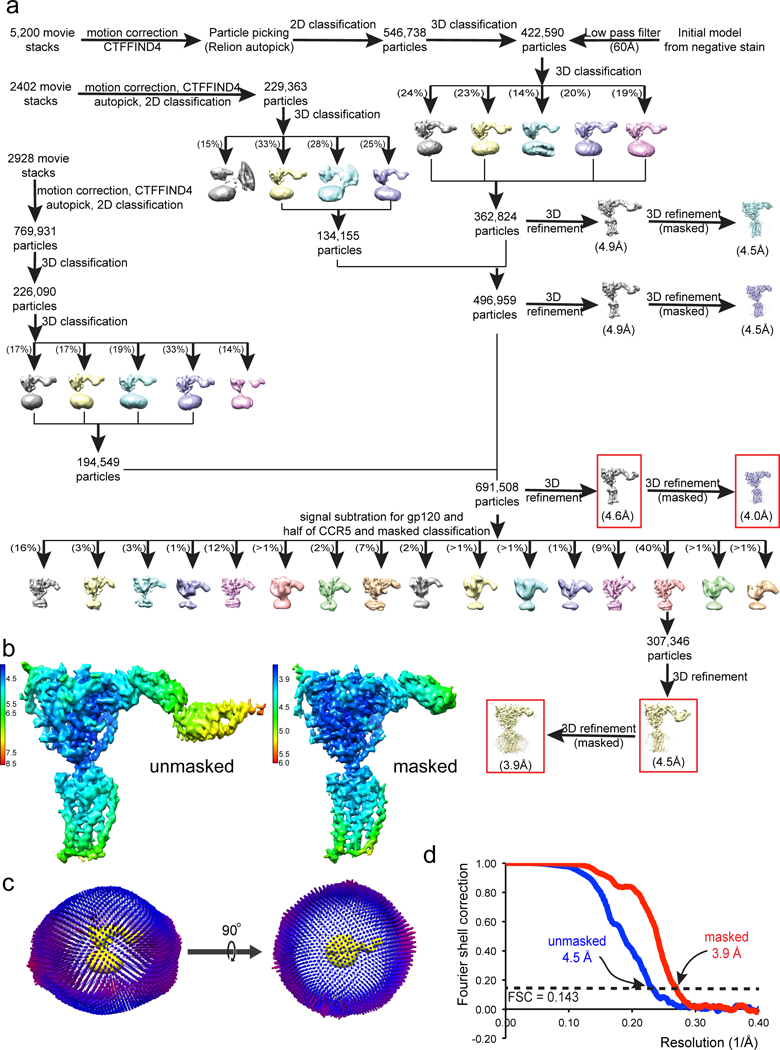
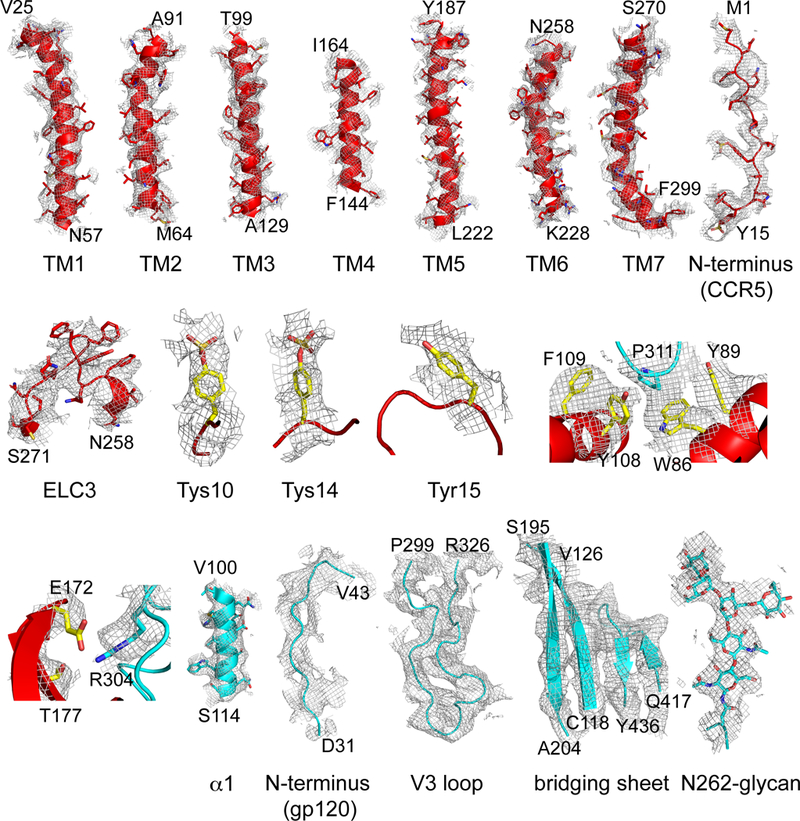
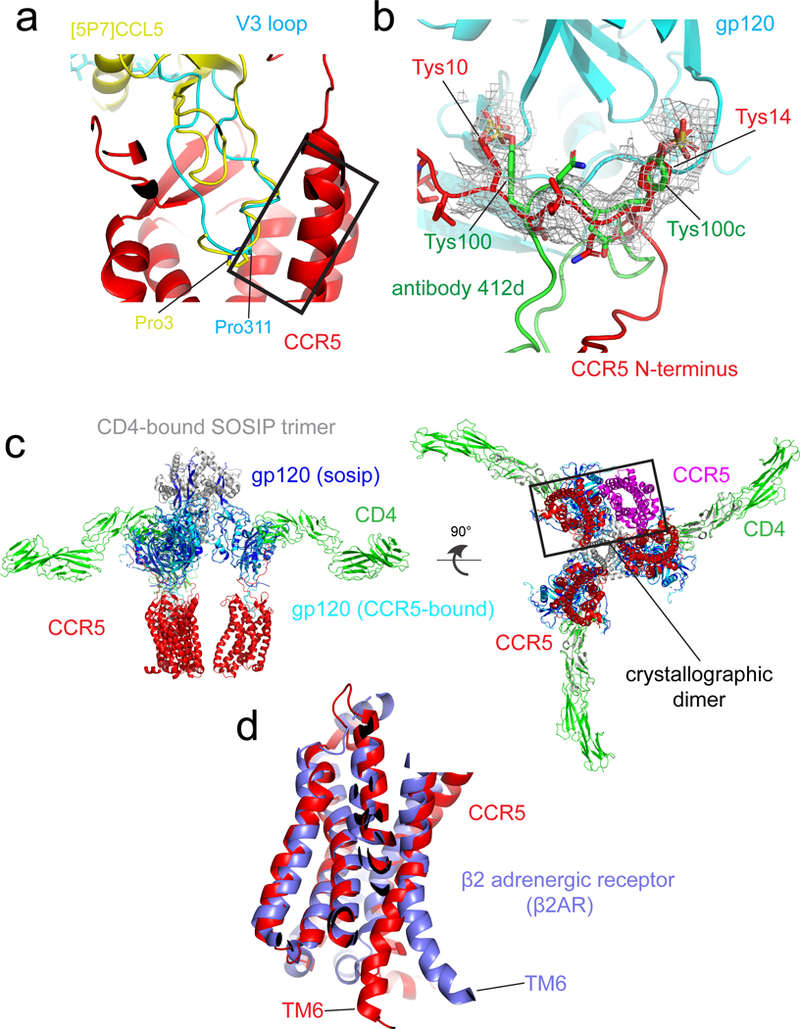
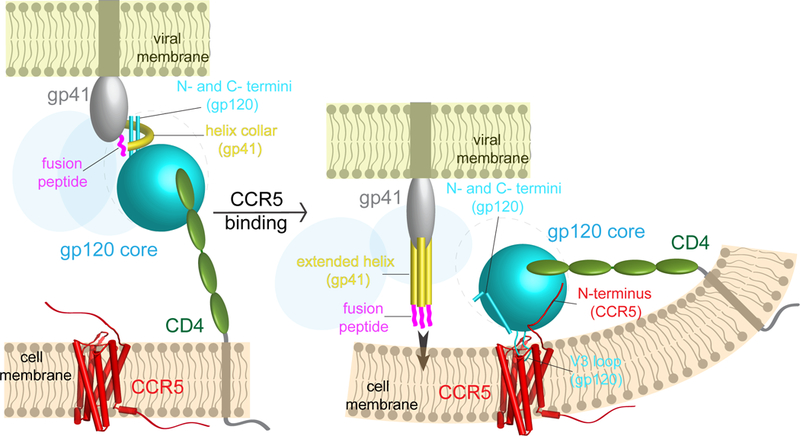
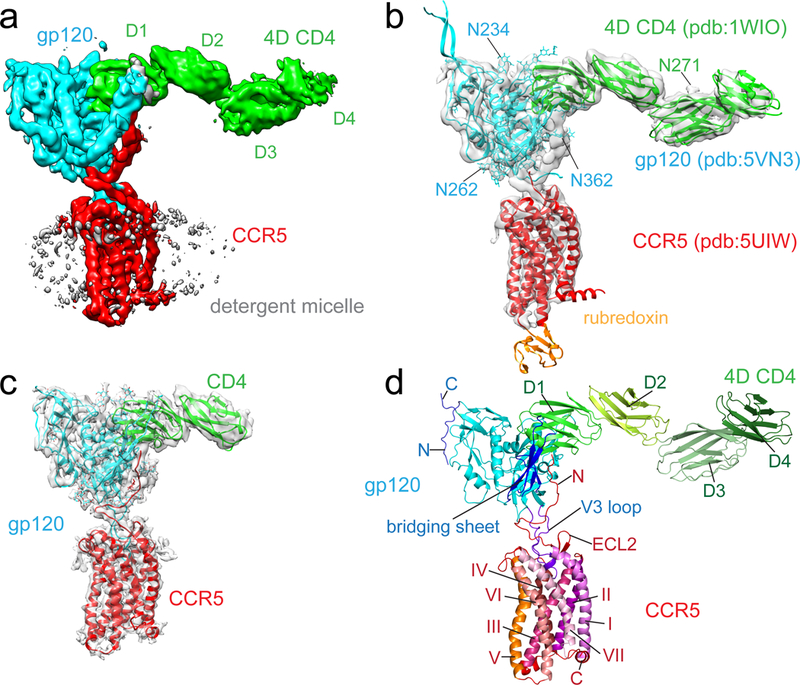
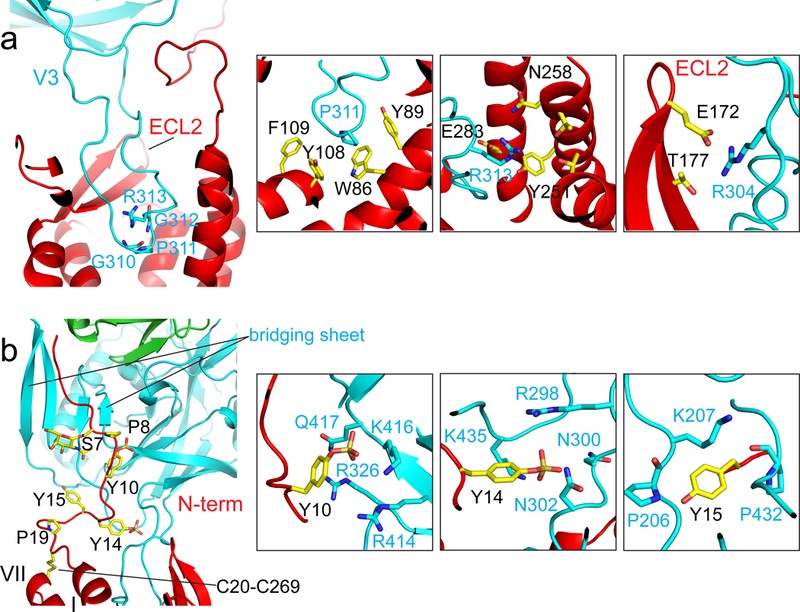
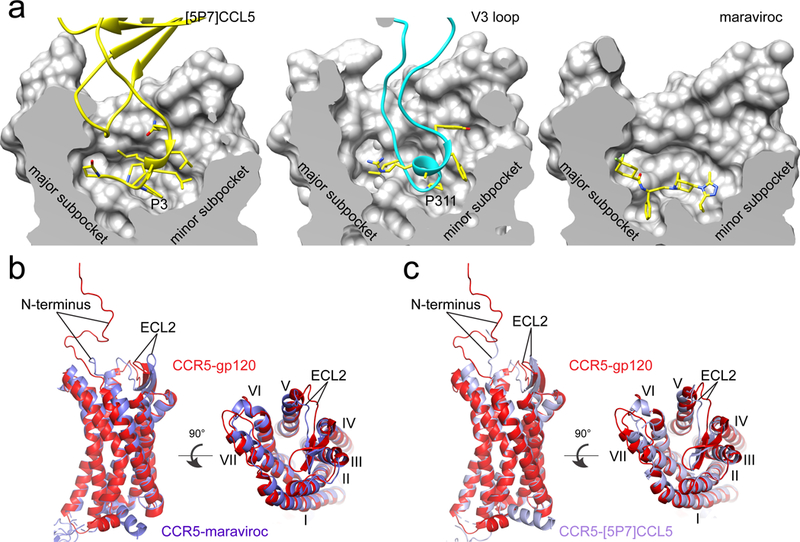
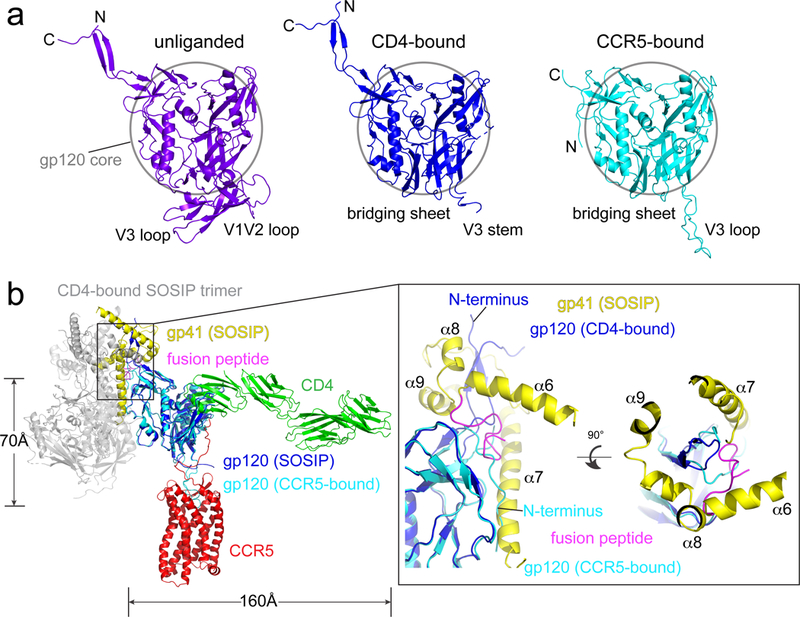
HIV-1 envelope glycoprotein (Env), which consists of trimeric (gp160)3 cleaved to (gp120 and gp41)3, interacts with the primary receptor CD4 and a coreceptor (such as chemokine receptor CCR5) to fuse viral and target-cell membranes. The gp120-coreceptor interaction has previously been proposed as the most crucial trigger for unleashing the fusogenic potential of gp41. Here we report a cryo-electron microscopy structure of a full-length gp120 in complex with soluble CD4 and unmodified human CCR5, at 3.9 Å resolution. The V3 loop of gp120 inserts into the chemokine-binding pocket formed by seven transmembrane helices of CCR5, and the N terminus of CCR5 contacts the CD4-induced bridging sheet of gp120. CCR5 induces no obvious allosteric changes in gp120 that can propagate to gp41; it does bring the Env trimer close to the target membrane. The N terminus of gp120, which is gripped by gp41 in the pre-fusion or CD4-bound Env, flips back in the CCR5-bound conformation and may irreversibly destabilize gp41 to initiate fusion. The coreceptor probably functions by stabilizing and anchoring the CD4-induced conformation of Env near the cell membrane. These results advance our understanding of HIV-1 entry into host cells and may guide the development of vaccines and therapeutic agents.


Figures

Extended Data Figure 1.
Extended Data Figure 1.. Known structures of CCR5 and CXCR4.
CCR5 and CXCR4 were identified as the coreceptors for HIV-1 entry in 1996-. (a)-(b) Crystal structures of a modified CCR5 (ΔC224-N226→rubredoxin; ΔF320-L352; and point mutations C58Y, G163N, A233D, K303E) in complex with HIV entry inhibitor maraviroc (pdb ID: 4MBS; ref) and a modified chemokine [5P7]CCL5 (an antagonist; pdb ID: 5UIW; ref). CCR5 is shown in ribbon diagram in blue, the internally fused rubredoxin in magenta and the ligands in yellow. N-terminus (N), C-terminus (C) and the second extracellular loop (ECL2) are indicated. (c)-(e) Crystal structures of an engineered CXCR4 in complex with a viral chemokine antagonist vMIP-II (pdb ID: 4RWS; ref), a small molecule antagonist IT1t (pdb ID: 3ODU; ref) and a cyclic peptide antagonist CVX15 (pdb ID: 3OE0; ref). CXCR4 is shown in green, the fused T4 lysozyme in magenta and the ligands in yellow. N, N-terminus; C, C-terminus; and ECL2, the second extracellular loop.
Extended Data Figure 2.
Extended Data Figure 2.. Characterization of stable 293 cell lines expressing wildtype human CCR5.
(a) Chemokine receptor assay. 293T and 293T-CCR5 (stable) cells were treated with different concentrations of CCL5/RANTES. Ft/F0 is a fluorescence-signal ratio proportional to that of intracellular cAMP concentration at 40 min post CCL5/RANTES-activation and time 0. The dose response curves were plotted for both 293T (black) and 293T-CCR5 (red) cells. The experiment was carried out in quadruplicate and repeated at least three times with similar results. Error bars indicate the standard deviation calculated by the Excel STDEV function. (b) Flow cytometry histograms of HIV-1 gp120 binding to CCR5 expressed on the cell surfaces in the absence (orange) or presence (red) of soluble CD4. 293T cells (black), CCR5-expressing cells only (gray) and CCR5-expressing cells with soluble CD4 only (blue) were negative controls. The experiment was repeated independently at least twice with similar results. (c) HIV-1 Env mediated cell-cell fusion. 293T cells stably transfected with CCR5 were mixed with HIV-1 Env (gp160) expressing cells in the absence or presence of soluble CD4. The CCR5 cells fuse with CD4-triggered Env cells very efficiently and form large syncytia that almost cover the entire well. The experiment was repeated independently twice with similar results. (d) Chemokine receptor assay by various ligands. As in (a), Expi293F and Expi293F-CCR5 (stable) cells were treated with CCL5/RANTES, gp120, CD4 or the complex of gp120 and CD4. The dose response curves were plotted for both Expi293F (control, left) and Expi293F-CCR5 (right) cells with different ligands as indicated. The experiment was carried out in quadruplicate and repeated at least three times with similar results. Error bars indicate the standard deviation calculated by the Excel STDEV function. (e) Left, kinetic curves of 5 representative wells of 293T-CCR5 cells treated with 5 different ligands as indicated. ATP activates the endogenous Gq coupled GPCR - P2Y receptor, as a positive control. Ratio, fluorescence intensity/baseline intensity. Right, dose response curve of each ligand. The y-axis is a background-subtracted ratio (peak fluorescent intensity ratio - 1). We conclude that our gp120 and gp120-CD4 do not activate G-protein mediated calcium flux at the concentrations tested here. The experiment was carried out in quadruplicate and repeated twice with similar results. Error bars indicate the standard deviation calculated by the Excel STDEV function.
Extended Data Figure 3.
Extended Data Figure 3.. Purification of the CD4-gp120-CCR5 complex.
(a) Schematic representation of expression constructs for HIV-1 gp120, human CCR5 and CD4. Segments of gp120 are designated as follows: C1-C5, conserved regions 1-5; V1-V5, variable regions 1-5; and His-tag, a six-histidine tag. Tree-like symbols represent glycans. Those for CCR5 include: N, N-terminus; TM1-7, transmembrane helices 1-7; ECL1-3, extracellular loop 1-3; ICL3, intracellular loop 1-3; and CT, cytoplasmic tail. For CD4, they are: D1-4, immunoglobulin (Ig) domain 1-4; and strep tag, a purification tag. TM (transmembrane segment) and CT (cytoplasmic tail) in gray are truncated in the expression construct. (b) Unmodified human CCR5 in complex with HIV-1 gp120 and 4D CD4 was purified by the following steps: 1) complex formation, HIV-1 gp120 (green) and strep-tagged, 4 domain CD4 (light blue) were incubated with CCR5 (magenta) expressed cells to allow formation of the CD4-gp120-CCR5 complex on cell surfaces; 2) strep-tag purification, the CCR5 complex, as well as some CD4-gp120 complex, were captured to strep-tactin resin via the strep-tagged CD4 (strep tag in yellow). They were eluted by D-desthiobiotin under mild conditions; 3) negative selection by an anti-V3 antibody to remove the CD4-gp120 complex. The CCR5 complex was further purified by size-exclusion chromatography. (c) The purified CD4-gp120-CCR5 complex was resolved by gel-filtration chromatography on a Superose 6 column in the presence of detergent LMNG. The molecular weight standards include thyoglobulin (670 kDa), ferritin (440 kDa), γ-globulin (158 kDa) and ovalbumin (44 kDa). The expected size of the CCR5 complex is ~310 kDa (120 kDa for gp120, 50 kDa for 4D CD4, 40 kDa for CCR5 and ~100 kDa for LMNG micelle). Peak fractions were analyzed by Coomassie stained SDS-PAGE (lanes 1-3). Labeled bands were confirmed by western blot and protein sequencing. The experiment was repeated independently at least 15 times with similar results.
Extended Data Figure 4.
Extended Data Figure 4.. Characterization of the CD4-gp120-CCR5 complex by EM.
(a) Representative image of the CD4-gp120-CCR5 complex in negative stain. The experiment was repeated independently at least 4 times with similar results. (b) 2D averages of the negatively stained CD4-gp120-CCR5 complex. The box size of 2D averages is ~330Å. (c) 3D reconstruction of the negatively stained CD4-gp120-CCR5 complex, fitted with a gp120 structure containing an extended V3 loop (pdb ID: 2QAD; ref), 4D CD4 (pdb ID: 1WIO) and CCR5 (pdb ID: 4MBS). (d) A representative cryo-EM image of the 4D CD4-gp120-CCR5 complex. The scale bar represents 25 nm. Five independent large data sets were collected with similar results. (e) 2D averages of the cryo-EM particle images show secondary structural features for both gp120 and CCR5.
Extended Data Figure 5.
Extended Data Figure 5.. Single-particle cryo-EM analysis of the CD4-gp120-CCR5 complex.
(a) Data processing workflow for the CD4-gp120-CCR5 complex. (b) 3D reconstructions of the CD4-gp120-CCR5 complex refined with no mask at an overall resolution of 4.5Å (left) and with a mask to exclude the last two domains of CD4 at a resolution of 3.9Å (right) are colored according to local resolution estimated by RELION. (c) Angular distribution of the cryo-EM particles used in the reconstruction was also shown in respect to both the side and top views of the EM map. (d) Gold standard FSC curves of the unmasked and masked EM reconstructions shown in (b).
Extended Data Figure 6.
Extended Data Figure 6.. Gallery of representative density for the CD4-gp120-CCR5 complex.
Representative density in gray mesh from the 3.9Å resolution EM map is shown for TM1-7, the N-terminus of CCR5, ELC3 near TM6, Tys10, Tys14 and Tyr15 (red model); two V3 regions; and for helix α1, N-terminus, V3 loop, the bridging sheet and N-linked glycan at Asn262 of gp120 (cyan model).
Extended Data Figure 7.
Extended Data Figure 7.. Comparison of conformations of V3 loop and [5P7]CCL5 in complex with CCR5, as well as of gp120-bound CCR5 and G protein-bound β2 adrenergic receptor (β2AR).
(a) The structures of the CD4-gp120-CCR5 and [5P7]CCL5-CCR5 complexes are superposed on CCR5 (red). Gp120 V3 loop with its Pro311 in stick model is in cyan and [5P7]CCL5 with its Pro3 in stick model in yellow. Residues 309-316 of the V3 loop and residues 1-8 of [5P7]CCL5 adopt a very similar structure are highlighted in a rectangular box. (b) Superposition of the structures of the N-terminus of the gp120-bound CCR5 (red) and the CDR H3 loop of antibody 412d in complex with gp120 core (green). The EM density of the CD4-gp120-CCR5 is shown in gray. The positions of the sulfated tyrosine (Tys) residues, including Tys10 and Tys14 from CCR5; Tys100 and Tys100c from 412d, are indicated. (c) A model for interactions of three CD4 and three CCR5 with the SOSIP Env trimer. The side and bottom views of a composite structure of the CD4-CCR5-SOSIP Env trimer complex are shown. The model was generated using the CD4-bound SOSIP trimer (pdb ID:5VN3) and the structure of the CD4-gp120-CCR5 complex from this study. All the structures were aligned based on the gp120 core region. CCR5 is shown in red, CD4 in green, gp120 in blue and gp120 of SOSIP dark blue; gp41 of SOSIP gray. The crystallographic dimer of CCR5 was also shown on left only in a rectangular box using pdb ID: 4MBS. The observed crystallographic dimer of CCR5 or the TM5-mediated dimer by modeling does not seem to be relevant to binding to either monomeric or trimeric gp120,. (d) Superposition of the structures of the gp120-bound CCR5 (red) and the Gs protein-bound β2 adrenergic receptor (blue). The position of TM6, critical for GPCR activation, is indicated.
Extended Data Figure 8.
Extended Data Figure 8.. Comparison of conformations of different monomeric gp120s and various V3 loops.
(a) Comparison of structures of an unliganded gp120 core (pdb ID:4OLV; purple), a CD4-bound monomeric gp120 core with the V3 loop (pdb ID:2QAD; blue) and gp120 in complex with CD4 and CCR5 from this study (cyan). The gp120 core region is marked by a circle with a diameter of 50Å. N- and C-termini, V1V2 stem, V3 stem or loop and bridging sheet are indicated. (b) Representative conformations that an HIV-1 V3 loop can adopt. From left to right: V3 loop in the unliganded SOSIP BG505 Env trimer (pdb ID: 4ZMJ); the first V3-containing gp120 core in complex with CD4 and antibody X5 (pdb ID: 2B4C; ref); CD4- and 412d-bound monomeric gp120 core with V3 (pdb ID: 2QAD); CCR5-bound intact gp120 (this study); and V3 peptide in complex with antibody 447-52D (pdb ID: 3GHB; ref); antibody 268-D (pdb ID: 3GO1; ref); antibody 2557 (pdb ID: 3MLV; ref); antibody 10A37 (pdb ID: 5V6L; ref). The root-mean-square deviation (RMSD) of each structure, except for 5V6L, relative to the CCR5-bound gp120 monomer is shown at the bottom in parenthesis.
Extended Data Figure 9.
Extended Data Figure 9.. Model for HIV-1 Env activation to induce membrane fusion.
A hypothesis of how cellular receptors CD4 and CCR5 trigger HIV-1 Env trimer to induce membrane fusion and viral entry. Left, virus attaches to the target cell by gp120 (cyan) binding to CD4 (green). Helix collar of gp41, the 4-helix collar gripping the N- and C-termini of gp120. Right, immediate binding by CCR5 (red) prevents rapid dissociation between gp120 and CD4, stabilizes the CD4-induced conformational changes within the Env trimer and also brings the trimer close to the cell membrane. Simultaneous binding of gp120 to both CD4 and CCR5 may require bending in the cell membrane. The fusion peptide (magenta) of gp41 (gray) flips out due to intrinsic conformational dynamics, allowing bending back of the N- and C-termini of gp120, which blocks the fusion peptide from resuming its original position in the trimer. The movements of the fusion peptide and gp120 termini effectively weakens the non-covalent association between the two subunits and may lead to partial or complete dissociation of gp120 and a series of refolding events in gp41 to adopt the prehairpin intermediate conformation with the fusion peptides inserting into the target cell membrane. Extended helix in gp41, three helices in the fusion intermediate conformation of gp41.
Figure 1.
Figure 1.. Cryo-EM structure of the CD4-gp120-CCR5 complex.
(a) Cryo-EM map of the complex containing HIV-1 gp120 (cyan), CCR5 (red), 4D CD4 (green; D1-4, domain 1-4), and detergent micelle (gray). (b) Fit of structures of gp120 (pdb ID: 5VN328), CCR5 (pdb ID: 5UIW) and 4D CD4 (pdb ID: 1WIO) into the EM map in (a). N271 of CD4 (green), N234, N262 and N362 of gp120 in cyan are N-linked glycosylation sites. (c) The structure of the CD4-gp120-CCR5 complex was modeled based on a 3.9Å density map. (d) Overall structure of the 4D CD4-gp120-CCR5 complex shown in ribbon diagram. N, N-terminus; C, C-terminus; ECL2, extracellular loop 2; I, II, III, IV, V, VI, VII, transmembrane helices (TM) 1-7.
Figure 2.
Figure 2.. Interfaces between gp120 and CCR5.
(a) Interactions between the V3 loop of gp120 (cyan) and the CRS2 of CCR5 (red). Left, ribbon diagram of V3 inserting into the CRS2. The GPGR motif of V3 is in stick model. Right, major contacts between residues Pro311, Arg313 and Arg304 of gp120 in cyan and those from CCR5. (b) Interactions between the CCR5 N-terminus (red) and the bridging sheet of gp120 (cyan). Left, overall view of the CCR5 N-terminus attaching to the four-stranded bridging sheet formed by the V1V2 stem and β21-β22 of gp120. Residues Ser7, Pro8, sulfated Tyr10 and Tyr14, Tyr15, Pro19, the O-linked glycan at Ser7, the disulfide between Cys20 and Cys269 of CCR5 are in stick model. Right, major contacts between sulfated Tyr10 and Tyr14, as well as Tyr15 of CCR5 and residues from gp120.
Figure 3.
Figure 3.. Conformational differences between gp120-bound and other liganded CCR5s.
(a) The section of the CCR5 CRS2 (divided into a major and a minor subpocket) is shown in surface representation for the [5P7]CCL5, gp120 and maraviroc complexes, respectively. Interacting residues, including Pro3 from [5P7]CCL5, Pro311 from the V3 loop, and compound maraviroc, are in stick model. (b) Superposition of the structures of the gp120-CCR5 complex (red) and the maraviroc-CCR5 complex (blue). N-terminus, ELC2 and seven TM helices (I, II, III, IV, V, VI, VII) are indicated. (c) Superposition of the structures of the gp120-CCR5 complex (red) and the [5P7]CCL5-CCR5 complex (blue).
Figure 4.
Figure 4.. Conformational differences between CD4-bound and CCR5-bound gp120s.
(a) Comparison of structures of gp120 in the unliganded SOSIP Env trimer (pdb ID: 4ZMJ35; purple), in the CD4-bound SOSIP trimer (pdb ID:5VN3; blue) and in complex with CD4 and CCR5 (cyan). A 50Å-circle marks the gp120 core region. (b) Superposition of structures of the CD4-gp120-CCR5 complex and the CD4-bound SOSIP trimer. Left, the two structures are superposed by the gp120 core region and the first two domains of CD4. CCR5-bound gp120 is in cyan, CCR5 in red, CD4 in green; one of the gp120s from the trimer in blue, the corresponding gp41 in yellow, except for its fusion peptide in magenta, the rest of the SOSIP trimer in gray. The distances between the fusion peptide and the TM domains of CD4 and CCR5 are 160Å and 70Å, respectively. Right, close-up views of the gp120 N- and C-terminal region. Four helices (α6, α7, α8 and α9) of gp41 forming the 4-helix collar are indicated. The N-terminus of the CCR5-bound gp120 overlaps with the fusion peptide in the CD4-bound trimer.

Comment in

  • HIV seals an envelope.
    Bucci M. Bucci M. Nat Chem Biol. 2019 Mar;15(3):207. doi: 10.1038/s41589-019-0238-1. Nat Chem Biol. 2019. PMID: 30770914 No abstract available.

References

    1. Harrison SC Viral membrane fusion. Nature structural & molecular biology 15, 690–698, doi:10.1038/nsmb.1456 (2008). - DOI - PMC - PubMed
    1. Kwong PD et al. Structure of an HIV gp120 envelope glycoprotein in complex with the CD4 receptor and a neutralizing human antibody. Nature 393, 648–659 (1998). - PMC - PubMed
    1. Julien JP et al. Crystal structure of a soluble cleaved HIV-1 envelope trimer. Science 342, 1477–1483, doi:10.1126/science.1245625 (2013). - DOI - PMC - PubMed
    1. Lee JH, Ozorowski G & Ward AB Cryo-EM structure of a native, fully glycosylated, cleaved HIV-1 envelope trimer. Science 351, 1043–1048, doi:10.1126/science.aad2450 (2016). - DOI - PMC - PubMed
    1. Pancera M et al. Structure and immune recognition of trimeric pre-fusion HIV-1 Env. Nature 514, 455–461, doi:10.1038/nature13808 (2014). - DOI - PMC - PubMed

Publication types

MeSH terms