. 2018 Dec;564(7735):273-277.
doi: 10.1038/s41586-018-0774-y. Epub 2018 Dec 12.

Disruption of a self-amplifying catecholamine loop reduces cytokine release syndrome

Affiliations

Disruption of a self-amplifying catecholamine loop reduces cytokine release syndrome

Verena Staedtke et al. Nature. 2018 Dec.

Abstract

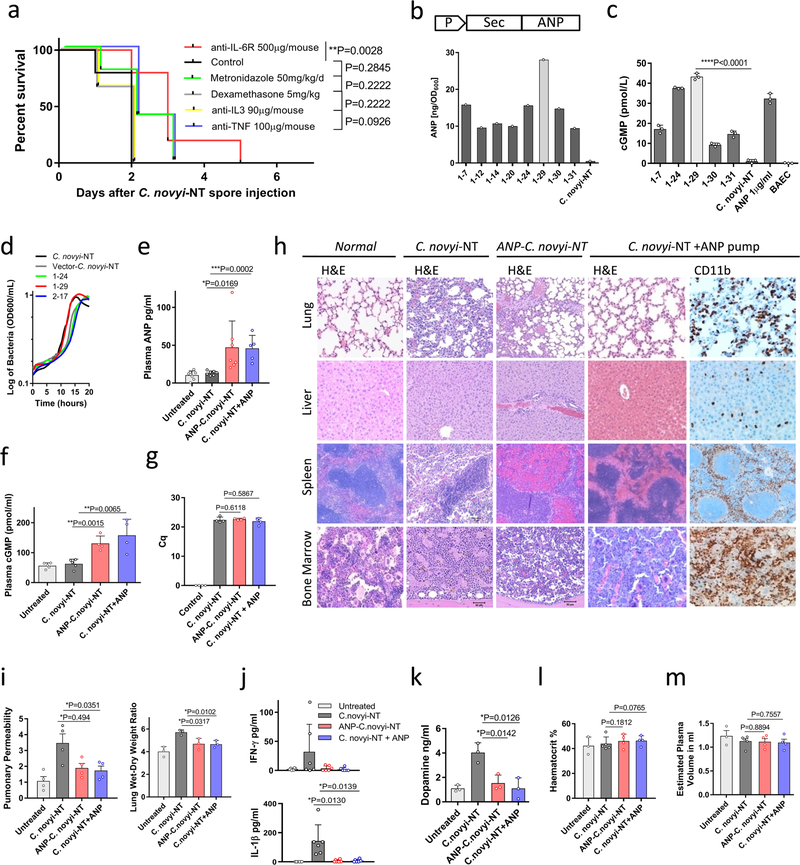
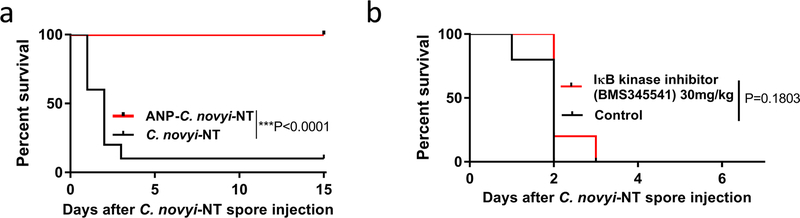
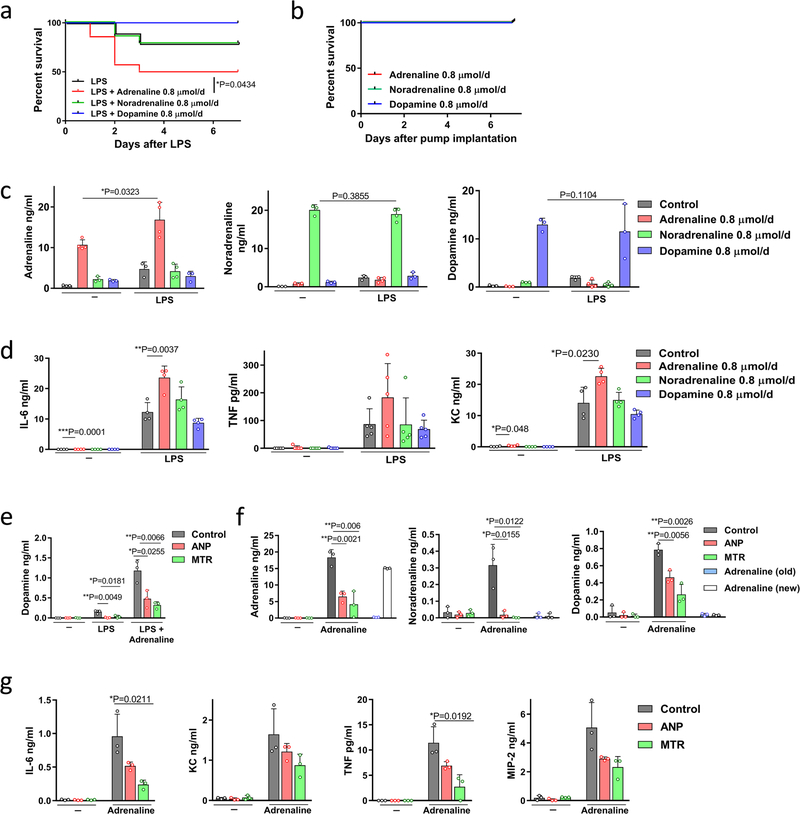
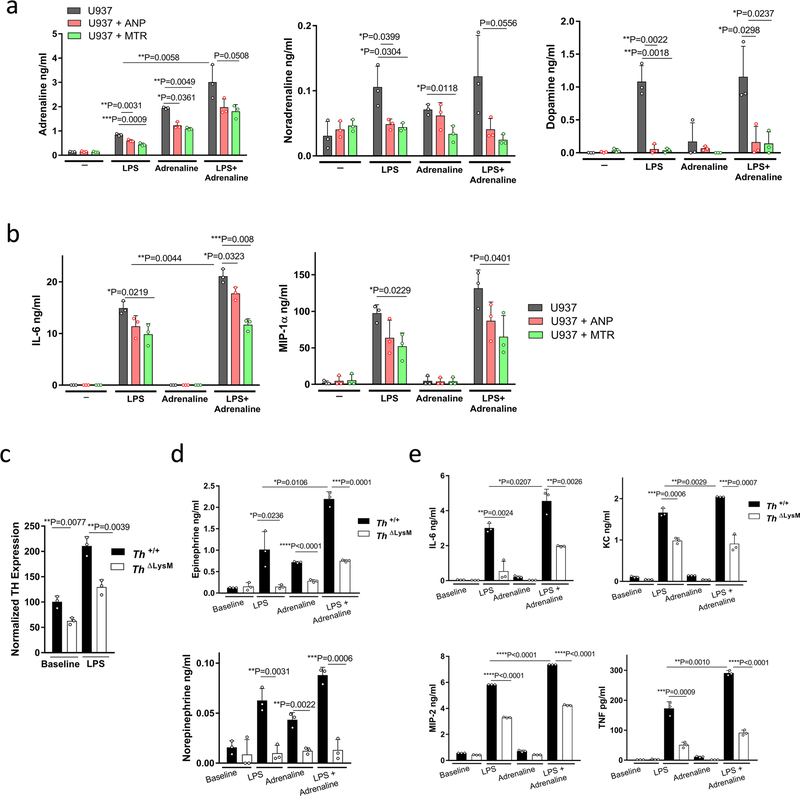
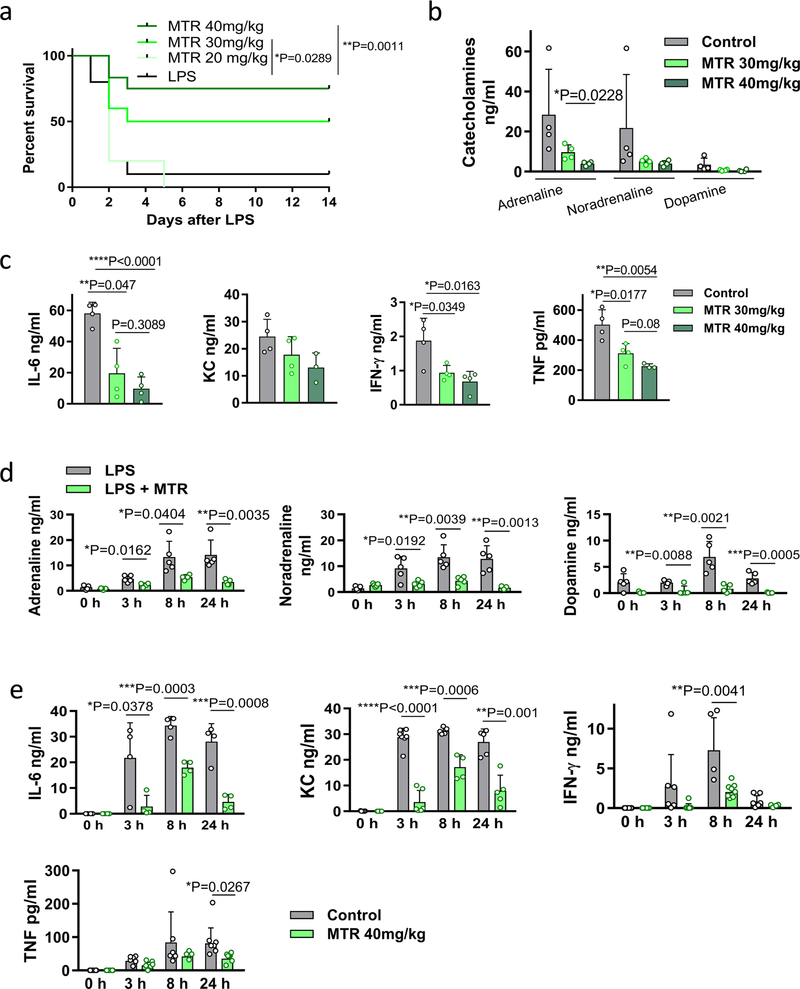
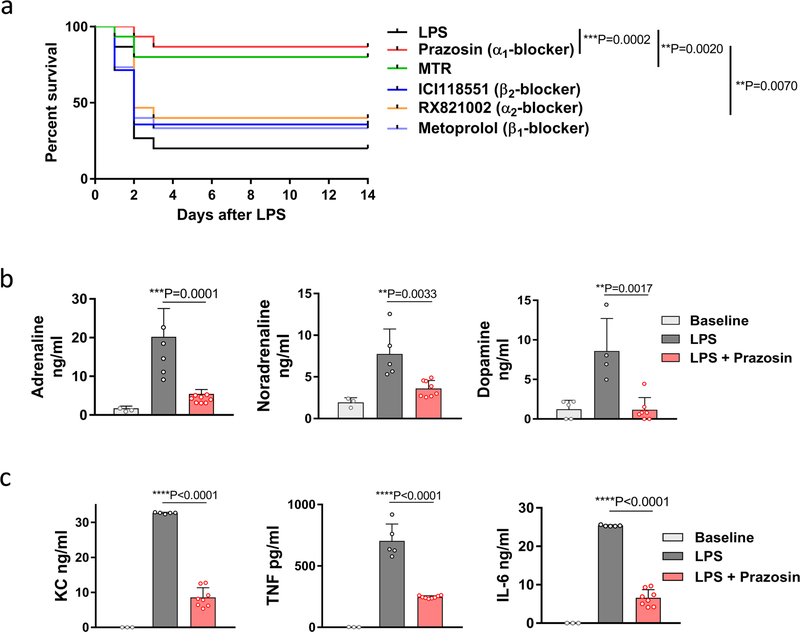
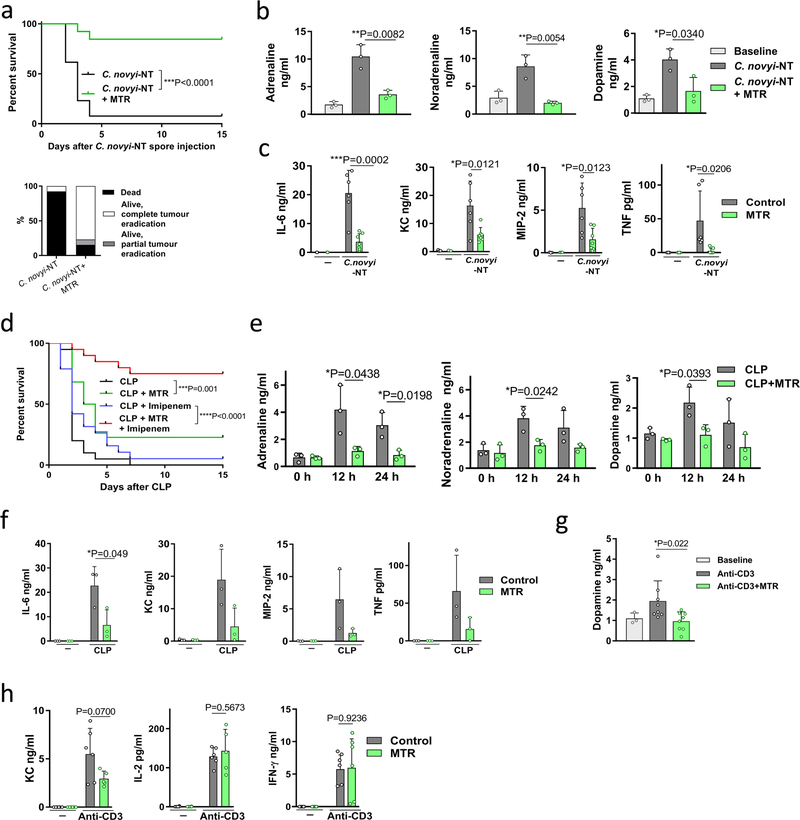
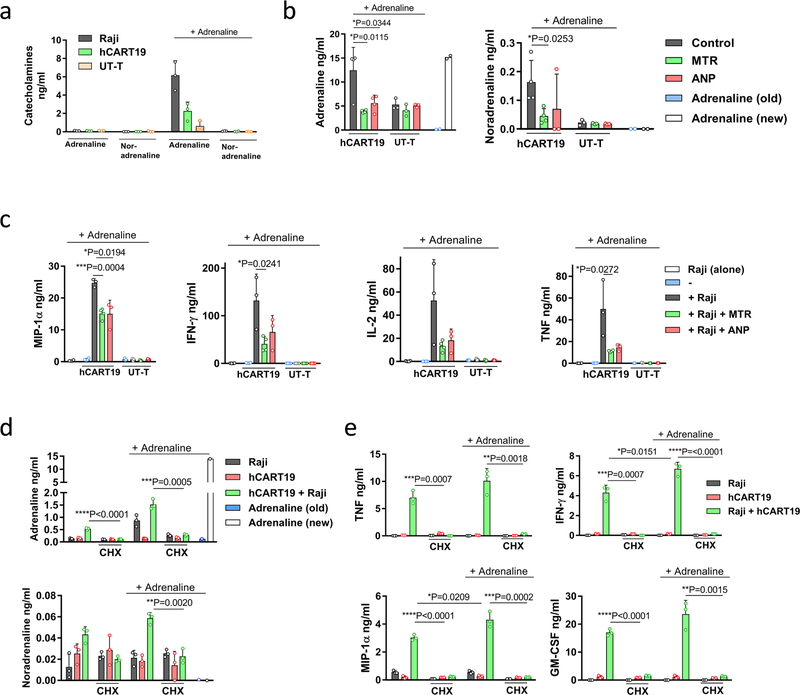
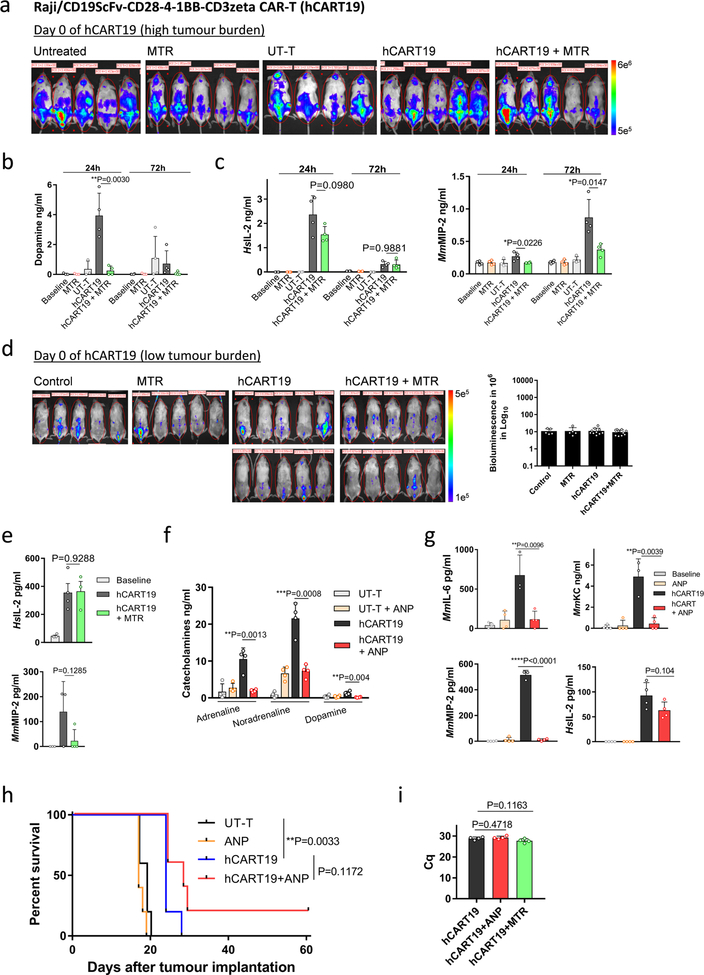
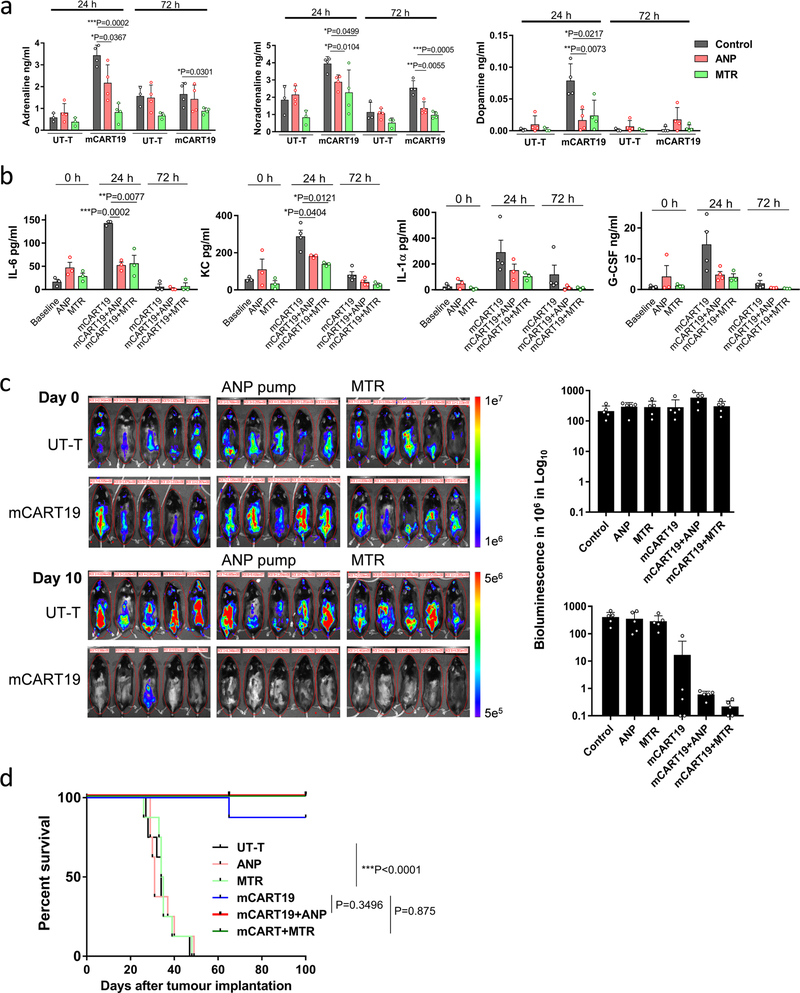
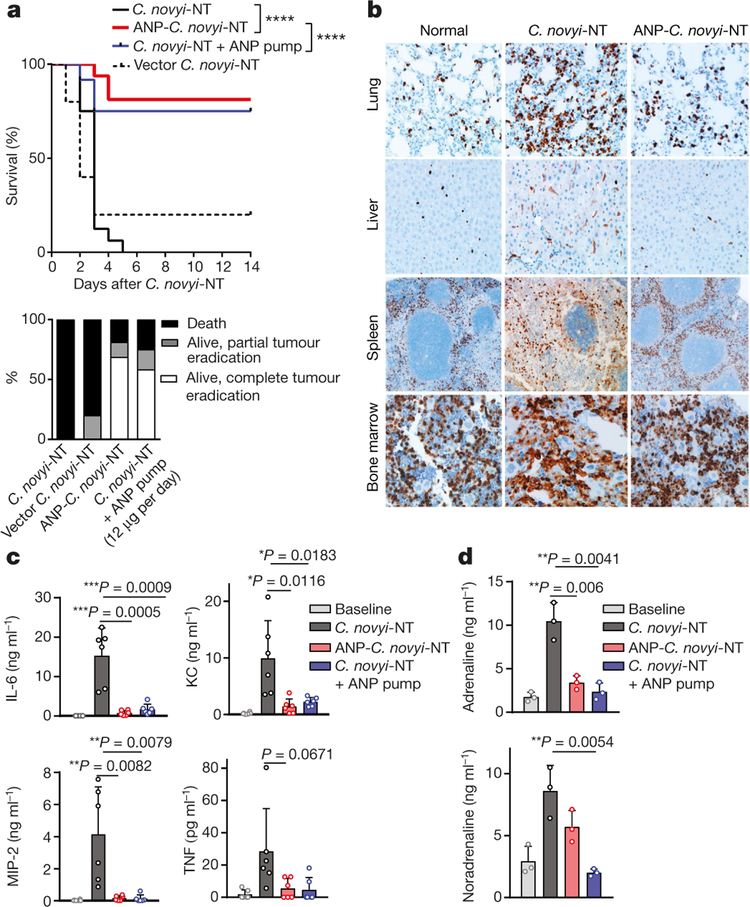
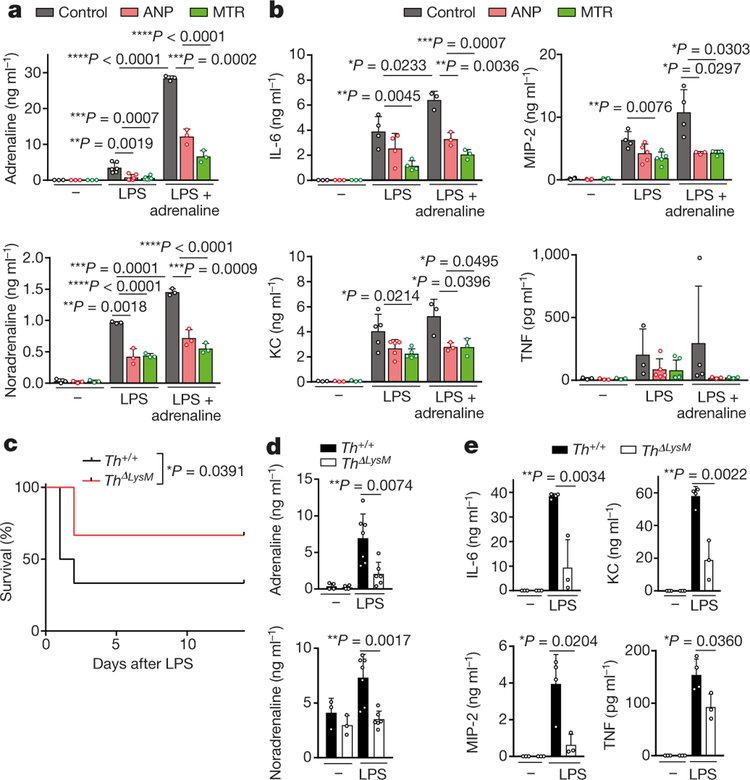
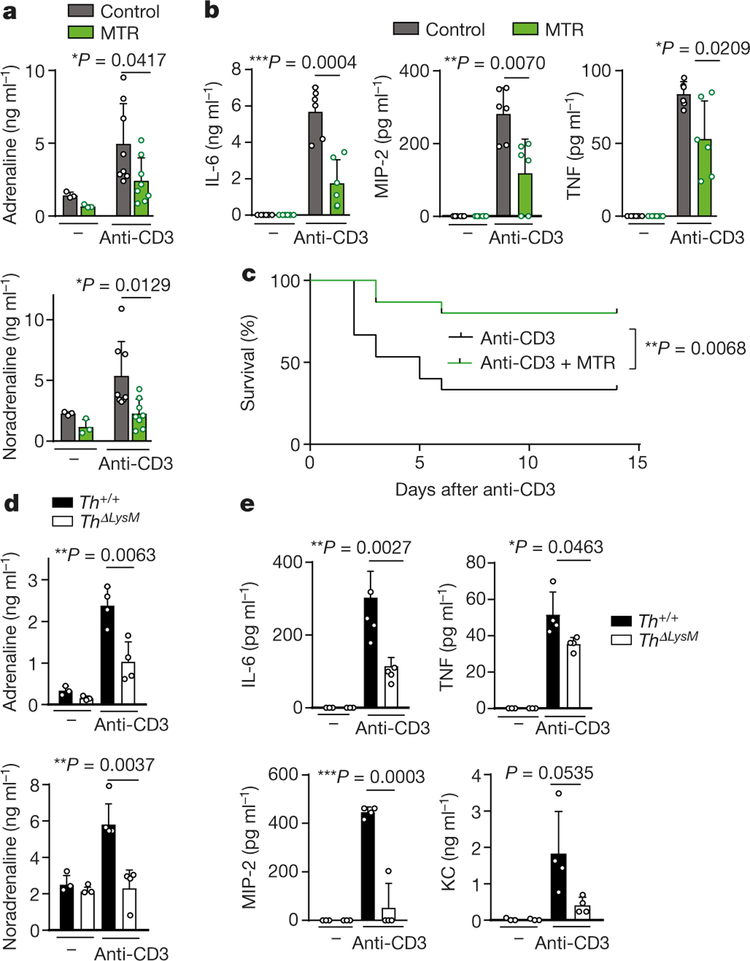
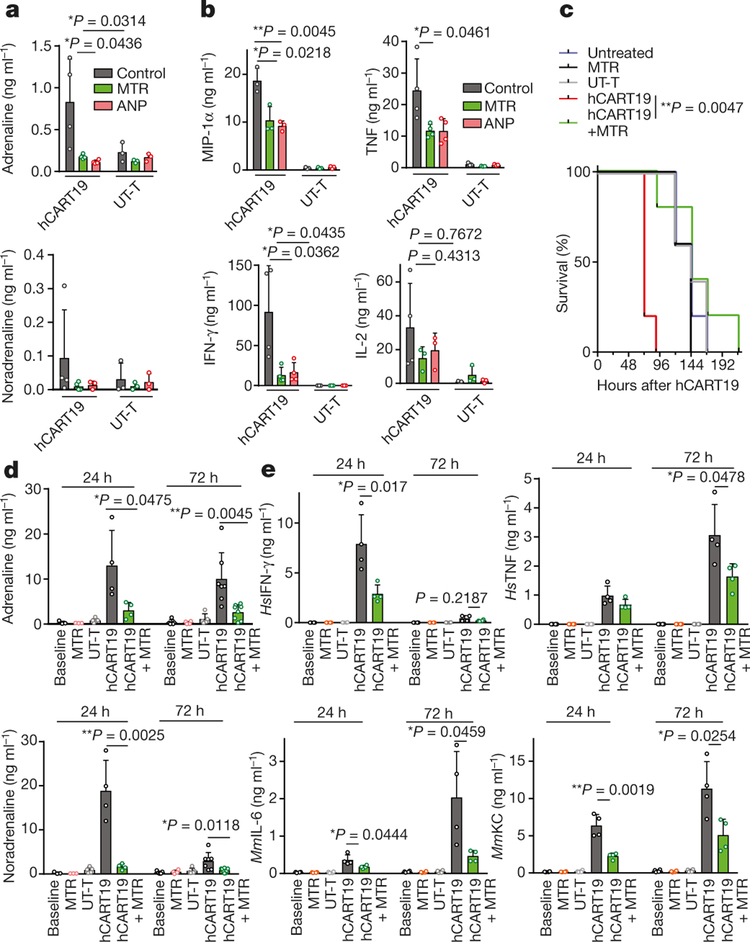
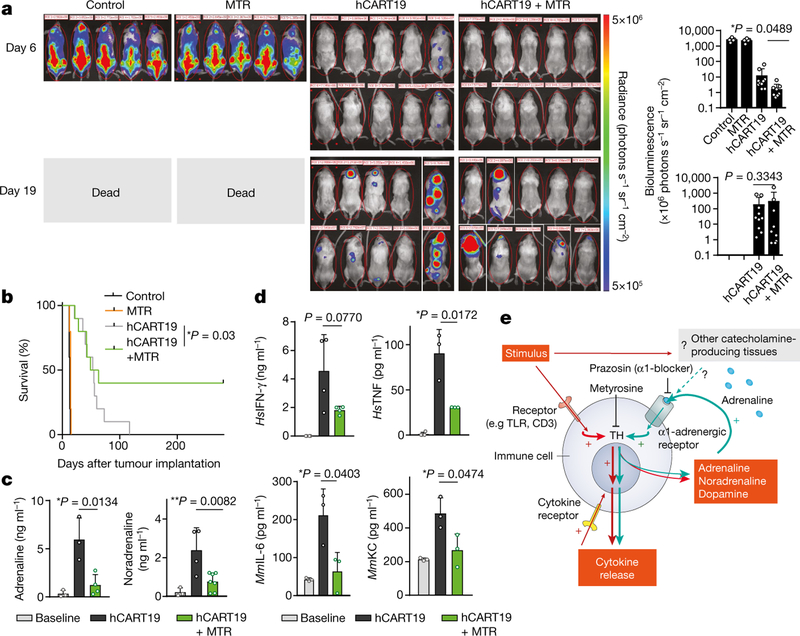
Cytokine release syndrome (CRS) is a life-threatening complication of several new immunotherapies used to treat cancers and autoimmune diseases1-5. Here we report that atrial natriuretic peptide can protect mice from CRS induced by such agents by reducing the levels of circulating catecholamines. Catecholamines were found to orchestrate an immunodysregulation resulting from oncolytic bacteria and lipopolysaccharide through a self-amplifying loop in macrophages. Myeloid-specific deletion of tyrosine hydroxylase inhibited this circuit. Cytokine release induced by T-cell-activating therapeutic agents was also accompanied by a catecholamine surge and inhibition of catecholamine synthesis reduced cytokine release in vitro and in mice. Pharmacologic catecholamine blockade with metyrosine protected mice from lethal complications of CRS resulting from infections and various biotherapeutic agents including oncolytic bacteria, T-cell-targeting antibodies and CAR-T cells. Our study identifies catecholamines as an essential component of the cytokine release that can be modulated by specific blockers without impairing the therapeutic response.


Conflict of interest statement

Competing interests A patent application on CRS prevention listing V.S., R.-Y.B., G.J.R., K.W.K., N.P., S.Z. and B.V. as co-inventors has been provisionally filed by Johns Hopkins University. Under a licensing agreement between BVD Inc. and Johns Hopkins University, K.W.K., B.V. and S.Z. are entitled to a share of royalties managed by Johns Hopkins University. B.V., K.W.K. and NP are members of the Scientific Advisory Board of Sysmex and are founders of PapGene and Personal Genome Diagnostics. B.V. is also an advisor to Camden Partners. The terms of all these arrangements are managed by Johns Hopkins University in accordance with its conflict of interest policies. P.B.R. serves on Merck’s board of directors.

Figures

Extended Data Fig. 1 |
Extended Data Fig. 1 |. In vitro and in vivo studies of ANP-C. novyi-NT.
a, Kaplan–Meier curves of mice with large subcutaneous CT26 tumours (600–900 mm3), treated with 12 × 106 C. novyi-NT spores and the indicated agents: anti-IL-6R (n = 10), metronidazole (n = 5), dexamethasone (n = 6), anti-IL3 (n = 6) and anti-TNF (n = 5) injected intratumourally, compared to controls (n = 5). Survival differences were analysed by two-sided log-rank test. b and c, Selected clones of ANP-C. novyi-NT were analysed for ANP secretion, shown as the average of a triplicate, (b) and for cGMP induction (n = 3) using bovine aortic endothelial cells (c). d, Growth pattern of several clones compared to the parental C. novyi-NT. The average of a triplicate is shown. eg, Levels of plasma ANP (left to right, n = 7, 8, 7, 5 independent samples per column) (e), plasma cGMP (n = 5, 5, 4, 4 samples per column) (f) and germinated C. novyi strains in tumour tissue (n = 4 samples per column) based on quantification cycle (Cq) from RT–PCR of germination-specific NT01CX1854 gene (g), measured at 36 h after spore injection. h, Representative haematoxylin and eosin as well as anti-CD11b antibody stained sections from the lungs, liver, spleen and bone marrow of mice treated with ANP-C. novyi-NT (n = 3), C. novyi-NT (n = 3) and C. novyi-NT plus ANP (n = 2) compared to normal controls (n = 2). im, Pulmonary permeability (n = 4 mice per group), lung wet–dry ratio (n = 3 mice per group) (i) as well as levels of cytokines (n = 6 independent samples per column) (j), dopamine (n = 3 independent samples per column) (k), haematocrit (n = 3, 5, 4, 4 samples per column) (l) and calculated plasma volume (n = 3, 5, 4, 4 samples per column) (m) measured 36 h after spore treatment. Data are presented as mean ± s.d. with individual data points shown, analysed by two-tailed t-test (c, eg, im). BAEC, bovine aortic endothelial cells.
Extended Data Fig. 2 |
Extended Data Fig. 2 |. Survival of mice treated with ANP and IκB kinase inhibitor BMS345541.
a, Survival of mice with subcutaneously implanted GL-261 tumours, treated with 12 × 106 of ANP-C. novyi-NT spores (n = 10 animals per group). b, Survival of mice with CT26 tumours treated with C. novyi-NT and IκB kinase inhibitor BMS345541 (n = 5 mice per group). Survival differences were analysed by two-sided log-rank test (b, c).
Extended Data Fig. 3 |
Extended Data Fig. 3 |. Adrenaline enhances the inflammatory response.
a, Survival of BALB/c mice implanted with the indicated catecholamine pump and stimulated with a sublethal dose of LPS (n = 14 mice per group) compared to LPS alone (n = 19 mice). Survival differences were analysed by Gehan–Breslow–Wilcoxon test. b, Survival of BALB/c mice with indicated catecholamine pump without LPS stimulation (n = 5 mice per group). c, d, 24 h plasma levels of adrenaline (left to right, n = 3, 4, 3, 3, 3, 4, 4, 3 per column), noradrenaline (n = 3, 3, 3, 3, 3, 4, 4, 3) and dopamine (n = 3, 3, 3, 3, 3, 4, 4, 3) (c) as well as levels of IL-6 (n = 4 per column), TNF (n = 5 per column) and KC (n = 4 per column) (d) in mice receiving the indicated treatments. e, Dopamine concentration in LPS- and adrenaline-treated peritoneal macrophages pre-incubated with ANP or MTR (n = 3 per column), measured after 24 h. f, g, Levels of catecholamines (n = 3 independent samples per column) (f) and several cytokines (n = 3 independent samples per column) (g) in adrenaline (15 ng ml−1)-treated peritoneal macrophages pre-incubated with ANP or MTR and measured after 24 h. Data are presented as mean ± s.d. with individual data points shown, analysed by two-tailed t-test (cg).
Extended Data Fig. 4 |
Extended Data Fig. 4 |. Catecholamines modulate the cytokine release in macrophages in vitro.
a, b, Human U937 macrophage-like cells were pre-treated with ANP or MTR for 10 min, then stimulated with LPS at 1 μg ml−1 and/or adrenaline at 15 ng ml−1. Culture supernatants were analysed for catecholamines (n = 3 per column) (a) as well as the indicated cytokines (n = 3 per column) (b). c, TH expression of baseline and LPS-stimulated Th+/+ or ThΔLysM macrophages (n = 3 per group), analysed by RT–PCR; results are normalized to ubiquitin C (UBC) expression. d, e, Supernatants of collected peritoneal macrophages from Th+/+ or ThΔLysM mice, stimulated with LPS at 50 μg ml−1, adrenaline 15 μg ml−1 or both for 24 h, were analysed for levels of adrenaline (n = 3), noradrenaline (n = 3) (d) and cytokines IL-6 (n = 3), KC (n = 3), MIP-2 (n = 3) and TNF (n = 3) (e). All data are presented as mean ± s.d. with individual data points shown, analysed by two-tailed t-test.
Extended Data Fig. 5 |
Extended Data Fig. 5 |. Modulation of catecholamine synthesis by MTR dose-dependently determines survival and cytokine release.
a, Survival of BALB/c mice stimulated with a lethal dose of LPS and treated with the indicated dose of MTR: MTR 20 mg kg−1 (n = 5 mice per group); MTR 30 mg kg−1 (n = 10 mice), MTR 40 mg kg−1 (n = 12) compared to LPS (n = 10 mice). Survival differences were analysed by two-sided log-rank test. b, c, Levels of plasma catecholamines (n = 4 per column) (b) and IL-6 (n = 4 per column), KC (left to right, n = 4, 4, 3 per column), IFN-γ (n = 4) and TNF (n = 4, 4, 3) (c) at different MTR doses measured 24 h after LPS injection. d, e, 24-h-time course of circulating adrenaline (n = 5, 5, 5, 4, 5, 4, 5, 5), noradrenaline (n = 5) and dopamine (n = 5) (d) and corresponding levels of IL-6 (n = 4), KC (n = 7, 7, 7, 6, 5, 4, 5, 5), IFN-γ (n = 6, 6, 6, 8, 4, 8, 6, 4) and TNF (n = 6, 6, 6, 6, 6, 4, 7, 7) (e) in LPS-treated mice receiving MTR 40 mg kg−1. Data are presented as mean ± s.d. with individual data points shown, analysed by two-tailed t-test (be).
Extended Data Fig. 6 |
Extended Data Fig. 6 |. Blockage of α1-adrenoceptor mediates the survival in experimental systemic inflammatory syndrome.
a, Kaplan–Meier curve of LPS-injected BALB/c mice treated with the indicated adrenoreceptor blockers (n = 15 animals per group). Survival differences were analysed by two-sided log-rank test. b, c, Levels of adrenaline, noradrenaline (left to right, n = 3, 5, 8 per column) and dopamine (n = 5, 4, 7) (b) as well as indicated cytokines (n = 3, 5, 8) (c) measured 24 h after LPS administration. Data are presented as mean ± s.d. with individual data points shown, analysed by two-tailed t-test (b, c).
Extended Data Fig. 7 |
Extended Data Fig. 7 |. Suppression of catecholamines with MTR reduces toxicity of oncolytic bacterium C. novyi-NT and polymicrobial sepsis.
a, Survival (top panel) and therapeutic response (bottom panel) of CT26 tumour-bearing BALB/c mice undergoing C. novyi-NT treatment with or without MTR pre-treatment (n = 13 mice per group). Survival differences were analysed with two-sided log-rank test. b, c, Corresponding plasma levels of adrenaline (n = 3 independent samples per column), noradrenaline (n = 3), dopamine (n = 3) (b) and indicated cytokines (left to right, n = 3, 3, 6, 7 independent samples per column) (c), measured at baseline and 36 h after treatment. d, Survival of C57Bl/6 mice undergoing CLP, with the indicated treatments (CLP, n = 20 mice; MTR, n = 22; imipenem, n = 19; MTR + imipenem, n = 20 mice per group). Survival differences were analysed with two-sided log-rank test. e, Plasma levels of adrenaline (n = 3), noradrenaline (n = 3) and dopamine (n = 3) at the indicated time points after CLP, with or without MTR pre-treatment. f, Levels of indicated cytokines (n = 3) at baseline and 24 h after CLP, with or without MTR pre-treatment. g, h, Levels of plasma dopamine (left to right, n = 3, 8, 8 independent samples per column) (g) and KC (n = 6, 6, 6, 5), IL-2 (n = 6, 6, 6, 5) and IFN-γ (n = 6) (h) measured 24 h after α-CD3 treatment, with or without MTR. Data are presented as mean ± s.d. with individual data points shown, analysed by two-tailed t-test (b, c, eh).
Extended Data Fig. 8 |
Extended Data Fig. 8 |. Adrenaline stimulates cytokine release during hCART19–Raji cell interaction in vitro.
a, Levels of catecholamines measured individually in supernatants of Raji cells (n = 3), hCART19 (n = 3) and UT-T (n = 3 per column) at baseline and when exposed to adrenaline. b, c, Co-cultures of hCART19 and Raji with or without MTR or ANP pre-treatment were stimulated with 15 ng ml−1 of adrenaline. Culture supernatants were collected after 24 h and analysed for adrenaline (left to right, n = 4, 4, 4, 3, 3, 3, 2, 2 per column) and noradrenaline (n = 4, 4, 3, 3, 3, 3, 2, 2). Adrenaline (old): adrenaline at 15 ng ml−1 was incubated at 37 °C for 24 h in the cell-free medium. Adrenaline (new): adrenaline at 15 ng ml−1 was added into the cell-free medium and immediately measured (b). Corresponding cytokine levels of MIP-1α (n = 4, 4, 3, 4, 3, 3, 3, 3, 3), IFN-γ (n = 4, 4, 3, 4, 3, 4, 4, 4, 4), IL-2 (n = 4, 4, 3, 4, 3, 3, 3, 3, 3) and TNF (n = 4, 4, 3, 4, 3, 3, 3, 3, 3) (c). UT-T served as control. d, e, As above, co-cultures of hCART19 and Raji with or without CHX were stimulated with 15 ng ml−1 of adrenaline in vitro. Levels of catecholamines (n = 3, 3, 3, 3, 3, 3, 3, 3, 3, 3, 3, 3, 1, 1) (d) and indicated human cytokines (n = 3) (e) were measured after 24 h. Data are presented as mean ± s.d. with individual data points shown, analysed by two-tailed t-test.
Extended Data Fig. 9 |
Extended Data Fig. 9 |. MTR and ANP prevent cytokine release in Raji/hCART19 mouse model.
a, Bioluminescent images (BLI) of Raji-bearing NSGS mice with high tumour burden. At day 0, tumour engraftment was quantified by BLI and mice were assigned to the treatment groups (untreated, MTR, hCART19, hCART19+MTR, n = 5 mice per group; UT-T, n = 4). b, c, Levels of dopamine (left to right, n = 3, 3, 3, 4, 4, 4, 3, 4, 4, 4 per column) (b) and indicated cytokines (n = 4) (c) measured in mice (with high tumour burden) 24 and 72 h after hCART19 and UT-T injection. d, BLI of Raji-bearing NSGS mice with low tumour burden. At day 0, mice were randomly assigned based on tumour burden to receive hCART19, with or without MTR (n = 10 mice per group) or UT-T, with or without MTR (n = 5 mice per group). e, Levels of HsIL-2 (n = 4, 4, 3) and MmMIP-2 (n = 3, 3, 4) assessed 72 h after hCART19 injection in mice with low tumour burden. f, g, NSGS mice were injected with hCART19 4 days after Raji implantation and treated with ANP delivered via subcutaneously implanted osmotic pumps. Levels of circulating catecholamines (n = 4 per column) (f) and MmIL-6, MmKC and MmMIP-2 (n = 4, 4, 3, 4) as well as HsIL-2 (n = 4) (g) were assessed 24 h after hCART19 administration. h, Survival of Raji cell-bearing NSGS mice treated with hCART19 and ANP (n = 5 per group); analysed by two-sided log-rank test. i, Level of circulating hCART19 10 days after treatment, determined by Cq from RT–PCR and analysed in triplicates (n = 4 per group). Data are presented as mean ± s.d. with individual data points shown, analysed by two-tailed t-test (b, c, ei).
Extended Data Fig. 10 |
Extended Data Fig. 10 |. MTR and ANP prevent cytokine release in syngeneic Eμ-ALL model without compromising anti-tumour efficacy.
a, b, Circulating catecholamines (left to right, n = 3, 4, 3, 4, 4, 4, 3, 4, 3, 4, 4, 4 per column/graph) (a) and murine cytokines IL-6 (n = 3 per column), KC (n = 3, 3, 3, 4, 3, 3, 4, 4, 3 per column), IL-1α (n = 3, 3, 3, 4, 3, 3, 4, 3, 3 per column) and G-CSF (n = 3, 3, 3, 4, 4, 3, 4, 3, 3 per column) (b), assessed at 24 and 72 h after mCART19 injection. Data are presented as means ± s.d. with individual data points shown, analysed by two-tailed t-test. c, BLI was performed before and 10 days after mCART19 cell injection, with or without ANP and MTR pre-treatment (n = 5 animals per group). BLI radiance was used to quantify the tumour burden during the treatment course (right). d, Percentage survival of Eμ-ALL-mice after mCART19 cell transfer (n = 8 mice per group). Survival differences were analysed by two-sided log-rank test.
Fig. 1 |
Fig. 1 |. ANP reduces mortality.
a, Kaplan–Meier curve (top panel) and therapeutic response (bottom panel) of ANP-C. novyi-NT (n = 16) compared to C. novyi-NT (n = 16), C. novyi-NT with ANP via osmotic pump (n = 12) and vector C. novyi-NT control (n = 5). Statistical survival differences were evaluated by two-sided log-rank test. ****P ≤ 0.0001. b, Representative anti-CD11b-antibody-stained sections from the lungs, liver, spleen and bone marrow of mice treated with ANP-C. novyi-NT (n = 3) and C. novyi-NT (n = 3) compared to normal controls (n = 2). c, Plasma levels of indicated cytokines (n = 6 independent samples per group) 36 h after spore injection. d, Corresponding plasma levels of adrenaline and noradrenaline 36 h after C. novyi-NT, ANP-C. novyi-NT and C. novyi-NT plus ANP pump compared to normal controls (n = 3 per group). Data are presented as mean ± s.d. with individual data points shown, analysed by two-tailed t-test (c, d).
Fig. 2 |
Fig. 2 |. Catecholamine production in myeloid cells is essential for cytokine release.
a, Peritoneal macrophages were pre-incubated with ANP or MTR for 10 min and then stimulated with LPS (50 μg ml−1) or a combination of LPS and adrenaline (15 ng ml−1) in vitro. Shown are the levels of adrenaline (left to right, n = 3, 3, 3, 6, 6, 6, 3, 3, 3 per column) and noradrenaline (n = 3) in the supernatant after 24 h. b, Corresponding cytokines from macrophage culture supernatants: IL-6 (n = 3, 3, 3, 4, 4, 4, 3, 3, 3), MIP-2 (n = 4, 4, 4, 4, 5, 5, 4, 3, 3), KC (n = 3, 3, 3, 5, 5, 5, 3, 3, 3) and TNF (n = 3, 3, 3, 3, 5, 6, 4, 3, 3). c, Survival of Th+/+ and ThΔLysM mice treated with LPS and analysed with two-sided log-rank test (n = 12; 6 male, 6 female). d, e, Plasma levels of adrenaline (n = 4, 4, 7, 6) and noradrenaline (n = 3, 3, 7, 6) (d) and indicated cytokines (n = 3, 3, 4, 3) (e) at baseline and 24 h after LPS treatment in Th+/+ or ThΔLysM mice. Data are presented as mean ± s.d. with individual data points shown, analysed by two-tailed t-test (a, b, d, e).
Fig. 3 |
Fig. 3 |. Inhibition of catecholamine synthesis reduces CRS after anti-CD3 treatment.
a, b, Levels of adrenaline and noradrenaline (left to right, n = 3, 3, 8, 8 independent samples per column) (a) and of cytokines (n = 6 independent samples) (b) measured 24 h after anti-CD3 treatment, with or without MTR. c, Survival of BALB/c mice treated with anti-CD3, with or without MTR (n = 15 animals); analysed by two-sided log-rank test. d, e, Levels of adrenaline, noradrenaline (n = 3, 3, 4, 4) (d) and indicated cytokines (n = 3, 3, 4, 4) (e) measured 24 h after anti-CD3 treatment in Th+/+ or ThΔLysM mice. Data are presented as mean ± s.d. with individual data points shown, analysed by two-tailed t-test (a, b, d, e).
Fig. 4 |
Fig. 4 |. Inhibition of catecholamine synthesis reduces cytokine release induced by hCART19 in vitro and in vivo.
a, b, Levels of adrenaline (left to right, n = 4, 4, 4, 3, 3, 3 per column) and noradrenaline (n = 4, 4, 3, 3, 3, 3) (a) and corresponding cytokines MIP-1α (n = 3), TNF (n = 4, 4, 4, 3, 3, 3), IFN-γ (n = 4, 4, 4, 3, 3, 3) and IL-2 (n = 4, 3, 3, 3, 3, 3) (b) in the supernatant 24 h after incubation of Raji cells with hCART19 or UT-T (ratio 1:5), with or without MTR or ANP. c, Survival of Raji-bearing NSGS mice with high tumour burden, treated with 1.5 × 10⁷ hCART19, with or without MTR pre-treatment compared to UT-T, MTR and no treatment (n = 5 mice per group). Survival differences were evaluated by two-sided log-rank test. d, e, Levels of circulating adrenaline and noradrenaline (n = 3, 3, 5, 4, 4, 5, 4, 5, 7, 8) (d) and of indicated circulating mouse and human cytokines (n = 4 samples per group) (e), assessed 24 and 72 h after administration of hCART19 with or without MTR in comparison to controls. Data are presented as mean ± s.d. with individual data points shown, analysed by two-tailed t-test (a, b, d, e).
Fig. 5 |
Fig. 5 |. Inhibition of catecholamine synthesis with MTR does not impair the therapeutic response of hCART19.
a, Serial bioluminescence imaging (BLI) of Raji-bearing NSGS mice (low tumour burden)at day 6 and 19 after treatment with 1.5 × 10⁷ hCART19, with or without MTR (n = 10 mice per group) compared to control (UT-T), with or without MTR (n = 5 mice per group). BLI counts were used to quantify the tumour burden during the treatment course (right). Statistical differences were evaluated by one-tailed t-test. b, Corresponding Kaplan–Meier curve of Raji-bearing NSGS mice with low tumour burden, treated with 1.5 × 10⁷ hCART19, with or without MTR pre-treatment (n = 10 mice per group) in comparison to control (UT-T), with or without MTR (n = 5 mice per group). Survival differences were analysed by weighted log-rank test (see Methods). c, d, Levels of plasma adrenaline (n = 3, 3, 4 per column) and noradrenaline (n = 3, 4, 7) (c) and HsIFN-γ (n = 4), HsTNF (n = 4, 3, 3), and mouse cytokines MmIL-6 (n = 3) and MmKC (n = 3) (d), assessed 72 h after hCART19 treatment. Data are presented as mean ± s.d. with individual data points shown, analysed by two-tailed t-test. e, Scheme showing how inhibition of the catecholamine pathway may reduce CRS. TLR, toll-like receptor.

Comment in

References

    1. van der Poll T, van de Veerdonk FL, Scicluna BP & Netea MG The immunopathology of sepsis and potential therapeutic targets. Nat. Rev. Immunol 17, 407–420 (2017). - PubMed
    1. Hansel TT, Kropshofer H, Singer T, Mitchell JA & George AJ The safety and side effects of monoclonal antibodies. Nat. Rev. Drug Discov 9, 325–338 (2010). - PubMed
    1. Rommelfanger DM et al. The efficacy versus toxicity profile of combination virotherapy and TLR immunotherapy highlights the danger of administering TLR agonists to oncolytic virus-treated mice. Mol. Ther 21, 348–357 (2013). - PMC - PubMed
    1. Maude SL, Barrett D, Teachey DT & Grupp SA Managing cytokine release syndrome associated with novel T cell-engaging therapies. Cancer J 20, 119–122 (2014). - PMC - PubMed
    1. Parker BS, Rautela J & Hertzog PJ Antitumour actions of interferons: implications for cancer therapy. Nat. Rev. Cancer 16, 131–144 (2016). - PubMed

Publication types

MeSH terms

LinkOut - more resources