

Genetic evidence for a western Chinese origin of broomcorn millet (Panicum miliaceum)
- PMID: 30542237
- PMCID: PMC6236650
- DOI: 10.1177/0959683618798116
Genetic evidence for a western Chinese origin of broomcorn millet (Panicum miliaceum)
Abstract
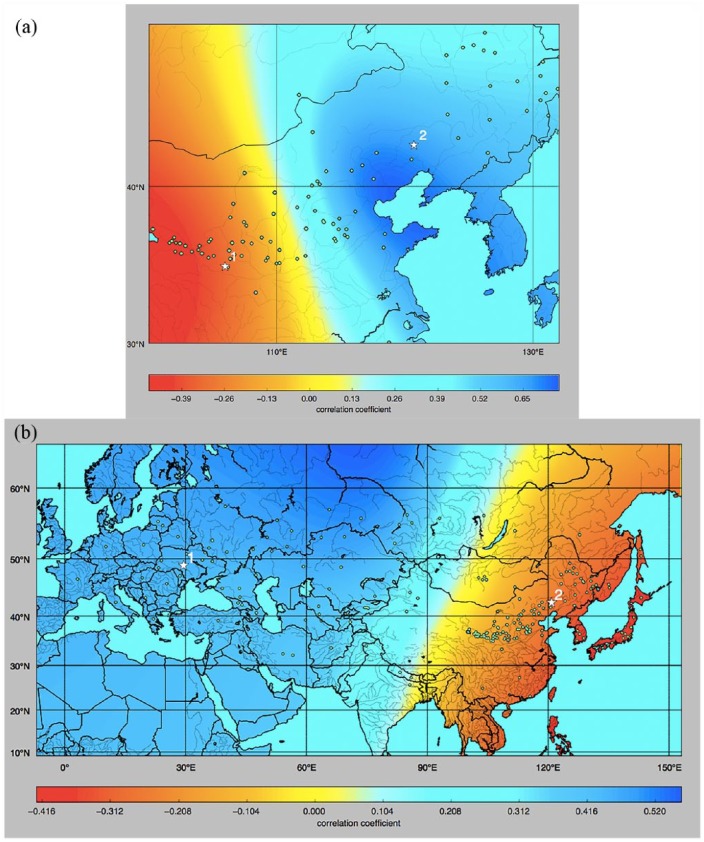
Broomcorn millet (Panicum miliaceum) is a key domesticated cereal that has been associated with the north China centre of agricultural origins. Early archaeobotanical evidence for this crop has generated two major debates. First, its contested presence in pre-7000 cal. BP sites in eastern Europe has admitted the possibility of a western origin. Second, its occurrence in the 7th and 8th millennia cal. BP in diverse regions of northern China is consistent with several possible origin foci, associated with different Neolithic cultures. We used microsatellite and granule-bound starch synthase I (GBSSI) genotype data from 341 landrace samples across Eurasia, including 195 newly genotyped samples from China, to address these questions. A spatially explicit discriminative modelling approach favours an eastern Eurasian origin for the expansion of broomcorn millet. This is consistent with recent archaeobotanical and chronological re-evaluations, and stable isotopic data. The same approach, together with the distribution of GBSSI alleles, is also suggestive that the origin of broomcorn millet expansion was in western China. This second unexpected finding stimulates new questions regarding the ecology of wild millet and vegetation dynamics in China prior to the mid-Holocene domestication of millet. The chronological relationship between population expansion and domestication is unclear, but our analyses are consistent with the western Loess Plateau being at least one region of primary domestication of broomcorn millet. Patterns of genetic variation indicate that this region was the source of populations to the west in Eurasia, which broomcorn probably reached via the Inner Asia Mountain Corridor from the 3rd millennium BC. A secondary westward expansion along the steppe may have taken place from the 2nd millennium BC.
Keywords: China; Loess Plateau; Panicum; agricultural origins; broomcorn millet; domestication; early Holocene; semi-arid.
Figures
Similar articles
-
Waxy phenotype evolution in the allotetraploid cereal broomcorn millet: mutations at the GBSSI locus in their functional and phylogenetic context.Mol Biol Evol. 2013 Jan;30(1):109-22. doi: 10.1093/molbev/mss209. Epub 2012 Aug 30. Mol Biol Evol. 2013. PMID: 22936718 Free PMC article.
-
Genetic diversity and phylogeography of broomcorn millet (Panicum miliaceum L.) across Eurasia.Mol Ecol. 2011 Nov;20(22):4756-71. doi: 10.1111/j.1365-294X.2011.05318.x. Epub 2011 Oct 18. Mol Ecol. 2011. PMID: 22004244 Free PMC article.
-
New AMS 14C dates track the arrival and spread of broomcorn millet cultivation and agricultural change in prehistoric Europe.Sci Rep. 2020 Aug 13;10(1):13698. doi: 10.1038/s41598-020-70495-z. Sci Rep. 2020. PMID: 32792561 Free PMC article.
-
Millets, dogs, pigs and permanent settlement: productivity transitions in Neolithic northern China.Evol Hum Sci. 2024 Nov 11;6:e44. doi: 10.1017/ehs.2024.31. eCollection 2024. Evol Hum Sci. 2024. PMID: 39703940 Free PMC article. Review.
-
On the Origins and Dissemination of Domesticated Sorghum and Pearl Millet across Africa and into India: a View from the Butana Group of the Far Eastern Sahel.Afr Archaeol Rev. 2018;35(4):483-505. doi: 10.1007/s10437-018-9314-2. Epub 2018 Nov 10. Afr Archaeol Rev. 2018. PMID: 30880862 Free PMC article. Review.
Cited by
-
Crops For the Future (CFF): an overview of research efforts in the adoption of underutilised species.Planta. 2019 Sep;250(3):979-988. doi: 10.1007/s00425-019-03179-2. Epub 2019 Jun 27. Planta. 2019. PMID: 31250097 Review.
-
Recovery of chloroplast genomes from medieval millet grains excavated from the Areni-1 cave in southern Armenia.Sci Rep. 2022 Sep 7;12(1):15164. doi: 10.1038/s41598-022-17931-4. Sci Rep. 2022. PMID: 36071150 Free PMC article.
-
Modification on phenolic profiles and enhancement of antioxidant activity of proso millets during germination.Food Chem X. 2023 Mar 5;18:100628. doi: 10.1016/j.fochx.2023.100628. eCollection 2023 Jun 30. Food Chem X. 2023. PMID: 36949751 Free PMC article.
-
The spatiotemporal spread of human migrations during the European Holocene.Proc Natl Acad Sci U S A. 2020 Apr 21;117(16):8989-9000. doi: 10.1073/pnas.1920051117. Epub 2020 Apr 1. Proc Natl Acad Sci U S A. 2020. PMID: 32238559 Free PMC article.
-
The place of millet in food globalization during Late Prehistory as evidenced by new bioarchaeological data from the Caucasus.Sci Rep. 2021 Jun 23;11(1):13124. doi: 10.1038/s41598-021-92392-9. Sci Rep. 2021. PMID: 34162920 Free PMC article.
References
-
- Aliscioni SS, Giussani LM, Zuloaga FO, et al. (2003) A molecular phylogeny of Panicum (Poaceae: Paniceae): Tests of monophyly and phylogenetic placement within the Panicoideae. American Journal of Botany 90: 796–821. - PubMed
-
- Austerlitz F, Jung-Muller B, Godelle B, et al. (1997) Evolution of coalescence times, genetic diversity and structure during colonization. Theoretical Population Biology 51: 148–164.
-
- Baltensperger DD. (2002) Progress with proso, pearl and other milllets. In: Janick J, Whipkey A. (eds) Trends in New Crops and New Uses. Alexandria, VA: ASHS Press, pp. 100–103.
Grants and funding
LinkOut - more resources
Full Text Sources